Transcription
2019 FUEL CONSUMPTION GUIDEContentsIntroductionFuel consumption testingUnderstanding fuel consumption ratingsEnerGuide label for vehiclesChoosing the right vehicleFuel-efficient drivingMost fuel-efficient vehiclesFuel consumption ratings search toolUnderstanding the tablesVehicle tablesA. CarsB. VansC. Pickup trucksD. Sport utility vehicles (SUVs)E. Plug-in hybrid electric vehiclesF. Battery-electric vehicles112234445IntroductionThe 2019 Fuel Consumption Guide gives informationabout the fuel consumption of 2019 model year lightduty vehicles. You can use this information to comparevehicles as you shop for the most fuel-efficient vehiclethat meets your everyday needs.Remember as you shop that fuel is an expense you willbe paying for a long time. If you buy a fuel-efficientvehicle, drive it in fuel-efficient ways and follow themanufacturer’s maintenance recommendations, you'llsave money for years to come – even more if fuel pricesrise.Your vehicle choice affects the environmentThe more fuel your vehicle burns, the more greenhousegases it produces, mostly in the form of carbon dioxide,or CO2. For every litre of gasoline your vehicle uses, itgenerates about 2.3 kilograms (kg) of CO2. Although notdirectly harmful to our health, CO2 emissions contributeto climate change.Fuel consumption testingIt would be difficult to drive every model of new vehicleon the road to measure fuel consumption. And it wouldbe impossible to get repeatable results that way becauseso many factors – road conditions and weather, to namejust two – can affect a vehicle’s performance.That's why vehicle manufacturers use standard,controlled laboratory testing and analytical proceduresto generate the fuel consumption data that appear in thisguide, in the fuel consumption ratings search tool and onthe EnerGuide label for vehicles.Environment and Climate Change Canada collects thedata from vehicle manufacturers. Natural ResourcesCanada (NRCan) puts the data and other informationtogether to publish the Fuel Consumption Guide.Improved testingBefore model year 2015, manufacturers used the 2-cycletesting procedure, which tested vehicles under simulatedcity and highway conditions to find out how much fuelthey use.Manufacturers now use the 5-cycle testing procedure.The improved procedure tests for city and highwayconditions as well as operating a vehicle in cold weather,the use of air conditioners, and driving at higher speedswith more rapid acceleration and braking.5-cycle testing produces fuel consumption ratings thatare more representative of a vehicle’s on-road fuelconsumption.How 5-cycle testing worksA vehicle is driven about 6,000 km before testing. Thenthe test vehicle is placed on a machine called a chassisdynamometer, which is like a treadmill for vehicles. Thedynamometer is adjusted for things like the weight andaerodynamics of the specific vehicle. A driver runs thevehicle through standard driving cycles that simulatetrips in the city and on the highway.City and highway fuel consumption ratings come fromthe emissions generated during the five laboratorydriving cycles.For detailed test information, visit vehicles.nrcan.gc.ca.Not all vehicles are testedVehicle manufacturers are not required to submit fuelconsumption data for: sport utility vehicles (SUVs) and passenger vans with agross vehicle weight rating (GVWR) of more than 4,536kg (10,000 lb.) – GVWR is the weight of the vehicle plusmaximum carrying capacity (passengers and cargo) other vehicles with a GVWR of more than 3,856 kg(8,500 lb.) or a curb weight of more than 2,722 kg(6,000 lb.) – curb weight is the weight of the vehiclewithout passengers and cargo1
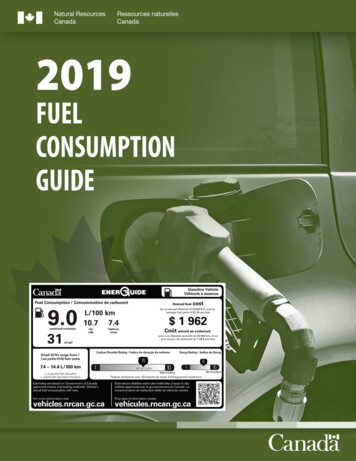
2019 FUEL CONSUMPTION GUIDEVehicles that exceed these limits are not tested, so theirfuel consumption ratings do not appear in the fuelconsumption ratings search tool or on the EnerGuidelabel.Understanding fuel consumptionratingsFuel consumption ratings give consumers reliableinformation about the relative fuel efficiency of vehicles.You can use this information to compare the fuelconsumption of different models and then choose themost fuel-efficient vehicle that meets your everydayneeds.Use this guide or the fuel consumption ratings searchtool to compare the fuel consumption information ofdifferent models. The vehicle with the best fuelconsumption ratings and lowest estimated annual fuelcost can save you fuel and money for years.Remember, the lower the litres per 100 kilometres(L/100 km) rating, the better the fuel consumption. Andthe higher the miles per gallon (mpg) rating, the betterthe fuel use.Your fuel consumption will varyFuel consumption ratings show the fuel consumptionthat may be achieved if you drive in fuel-efficient waysand properly maintain your vehicle. The ratings help youcompare the fuel consumption of different vehicles.However, it is impossible for a laboratory test to simulateall conditions that drivers may experience.for about 6,000 to 10,000 km.To watch our video about factors that affect fuelefficiency, visit vehicles.nrcan.gc.ca.Published ratings are a useful tool for comparingvehicles before you buy. But keep in mind that they’rebased on standard tests and may not accurately predictthe fuel consumption you will get on the road.EnerGuide label for vehiclesThe EnerGuide label gives model-specific fuelconsumption information for new light-duty vehiclesavailable for sale in Canada. This includes passenger cars,vans, pickup trucks and SUVs.Using EnerGuide labels, you can make comparisonsbetween vehicles and find the most fuel-efficient onethat meets your everyday needs.EnerGuide labels should remain on new vehicles untilthey are sold. If a new vehicle has no label, ask the dealerto give you the manufacturer’s fuel consumptioninformation for the vehicle.Here is a sample label for a gasoline vehicle – slightlydifferent labels appear on vehicles that use other typesof fuel.Your vehicle’s fuel consumption will vary from itspublished fuel consumption ratings, depending on how,where and when you drive.The following factors will affect the fuel consumption ofyour vehicle: How you accelerateHow fast you driveThe age and condition of your vehicleTemperature and weatherTraffic and road conditionsUsing air conditioning and other powered accessoriesUsing all-wheel and four-wheel driveAlso, there may be fuel consumption differences in thesame make and model because of small variations invehicle manufacturing. And some vehicles do not gettheir best fuel consumption until they have been driven1. Vehicle technology and fuel – The text and relatedicon identify the type of fuel used by the vehicle.2. Fuel consumption – This is a prominent combined fuelconsumption rating and separate city and highwayfuel consumption ratings in L/100 km. The combinedrating reflects 55% city and 45% highway driving.3. Fuel economy – Here, the combined rating isexpressed in miles per imperial gallon (mi/gal).4. Annual fuel cost – This is an estimate based on thecombined fuel consumption rating, 20,000 km drivenand the fuel price indicated.5. Vehicle class range – This shows the best and worst2
2019 FUEL CONSUMPTION GUIDEcombined fuel consumption ratings of vehicles in thesame class.6. CO2 and smog ratings – Here are the vehicle’s tailpipeemissions of CO2 and smog-forming pollutants ratedon a scale from 1 (worst) to 10 (best). The CO2emissions, in grams per kilometre driven, are shownon the CO2 bar.7. QR code - The quick-response code links smartphoneusers to the fuel consumption ratings search tool.Choosing the right vehicleThere are many things to consider when you buy a newvehicle: price, comfort, styling, environmental factorsand more. Choosing the most fuel-efficient vehicle thatmeets your everyday needs can save you money andhelp the environment.It’s worth putting some time into your choice. Fuelconsumption can range from less than 2.0 gasoline litresequivalent per 100 km (Le/100 km) for a battery-electricvehicle to more than 20.0 L/100 km for a large SUV.So driving 20,000 km a year can cost from less than 500to more than 4,000. Meanwhile, CO2 emissions canrange from 0 to more than 9 tonnes, depending on thevehicle you buy.Consider your powertrainA vehicle’s powertrain is made up of the components –such as the engine, transmission, drive shaft, suspensionand the wheels – that make a vehicle go. Today, you canchoose from a wide range of powertrains.Hybrid-electric vehicles, or hybrids, use both aconventional internal combustion engine and an electricmotor, which is more energy efficient than aconventional powertrain, especially in city driving.Hybrids have battery packs that are charged withelectricity generated by the vehicle. They can’t beplugged in to recharge. When hybrids are operating inelectric-only mode, they emit no CO2 or other emissions.The typical hybrid offers fuel savings and CO2 reductionsof 20 to 40% over gasoline-only vehicles.To watch our video about hybrid-electric vehicles, visitvehicles.nrcan.gc.ca.Electric vehicles reduce greenhouse gas emissions andcan significantly reduce your fuel costs. There are twotypes of electric vehicles on the market – plug-in hybridelectric and battery-electric – and each has its benefits. Plug-in hybrid electric vehicles (PHEV) are hybrids thathave high-capacity batteries that can be recharged byplugging them in. When operating in electric-onlymode, PHEVs produce no tailpipe emissions.To watch our video about plug-in hybrid electricvehicles, visit vehicles.nrcan.gc.ca. Battery-electric vehicles (BEV) use electric motors thatdraw electricity from on-board rechargeable batteries.They are the most fuel-efficient vehicles available, withan average combined consumption rating of 2.3 Le/100km. BEVs produce no tailpipe emissions.To watch our video about battery-electric vehicles, visitvehicles.nrcan.gc.ca.Electric-drive motors are much more efficient thancombustion engines and drivetrains. The efficiency ofenergy conversion from on-board storage to turning thewheels is nearly five times greater for electricity thangasoline, at approximately 76% and 16%, respectively.Electric vehicles also increase a vehicle’s efficiency byusing regenerative braking technology to recover energythat would otherwise have been lost.PHEVs and BEVs can be recharged from a chargingstation that uses standard 240-volt electrical power (thekind used for stoves and clothes dryers in most homes).Most can be recharged from a 110-volt service, althoughcharging time will be significantly longer.Technology and other vehicle variablesCanada’s greenhouse gas emission standards arebecoming more stringent, and vehicle manufacturershave responded with a wide range of engineeringadvancements. These features can save you money andreduce your impact on the environment.A cylinder deactivation system (CDS) in a 6- or 8-cylinderengine shuts down half of the cylinders when only asmall amount of the engine’s power is needed. A CDS canlower fuel consumption by 4 to 10%.Turbochargers force air into an engine’s cylinders –unlike a standard engine, which draws air in atatmospheric pressure. This means that a smaller,turbocharged engine can produce the same power as alarger standard engine – and can lower fuel consumptionby 2 to 6%.Variable valve timing (VVT) and lift systems adjust thetiming of the engine valves to improve efficiency over awide range of engine operating speeds. That leads to3
2019 FUEL CONSUMPTION GUIDEbetter operation of the engine and a 1 to 6% reduction infuel consumption.Idle stop-start systems lower fuel consumption andexhaust emissions by turning off the engine when thevehicle is idling and during deceleration at low speeds.Idle stop-start technology can lower your fuelconsumption during city driving by 4 to 10% or more.Direct fuel injection increases your engine’s combustionefficiency because of a higher level of precision over theamount of fuel injected into the cylinder, the timing ofthe injection and the spray pattern. Direct injection canlower fuel consumption by 1 to 3%.If you shop smart, you can save fuel – and money – foryears to come. Find more information about factors thataffect fuel efficiency and tips for buying a fuel-efficientvehicle at vehicles.nrcan.gc.ca.pickup trucks and SUVs are most fuel-efficient whenthey’re travelling between 50 and 80 km per hour. Abovethis speed zone, vehicles use increasingly more fuel thefaster they go.5. Coast to decelerateEvery time you use your brakes, you waste your forwardmomentum. By looking ahead at how traffic is behaving,you can often see well in advance when it’s time to slowdown. You will conserve fuel and save money by takingyour foot off the accelerator and coasting to slow downinstead of using your brakes.See more ways to use less fuel at vehicles.nrcan.gc.ca.Most fuel-efficient vehiclesFuel-efficient drivingNRCan recognizes the most fuel-efficient new light-dutyvehicles sold in Canada. Best-in-class vehicles have thelowest combined fuel consumption rating, based on 55%city and 45% highway driving.Fuel-efficient driving can save you hundreds of dollars infuel each year, improve road safety and prevent wear onyour vehicle.For each class, the most fuel-efficient conventionalvehicle and the most efficient electric vehicle (whereapplicable) are recognized.Adopt these 5 fuel-efficient driving techniques to loweryour vehicle’s fuel consumption and CO2 emissions by asmuch as 25%:To see the most fuel-efficient vehicles for model year2019, visit vehicles.nrcan.gc.ca.1. Accelerate gentlyThe harder you accelerate the more fuel you use. In thecity, you can use less fuel by easing onto the acceleratorpedal gently. To be as fuel-efficient as possible, take 5seconds to accelerate your vehicle up to 20 kilometresper hour from a stop.Fuel consumption ratings search toolUse the fuel consumption ratings search tool atvehicles.nrcan.gc.ca to compare the fuel consumptioninformation of 1995 to 2019 model year vehicles.2. Maintain a steady speedWhen your speed dips and bursts, you use more fuel, andspend more money, than you need to. Tests have shownthat varying your speed up and down between 75 and 85km per hour every 18 seconds can increase your fuel useby 20%.3. Anticipate trafficLook ahead while you’re driving to see what is comingup. And keep a comfortable distance between yourvehicle and the one in front of you. By looking closely atwhat pedestrians and other cars are doing, and imaginingwhat they’ll do next, you can keep your speed as steadyas possible and use less fuel. It’s also safer to drive thisway.4. Avoid high speedsKeep to the speed limit and save on fuel! Most cars, vans,4
2019 FUEL CONSUMPTION GUIDEUnderstanding the tablesModelFuel typeAWD All-wheel drive – vehicle designed to operate with allwheels poweredX regular gasoline; Z premium gasoline; D diesel; E E85;B electricity; N natural gas4WD/4X4 Four-wheel drive – vehicle designed to operatewith either two wheels or four wheels poweredFuel consumptionFFV Flexible-fuel vehicle – vehicle designed to operate ongasoline and ethanol blends of up to 85% ethanolSWB Short wheelbase; LWB Long wheelbase; EWB Extended wheelbaseFuel consumption ratings are shown in litres per 100 kilometres(L/100 km). To compare fuel economy ratings expressed inmiles per imperial gallon (mpg) or in miles per U.S. gallon (mpgU.S.), use our fuel consumption ratings search tool.City rating – represents urban driving in stop-and-go trafficClassCarsVehicle classInterior volumeTwo-seater (T)n/aMinicompact (I)less than 2,405 L (85 cu. ft.)Subcompact (S)2,405–2,830 L (85–99 cu. ft.)Compact (C)2,830–3,115 L (100–109 cu. ft.)Mid-size (M)3,115–3,400 L (110–119 cu. ft.)Full-size (L)3,400 L (120 cu. ft.) or moreStation wagonSmall (WS)Mid-size (WM)less than 3,680 L (130 cu. ft.)3,680–4,530 L (130–159 cu. ft.)Light trucksVehicle classPickup truckSmall (PS)Standard (PL)Sport utility vehicleSmall (US)Standard (UL)Gross vehicle weight ratingless than 2,722 kg (6,000 lb.)2,722–3,856 kg (6,000–8,500 lb.)less than 2,722 kg (6,000 lb.)2,722–4,536 kg (6,000–10,000 lb.)Minivan (V)less than 3,856 kg (8,500 lb.)VanCargo (VC)Passenger (VP)less than 3,856 kg (8,500 lb.)less than 4,536 kg (10,000 lb.)Special purpose vehicle (SP)less than 3,856 kg (8,500 lb.)Engine size/Motor/CylindersTotal displacement of all cylinders (in litres [L]); electric motorpeak power output (in kilowatts [kW]); number of enginecylindersTransmissionA automatic; AM automated manual; AS automatic withselect shift; AV continuously variable; M manual; numberof gears/speeds (1–10)Highway rating – represents a mix of open highway and ruralroad driving, typical of longer tripsCombined rating – reflects 55% city driving and 45% highwaydrivingThe combined rating is calculated using city and highwayvalues that are later rounded for publication. Consequently,vehicles with identical published city and highway ratings maynot have identical combined ratings because of the roundingprocess.For FFVs, consumption values are provided for both gasolineand E85. For plug-in hybrid electric vehicles (PHEVs), values areprovided for electric-only or blended electric and gasolinemode, and for gasoline-only operation.To help you compare vehicles that use electricity, a conversionfactor is used to convert electrical energy consumption values,expressed in kilowatt hours per 100 kilometres (kWh/100 km),into gasoline litres equivalent per 100 kilometres (Le/100 km).One litre of gasoline contains the energy equivalent to 8.9 kWhof electricity.Annual fuel costEstimated annual fuel cost is based on the combined rating, adriving distance of 20,000 km and forecast prices of 1.02/L forregular gasoline, 1.17/L for premium gasoline, 1.01/L fordiesel fuel and 0.13/kWh for electricity. Pricing for E85 is notprovided.For PHEVs, annual fuel cost values reflect a mix of electricmode and gasoline-only operation.CO2 emissionsThe vehicle’s tailpipe emissions of carbon dioxide are shown ingrams per kilometre (g/km) for combined city and highwaydriving. For PHEVs, CO2 emissions values reflect a mix ofelectric mode and gasoline-only operation.5
2019 FUEL CONSUMPTION GUIDECO2 ratingRangeThe vehicle’s tailpipe emissions of carbon dioxide are rated ona scale from 1 (worst) to 10 (best).For PHEVs and battery-electric vehicles (BEVs), range is theestimated driving distance (in kilometres) on a fully chargedbattery or full tank of fuel.Smog ratingRecharge timeThe vehicle’s tailpipe emissions of smog-forming pollutants arerated on a scale from 1 (worst) to 10 (best).For PHEVs and BEVs, recharge time is the estimated time (inhours) to fully recharge the battery at 240 volts.Converting to miles per gallonTo convert between L/100 km and mpg, use the following formulas:mpg 282.48 L/100 kmL/100 km 282.48 mpg4.546 L 1 imperial gallon 1.2 U.S. gallonsTo convert between L/100 km and mpg (U.S.), use the following formulas:mpg (U.S.) 235.21 L/100 kmL/100 km 235.21 mpg (U.S.)3.785 L 1 U.S. gallonL/100 41947156474035312826242220mpg (U.S.)118785947393429262421201817Note: Many vehicles now have an onboard trip computer that can display on-road fuel use. In addition tofuel consumption values displayed in L/100 km, fuel economy values are usually displayed in mpg (U.S.).6
UPDATED: NOVEMBER 5, 20192019 FUEL CONSUMPTION GUIDEACARSCLASSENGINE SIZE (L)CYLINDERSTRANSMISSIONFUEL TYPECITYHIGHWAYCOMBINED PER YEARCO2 EMISSIONS (g/km)CO2 RATINGSMOG RATINGCONSUMPTION (L/100 KM)ILXC2.44AM8Z9.97.08.6 2,01219963NSXT3.56AM9Z11.110.811.0 2,57426143RLX HYBRIDM3.56AM7Z8.48.28.4 1,96619667TLXC2.44AM8Z10.07.18.7 2,03620563TLX A-SPECC2.44AM8Z10.27.48.9 2,08320953TLX SH-AWDC3.56AS9Z11.47.79.8 2,29322853TLX SH-AWD A-SPECC3.56AS9Z12.08.210.3 2,410240534C COUPET1.84AM6Z9.76.98.4 1,966197614C SPIDERT1.84AM6Z9.76.98.4 1,96619761GIULIAM2.04A8Z10.07.28.7 2,03620563GIULIA AWDM2.04A8Z10.57.79.2 2,15321753GIULIA QUADRIFOGLIOM2.96A8Z13.89.611.9 2,78528043DB11 V8I4.08A8Z13.09.811.5 2,69127143DB11 AMRI5.212A8Z15.510.613.3 3,11231233DBS SUPERLEGGERAI5.212A8Z16.410.713.8 3,22932433RAPIDE AMRS6.012A8Z16.710.914.1 3,29933233MAKEMODELACURAALFA ROMEOASTON MARTINVANQUISH ZAGATOI6.012A8Z17.511.414.7 3,44034623VANTAGE V8T4.08A8Z12.79.411.2 2,62126443A3S2.04AM7X9.16.88.1 1,65218867A3 QUATTROS2.04AM7X10.97.99.6 1,95822557A3 CABRIOLET QUATTROS2.04AM7X10.77.99.5 1,93822157A4C2.04AM7Z8.66.97.8 1,82518275A4 QUATTROC2.04AM7Z10.07.08.7 2,03620465A4 ALLROAD QUATTROC2.04AM7Z10.78.09.5 2,22322165A5 QUATTROS2.04AM7Z10.07.08.7 2,03620465A5 CABRIOLET QUATTROS2.04AM7Z10.07.08.7 2,03620465A5 SPORTBACK QUATTROM2.04AM7Z10.07.08.7 2,03620465A6 QUATTROM3.06AM7Z10.78.29.6 2,24622455A7 QUATTROM3.06AM7Z10.78.29.6 2,24622455A8LL3.06AS8Z12.58.610.8 2,52720263RS 3S2.55AM7Z12.48.410.6 2,48024743RS 5 COUPES2.96AS8Z13.38.711.3 2,64426245RS 5 SPORTBACKS2.96AS8Z13.59.011.5 2,69126845AUDIFOR CONTINUOUSLY UPDATED RATINGS, USE OUR FUEL CONSUMPTION RATINGS SEARCH TOOL AT vehicles.nrcan.gc.ca.
UPDATED: NOVEMBER 5, 20192019 FUEL CONSUMPTION GUIDEACARSENGINE SIZE (L)CYLINDERSTRANSMISSIONFUEL TYPECITYHIGHWAYCOMBINED PER YEARCO2 EMISSIONS (g/km)CO2 RATINGSMOG RATINGCONSUMPTION (L/100 KM)S3S2.04AM7Z10.78.09.5 2,22322253S4C3.06AS8Z11.38.09.8 2,29323055S5S3.06AS8Z11.38.09.8 2,29323055S5 CABRIOLETS3.06AS8Z11.48.29.9 2,31723455S5 SPORTBACKMAKECLASSMODELM3.06AS8Z11.38.09.8 2,29323055TT COUPE QUATTROS2.04AM7X10.37.79.2 1,87721357TT ROADSTER QUATTROT2.04AM7X10.37.79.2 1,87721357TT RS COUPES2.55AM7Z12.08.310.3 2,41024153TTS COUPES2.04AM7Z10.48.29.4 2,20022053M6.88AS8Z24.514.420.0 4,68046511230i xDRIVE CABRIOLETS2.04AS8Z10.27.28.8 2,05920767230i xDRIVE COUPES2.04AS8Z9.97.18.6 2,01220267330i xDRIVEC2.04AS8Z9.56.98.3 1,94219467330i xDRIVE GRAN TURISMOL2.04AS8Z10.27.28.8 2,05920767WS2.04AS8Z10.27.28.8 2,05920767430i xDRIVE CABRIOLETS2.04AS8Z10.67.39.1 2,12921357430i xDRIVE COUPEC2.04AS8Z10.27.28.8 2,05920767430i xDRIVE GRAN COUPEC2.04AS8Z10.27.28.8 2,05920767440i COUPEC3.06AS8Z11.27.39.4 2,20022753440i COUPEC3.06M6Z12.88.811.0 2,57425643440i xDRIVE CABRIOLETS3.06AS8Z11.87.910.0 2,34023553440i xDRIVE COUPEC3.06AS8Z11.47.69.7 2,27022853440i xDRIVE COUPEC3.06M6Z13.08.511.0 2,57425643440i xDRIVE GRAN COUPEC3.06AS8Z11.47.69.7 2,27022853530i xDRIVEM2.04AS8Z10.27.28.8 2,05920767540i xDRIVEM3.06AS8Z11.28.19.8 2,29323155640i xDRIVE GRAN COUPEC3.06AS8Z12.38.410.5 2,45724843640i xDRIVE GRAN TURISMOL3.06AS8Z11.98.410.3 2,41024155650i xDRIVE GRAN COUPEC4.48AS8Z14.09.612.0 2,80828243750i xDRIVEL4.48AS8Z13.39.211.5 2,69126943BENTLEYMULSANNEBMW330i xDRIVE TOURING750Li xDRIVEL4.48AS8Z14.09.612.0 2,80828243ALPINA B6 xDRIVE GRAN COUPEC4.48AS8Z14.09.612.0 2,80828243ALPINA B7 xDRIVEL4.48AS8Z14.09.612.0 2,80828243M2 COMPETITIONS3.06AM7Z14.310.412.6 2,94829433M2 COMPETITIONS3.06M6Z13.49.611.7 2,73827343FOR CONTINUOUSLY UPDATED RATINGS, USE OUR FUEL CONSUMPTION RATINGS SEARCH TOOL AT vehicles.nrcan.gc.ca.
UPDATED: NOVEMBER 5, 20192019 FUEL CONSUMPTION GUIDEACARSCLASSENGINE SIZE (L)CYLINDERSTRANSMISSIONFUEL TYPECITYHIGHWAYCOMBINED PER YEARCO2 EMISSIONS (g/km)CO2 RATINGSMOG RATINGCONSUMPTION (L/100 KM)M240i CABRIOLETS3.06AS8Z11.27.89.7 2,27022753M240i CABRIOLETS3.06M6Z12.88.811.0 2,57425643M240i COUPES3.06AS8Z11.27.89.7 2,27022753M240i COUPES3.06M6Z12.88.811.0 2,57425643M240i COUPE M PERFORMANCES3.06AS8Z11.27.89.7 2,27022753M240i COUPE M PERFORMANCES3.06M6Z12.88.811.0 2,57425643M240i xDRIVE CABRIOLETS3.06AS8Z11.38.09.8 2,29322953M240i xDRIVE COUPES3.06AS8Z11.38.09.8 2,29322953M240i xDRIVE COUPE MPERFORMANCES3.06AS8Z11.38.09.8 2,29322953M4 CABRIOLETS3.06AM7Z14.510.512.7 2,97229933M4 CABRIOLETS3.06M6Z13.89.411.9 2,78528043M4 CABRIOLET COMPETITIONS3.06AM7Z14.510.512.7 2,97229933M4 CABRIOLET COMPETITIONS3.06M6Z13.89.411.9 2,78528043M4 COUPEC3.06AM7Z14.310.412.6 2,94829433M4 COUPEC3.06M6Z13.49.611.7 2,73827343M4 COUPE COMPETITIONC3.06AM7Z14.310.412.6 2,94829433M4 COUPE COMPETITIONC3.06M6Z13.49.611.7 2,73827343M4 CSC3.06AM7Z14.310.412.6 2,94829433M5M4.48AS8Z16.011.213.9 3,25332433M5 COMPETITIONM4.48AS8Z16.011.213.9 3,25332433M550i xDRIVEM4.48AS8Z13.39.211.5 2,69126943M6 GRAN COUPEAM7Z17.311.614.7 3,44034421MAKEMODELC4.48M760Li xDRIVEL6.612AS8Z17.711.915.1 3,53335523M850i xDRIVE CABRIOLETS4.48AS8Z13.59.211.6 2,71427043M850i xDRIVE COUPES4.48AS8Z13.39.211.5 2,69126943T8.016AM7Z26.816.622.2 5,19552211LACROSSEM3.66AS9X11.77.89.9 2,02023355LACROSSE eASSISTM2.54AS6X9.46.88.2 1,67319265LACROSSE AWDM3.66AS9X11.78.210.1 2,06023855REGALM2.04AS9Z10.67.49.1 2,12921455REGAL AWDM2.04AS8Z11.08.09.6 2,24622755REGAL AWDM3.66AS9X12.48.710.7 2,18325145L3.06AS10Z13.19.111.3 2,64426743BUGATTICHIRONBUICKCADILLACCT6 AWDFOR CONTINUOUSLY UPDATED RATINGS, USE OUR FUEL CONSUMPTION RATINGS SEARCH TOOL AT vehicles.nrcan.gc.ca.
UPDATED: NOVEMBER 5, 20192019 FUEL CONSUMPTION GUIDEACARSCLASSENGINE SIZE (L)CYLINDERSTRANSMISSIONFUEL TYPECITYHIGHWAYCOMBINED PER YEARCO2 EMISSIONS (g/km)CO2 RATINGSMOG RATINGCONSUMPTION (L/100 KM)CT6 AWDL3.66AS10X13.08.811.1 2,26426145CT6 AWDL4.28AS10Z17.39.513.8 3,22932433CTSM2.04AS8Z11.07.89.5 2,22322255CTSM3.66AS8X12.38.210.5 2,14224645CTS AWDM2.04AS8Z11.48.19.9 2,31723255CTS AWDM3.66AS8X13.39.211.5 2,34626945CTS VsportM3.66AS8Z15.09.912.7 2,97229833CTS-VM6.28AS8Z17.111.014.3 3,34633721XTSL3.66AS6X12.98.711.0 2,24425945XTS AWDL3.66AS6X13.79.011.6 2,36627245XTS Vsport AWDL3.66AS6Z15.010.112.8 2,99530233CAMAROS2.04AS8Z10.87.79.4 2,20022055CAMAROS2.04M6Z11.97.910.1 10.4 2,12224655CAMAROS3.66M6X14.38.811.8 2,40727745CAMARO SSS6.28AS10Z14.58.812.0 2,80827941CAMARO SSS6.28M6Z14.99.912.6 2,94829731CAMARO ZL1AS10Z18.311.215.1 3,53335521S6.28CAMARO ZL1S6.28M6Z17.212.014.9 3,48734921CORVETTET6.28AS8Z15.69.212.7 2,97229931CORVETTET6.28M7Z14.69.312.2 2,85528631CORVETTE Z06T6.28AS8Z17.210.114.0 3,27633131CORVETTE Z06T6.28M7Z15.910.613.5 3,15931831CORVETTE ZR1T6.28AS8Z19.512.016.1 3,76738121CORVETTE ZR1T6.28M7Z18.212.515.6 3,65036821CRUZEC1.44AS6X8.36.27.3 1,48917276CRUZE PREMIERAS6X8.36.27.3 1,48917276C1.44CRUZE DIESELC1.64A9D7.64.96.4 1,29317273CRUZE HATCHBACKM1.44AS6X8.36.27.3 1,48917276CRUZE HATCHBACK PREMIERM1.44AS6X8.56.47.5 1,53017576CRUZE HATCHBACK DIESELM1.64A9D7.85.26.6 1,33317873IMPALAL2.54AS6X10.88.09.6 1,95822553IMPALAL3.66AS6X12.78.510.8 8.26.67.5 1,53017476MALIBUM2.04A9Z10.57.49.1 2,12921455FOR CONTINUOUSLY UPDATED RATINGS, USE OUR FUEL CONSUMPTION RATINGS SEARCH TOOL AT vehicles.nrcan.gc.ca.
UPDATED: NOVEMBER 5, 20192019 FUEL CONSUMPTION GUIDEACARSCLASSENGINE SIZE (L)CYLINDERSTRANSMISSIONFUEL TYPECITYHIGHWAYCOMBINED PER YEARCO2 EMISSIONS (g/km)CO2 RATINGSMOG RATINGCONSUMPTION (L/100 KM)MALIBU HYBRIDM1.84AVX4.85.55.1 1,040121105SPARKS1.44AVX7.96.27.1 1,44816785SPARKS1.44M5X8.06.27.2 1,46917085300L3.66A8X12.47.810.3 2,10124253300 FFVL3.66A8X12.47.810.3 9.412.3 2,50928933300 AWDL3.66A8X12.88.711.0 2,24425843300 AWD FFVL3.66A8X12.88.711.0 A8X12.47.810.3 2,10124253CHALLENGERM5.78M6Z15.610.113.1 3,06530731CHALLENGERM6.48M6Z16.710.413.9 3,25332531CHALLENGER (MDS)M5.78A8X14.79.412.3 2,50928933CHALLENGER (MDS)M6.48A8Z15.89.613.0 3,04230431CHALLENGER GT AWDM3.66A8X12.88.711.0 2,24425843CHALLENGER SRT HELLCATM6.28A8Z17.610.714.5 3,39333921CHALLENGER SRT HELLCATM6.28M6Z18.111.415.1 3,53335221CHALLENGER SRT HELLCATREDEYEM6.28A8Z17.610.714.5 3,39333921CHARGERL3.66A5X13.79.011.6 2,36627143CHARGER FFVL3.66A5X13.79.011.6 12.47.810.3 2,10124253CHARGER FFVL3.66A8X12.47.810.3 0.614.2CHARGER (MDS)L5.78A5X15.69.712.9 2,63230233CHARGER (MDS)L5.78A8X14.79.412.3 2,50928933CHARGER (MDS)L6.48A8Z15.89.613.0 3,04230431CHARGER AWDL3.66A8X12.88.711.0 2,24425843CHARGER AWD FFVL3.66A8X12.88.711.0 2,24425843L3.66A8E17.612.015.024843CHARGER AWD (MDS)L5.78A5X16.010.113.3 2,71331233CHARGER SRT HELLCATL6.28A8Z17.610.714.5 3,39333921FOR CONTINUOUSLY UPDATED RATINGS, USE OUR FUEL CONSUMPTION RATINGS SEARCH TOOL AT vehicles.nrcan.gc.ca.
UPDATED: NOVEMBER 5, 20192019 FUEL CONSUMPTION GUIDEACARSCLASSENGINE SIZE (L)CYLINDERSTRANSMISSIONFUEL TYPECITYHIGHWAYCOMBINED PER YEARCO2 EMISSIONS (g/km)CO2 RATINGSMOG RATINGCONSUMPTION (L/100 KM)124 SPIDERT1.44A6X9.36.58.0 1,63218763124 SPIDERT1.44M6X9.06.77.9 1,61218573500I1.44A6X9.77.48.7 1,77520363500I1.44M5X8.57.17.9 1,61218673500LWS1.44A6X10.77.99.4 1,91822153FIESTAS1.64AM6X8.66.47.6 1,55017873FIESTAS1.64M5X8.86.87.9 1,61218473FIESTA STS1.64M6X9.27.48.4 1,71419663FUSIONM1.54AS6X10.07.08.7 1,77520467FUSION HYBRIDM2.04AVX5.55.65.6 1,14213197GTT3.56AM7Z20.413.117.1 4,00140213MUSTANGS2.34AS10X11.27.39.4 1,91822155MAKEMODELFIATFORDMUSTANG (Performance Pkg)S2.34AS10X11.88.410.3 2,10124255MUSTANGS2.34M6X11.27.99.7 1,97922755MUSTANG (Performance Pkg)S2.34M6X11.88.710.4 2,12224455MUSTANGS5.08AS10X15.09.112.3 2,50928933MUSTANGS5.08M6X16.19.913.3 2,71331133MUSTANG BULLITTS5.08M6X16.19.913.3 2,71331133MUSTANG CONVERTIBLES2.34AS10X11.98.410.4 2,12224355MUSTANG CONVERTIBLES2.34M6X11.88.410.3 2,10124155MUSTANG CONVERTIBLES5.08AS10X15.49.712.9 2,63230233SHELBY GT350 MUSTANGS5.28M6Z17.211.314.6 3,41634123TAURUS FFVL3.56AS6X13.59.011.5 2,34627043L3.56AS6E17.812.115.225443TAURUS AWDL3.56AS6X14.610.012.5 2,55029433TAURUS FFV AWDL3.56AS6X14.09.912.4 88.510.9 2,55125543G70 AWDC2.04AS8Z11.58.710.3 2,41024153G70 AWDC3.36AS8Z13.39.511.6 2,71427443G80 AWDL3.36AS8Z13.89.711.9 2,78528243G80 AWDL3.86AS8X13.49.611.7 2,38727645G80 AWDL5.08AS8Z15.610.413.2 3,08931235G90 AWDL3.36AS8Z13.79.711.9 2,78527943GENESISFOR CONTINUOUSLY UPDATED RATINGS, USE OUR FUEL CONSUMPTION RATINGS SEARCH TOOL AT vehicles.nrcan.gc.ca.
UPDATED: NOVEMBER 5, 20192019 FUEL CONSUMPTION GUIDEACARSCLASSENGINE SIZE (L)CYLINDERSTRANSMISSIONFUEL TYPECITYHIGHWAYCOMBINED PER YEARCO2 EMISSIONS (g/km)CO2 RATINGSMOG RATINGCONSUMPTION (L/100 KM)L5.08AS8Z1
3 combined fuel consumption ratings of vehicles in the same class. 6. CO 2 and smog ratings - Here are the vehicle's tailpipe emissions of CO2 and smog-forming pollutants rated on a scale from 1 (worst) to 10 (best). The CO2 emissions, in grams per kilometre driven, are shown
