Transcription
Quarterly Report to thePennsylvania Public Utility CommissionFor the PeriodJune 1, 2015 through August 31, 2015Program Year 7, Quarter 1For Pennsylvania Act 129 of 2008Energy Efficiency and Conservation PlanPrepared by Pennsylvania Power Company and ADM Associates, Inc.ForPennsylvania Power CompanyDocket No. M-2012-2334395October 15, 2015
October 15, 2015 Quarterly Report to the PA PUC – Program Year 6 Quarter 1Table of ContentsTABLE OF CONTENTS. IACRONYMS . II1OVERVIEW OF PORTFOLIO. 41.1SUMMARY OF ACHIEVEMENTS .51.2PROGRAM UPDATES AND FINDINGS .71.3EVALUATION UPDATES AND FINDINGS .112SUMMARY OF ENERGY IMPACTS BY PROGRAM . 123SUMMARY OF DEMAND IMPACTS BY PROGRAM . 144SUMMARY OF FINANCES . 164.1PORTFOLIO LEVEL EXPENDITURES .164.2PROGRAM LEVEL EXPENDITURES .17Pennsylvania Power Company Page i
October 15, 2015 Quarterly Report to the PA PUC – Program Year 6 Quarter 1AcronymsC&ICATICFLPhase IIPhase II-COPhase II-QPhase hLEDLEEPLIURPM&VMWMWhNTGPA PUCPY5PY6PY7PY8Commercial and IndustrialComputer-Aided Telephone InterviewCompact Fluorescent LampCumulative Program/Portfolio Phase II Inception to Date (Phase II Savings)Cumulative Program/Portfolio Phase II Inception to Date including CarryOver Savings from Phase IPhase II verified gross savings from the beginning of Phase II PYTDreported gross savings.Phase II verified gross savings from the beginning of Phase II verifiedCarry Over Savings from Phase I PYTD reported gross savingsCurtailment Service ProviderConservation Voltage ReductionConservation Voltage Reduction factorDirect Load ControlDemand ResponseElectric Distribution CompanyEnergy Efficiency and ConservationEvaluation, Measurement, and VerificationGovernment, Non-Profit, InstitutionalHeating, Ventilating, and Air ConditioningImplementation Conservation Service ProviderIncremental QuarterKilowattKilowatt-hourLight Emitting DiodeLow-Income Energy Efficiency ProgramLow-Income Usage Reduction ProgramMeasurement and ylvania Public Utility CommissionProgram Year 2013, from June 1, 2013 to May 31, 2014Program Year 2014, from June 1, 2010 to May 31, 2015Program Year 2015, from June 1, 2011 to May 31, 2016Program Year 2016, from June 1, 2012 to May 31, 2017Pennsylvania Power Company Page ii
October 15, 2015 Quarterly Report to the PA PUC – Program Year 6 Quarter 1PYX QXPYTDSEERSWETRCTRMProgram Year X, Quarter XProgram Year to DateSeasonal Energy Efficiency RatingStatewide EvaluatorTotal Resource CostTechnical Reference ManualPennsylvania Power Company Page iii
October 15, 2015 Quarterly Report to the PA PUC – Program Year 6 Quarter 11 Overview of PortfolioPennsylvania Act 129 of 2008 signed on October 15, 2008, mandated energy savings and demandreduction goals for the largest electric distribution companies (EDCs) in Pennsylvania for Phase I (2008through 2013). In 2009, each EDC submitted energy efficiency and conservation (EE&C) plans—whichwere approved by the Pennsylvania Public Utility Commission (PUC)—pursuant to these goals. The PUCestablished energy savings and demand reduction goals for Phase II (June 2013 through May 2016) of theAct 129 programs. Each EDC filed new EE&C plans with the PA PUC in late 2012 for Phase II. These planswere subsequently approved by the PUC in early 2013.Implementation of Phase II of the Act 129 programs began on June 1, 2013. This report documents theprogress and effectiveness of the Phase II EE&C accomplishments for Pennsylvania Power Company (PennPower or Company) in the 1st quarter of Program Year 7 (PY7), defined as June 1, 2015 through August31, 2015, as well as the cumulative accomplishments of the programs since inception of Phase II. Thisreport also includes the energy savings carried over from Phase I that will be applied towards theCompany’s savings compliance targets for Phase II. The Phase I carryover values as listed in this quarterlyreport are based on the Company’s Final Phase I report to the Commission.The Company’s EM&V contractor, ADM Associates, is evaluating the programs, which includesmeasurement and verification of program savings.Pennsylvania Power Company Page 4
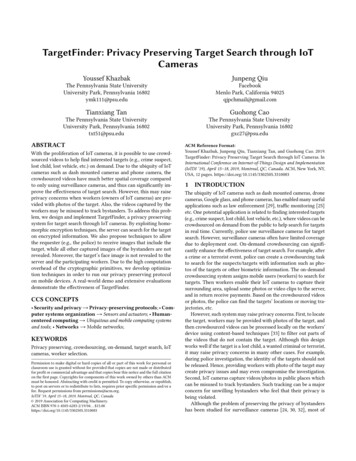
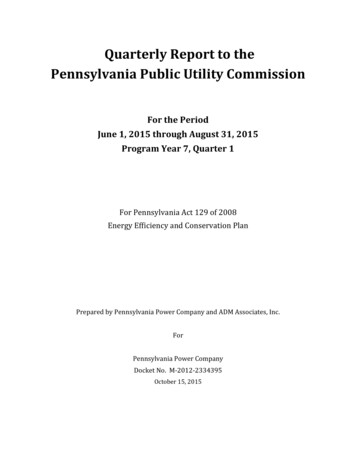
October 15, 2015 Quarterly Report to the PA PUC – Program Year 6 Quarter 11.1 Summary of AchievementsPenn Power has achieved 96.2 percent of the May 31, 2016 energy savings compliance target, based oncumulative program inception to date (Phase II) reported gross energy savings1, and 119.8 percent of theenergy savings compliance target, based on Phase II-Q-CO2 (or Phase II-CO until verified savings areavailable for PY6) gross energy savings achieved through PY7Q1, as shown in Figure 1-1. (Phase II-Q)3 isalso shown in Figure 1-1.Figure 1-1: Cumulative Portfolio Phase 2 Inception to Date (Phase II) Energy Impacts140,000Energy Savings (MWh)120,000119.8%121.9%95,502 MWh/Yr100,00080,00096.2%98.2%Phase I Carryover60,000Phase II40,00020,000Phase II-COPhase II-Q-CO May 31 2016ComplianceTarget1 Phase II Reported Gross Savings Phase II Reported Gross Savings from the beginning of Phase II through the endof the current quarter. All savings reported as Phase II reported gross savings are computed this way.Phase II-Q-CO Gross Savings Phase II verified gross savings from the beginning of Phase II including verified CarryOver Savings from Phase I PYTD reported gross savings. The carryover portion of the Phase II-Q-CO Gross Savingslisted herein is based on verified impacts reported in the Company’s Final Phase I report to the Commission.2Phase II-Q Gross Savings CPITD Verified Gross Savings from the beginning of Phase II PYTD Reported GrossSavings. This excludes Phase I carry over savings. All savings reported as Phase II-Q gross savings are computed thisway. Phase II Verified Gross Savings will be reported in the annual report. For the first quarter of each program year,the Company reports Phase II-Q Gross Savings as Phase II Savings as verified savings will not be reported untilNovember 15.3Pennsylvania Power Company Page 5
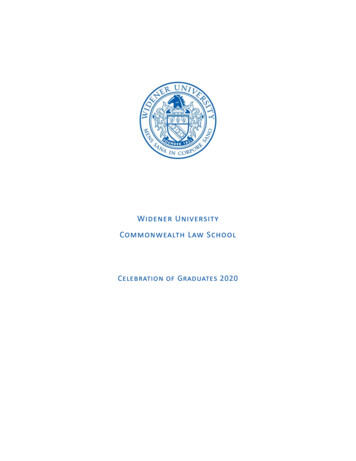
October 15, 2015 Quarterly Report to the PA PUC – Program Year 6 Quarter 1Penn Power has achieved 10.2 MW of demand reduction through PY7Q14.Figure 1-2: Phase II Portfolio Demand Reduction12.00Demand Reduction (MW)10.009.6 MW10.2 MW8.006.004.002.00Phase IIPhase II-QThere are six broad groups of measures available to the low-income sector at no cost to the customer,compared to a total of 40 broad measure categories included in the Company’s EE&C Plan. These groupsof measures offered to the low-income sector therefore comprise 15.0% of the total measures offered.As required by the Phase II goal, this exceeds the fraction of the electric consumption of the utility’s lowincome households divided by the total electricity consumption in the Penn Power territory which is10.6%.5 The Phase II reported gross energy savings achieved in the low-income sector is 11,049 MWh/yr6;this is 12.0% percent of the Phase II total portfolio reported gross energy savings. This exceeds the goal of4.5% of the Phase II savings.Penn Power has also achieved 124.4% of the May 31, 2016, energy reduction compliance target forgovernment, nonprofit and institutional sector, based on Phase II reported gross energy savings, and4There is no compliance target for demand reduction in Phase II.Act 129 includes a provision requiring electric distribution companies to offer a number of energy efficiencymeasures to low-income households that are “proportionate to those households’ share of the total energy usagein the service territory.” 66 Pa.C.S. §2806.1(b)(i)(G). The Company’s Act 129 EE&C Plan includes hundreds of distinctmeasures that are consolidated into 128 archetypal measures and 40 broad measure categories. For low-Incomereporting purposes, six of these 40 broad measure categories are offered at no cost to the Company’s low-incomeresidential customers.5These estimates are extrapolated from official PY5 verified results, which were calculated through participantsurveys.6Pennsylvania Power Company Page 6
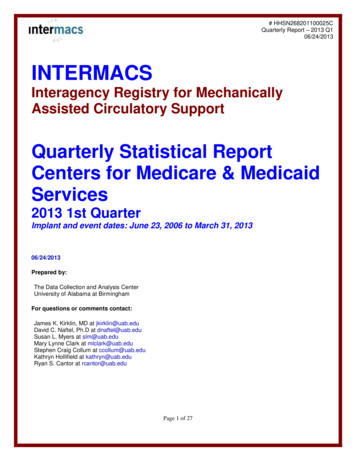
October 15, 2015 Quarterly Report to the PA PUC – Program Year 6 Quarter 1127.1% of the target based on Phase II-Q-CO (or Phase II-CO until verified savings are available for PY6)gross energy savings achieved through PY7Q1, as shown in Figure 1-3.Figure 1-3: Government, Nonprofit, and Institutional Sectors140%127.1%128.7%Energy Savings (MWh)120%100%9,550 MWh/Yr100%80%124.4%126.0%Phase I Carryover60%Phase II40%20%0%Phase II-COPhase II-Q-CO May 31 2016ComplianceTarget1.2 Program Updates and Findings Appliance Turn-in:565 appliances were picked up and recycled during P76Q1. Retail store visits were conductedduring this period at Sears Department Stores across the territory to educated employees aboutthe benefits of this program. During this period, the Company continued to market the programthrough bill inserts, television, radio, newspaper, and internet advertisements. Energy Efficient Products:Program continues to track ahead of goal in all four FirstEnergy PA EDCs primarily due to POSlighting sales and the consumer electronics program. Home Performance:New Construction: During the quarter, 62 homes were completed under the program. Programparticipation in Penn Power remains steady.Online Audit: Penn Power continues to send Energy Conservation Kits to customers as a resultof completing an Online Audit. During PY7Q1, over 130 kits were delivered to Penn Powercustomers.Comprehensive Audit: The program continues to recruit new contractors into program andmarket program to customers. The program continues to host bi-monthly program webinars withcontractors to go over best practices and program updates.Pennsylvania Power Company Page 7
October 15, 2015 Quarterly Report to the PA PUC – Program Year 6 Quarter 1Behavior Modification: Approximately 35,000 customers across Penn Power’s service territoryreceive Home Energy Reports. These reports show a customer’s energy usage, highlight PA Act129 approved programs, and provide tips to help save energy.Opt-in Kits: During PY7Q1, over 1,100 Opt-In Kits were delivered to customers in Penn Power uponenrollment into the program.Schools Education and Kits: This program concluded in late 2014 and has no activity updates.Final performances of the “Energized Guyz” for Phase II were completed in November 2014 andrequested kits were shipped through January. Over 3,440 students participated in the SchoolEducation program during Phase II of Act 129. Low Income / WARM:The Program continued its marketing efforts to identify and reach income-qualified customers inthe Penn Power territory during PY7Q1. A 30-second WARM TV commercial was made availableon the FE Home Page YouTube link. Also, a Request for Proposal (RFP) for Quality AssuranceInspectors for the WARM, WARM Plus/Multi Family and Act 129 Programs was prepared andissued on August 31, 2015. Interested vendors have until September 3, 2015 to submit theirIntent to Bid responses.WARM Extra Measures/WARM Plus: Procedures for coordination with Peoples Gas and theWARM Program have been finalized and all aspects of joint delivery are underway.Multi Family: Penn Power continues to identify and serve Multi-Family units/customers forWARM Plus. C/I Small Energy Efficient Equipment:The ICSP initiated planning of four (4) outreach events this quarter that will be held across thePenn Power region in September and October, 2015. The main focus of these events:a. Increase participating in this program;b. Motivate customers and program allies to move forward with their projects as thePhase II Programs will end effective May 2016;c. To provide a broad overview of Phase III.Penn Power continues to receive and process applications under Phase II for this program. TheICSP continues with its past strategy to conduct outreach campaign through program allynetwork, direct marketing and one-on-one outreach by the program staff. C/I Small Energy Efficient Buildings:The ICSP initiated planning of four (4) outreach events this quarter that will be held across thePenn Power region in September and October, 2015. The main focus of these events –a. Increase participating in this program;Pennsylvania Power Company Page 8
October 15, 2015 Quarterly Report to the PA PUC – Program Year 6 Quarter 1b. Motivate customers and program allies to move forward with their projects as thePhase II Programs will end effective May 2016;c. To provide a broad overview of Phase III.The ICSP continues with its outreach and marketing efforts that are focused on direct marketingto building owners/operators, design/build contractors, and engineering and architectural firmsby promoting the Building Program Guidelines document plus number of marketing pieces thatare targeted at professionals and decision makers in this market segment. Based on the year-todate results, the ICSP has revised its 60-Day outlook marketing plan to build a momentum in thisprogram. An uptick in new project applications coming through this program are also a result ofoutreach to upstream program allies. No kits were shipped to customers this quarter. C/I Large Energy Efficient Equipment:The ICSP initiated planning of four (4) outreach events this quarter that will be held across thePenn Power region in September and October, 2015. The main focus of these events:a. Increase participating in this program;b. Motivate customers and program allies to move forward with their projects as thePhase II Programs will end effective May 2016;c. To provide a broad overview of Phase III.Penn Power continues to receive and process applications under Phase II. The ICSP marketsthis program through trade ally network and one-on-one outreach by the program staff. C/I Large Energy Efficient Buildings:The ICSP initiated planning of four (4) outreach events this quarter that will be held across thePenn Power region in September and October, 2015. The main focus of these events:a. Increase participating in this program;b. Motivate customers and program allies to move forward with their projects as thePhase II Programs will end effective May 2016;c. To provide a broad overview of Phase III.The ICSP continues with its outreach and marketing efforts that are focused on directmarketing to building owners/operators, design/build contractors, and engineering andarchitectural firms by promoting the Building Program Guidelines document plus number ofmarketing pieces that are targeted at professionals and decision makers in this marketsegment. Based on the year-to-date results, the ICSP has revised its 60-Day outlook marketingplan to build a momentum in this program. An uptick in new project applications comingthrough this program are also a result of outreach to upstream program allies. No kits wereshipped to customers this quarter.Pennsylvania Power Company Page 9
October 15, 2015 Quarterly Report to the PA PUC – Program Year 6 Quarter 1 Government & Institutional:The ICSP initiated planning of four (4) outreach events this quarter that will be held across thePenn Power region in September and October, 2015. The main focus of these events:a. Increase participating in this program;b. Motivate customers and program allies to move forward with their projects as thePhase II Programs will end effective May 2016;c. To provide a broad overview of Phase III.ICSP is promoting these outreach events via the Program website, e-Blast, trade ally newsletterand EnergyLine newsletter. The Company is also using its Customer Support Account Mangersand Area Managers to promote these events to assigned accounts & GNI customers. The ICSPcontinues to market the program through traditional marketing channels plus a direct one-onone outreach by the program staff.Pennsylvania Power Company Page 10
October 15, 2015 Quarterly Report to the PA PUC – Program Year 6 Quarter 11.3 Evaluation Updates and Findings Appliance Turn-inEnergy Efficient ProductsHome PerformanceLow Income / WARMC/I Small Energy Efficient EquipmentC/I Small Energy Efficient BuildingsC/I Large Energy Efficient EquipmentC/I Large Energy Efficient BuildingsGovernment & InstitutionalADM has communicated to the Company’s implementation staff the data collectionrequirements and calculation procedures outlined in the 2015 PA TRM for measures offeredunder each program. Nonresidential lighting projects with ex ante savings above 800 MWh andother nonresidential projects with ex ante savings above 400 MWh are sampled with certaintyand evaluated on an ongoing basis by ADM. Nonresidential lighting projects with ex antesavings above 500 MWh and other nonresidential projects with ex ante savings above 250 MWhare reviewed for evaluability on an ongoing basis by ADM, and data acquisition requirements forthese projects are communicated to the ICSP.Pennsylvania Power Company Page 11
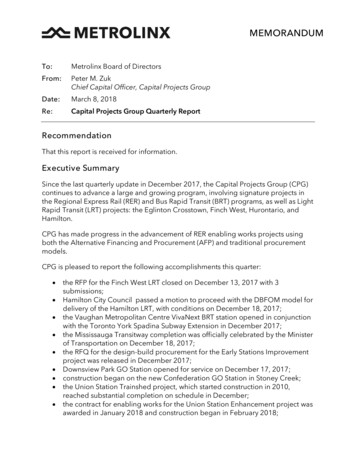
October 15, 2015 Quarterly Report to the PA PUC – Program Year 6 Quarter 12 Summary of Energy Impacts by ProgramA summary of the reported energy savings by program is presented in Figure 2-1 and Figure 2-2.Figure 2-1: Phase II Reported Gross Energy Savings by ProgramEnergy Savings (MWh)30,00025,00020,00015,00010,0005,0000Figure 2-2: Phase II-Q Reported Gross Energy Savings by ProgramEnergy Savings nia Power Company Page 12
October 15, 2015 Quarterly Report to the PA PUC – Program Year 6 Quarter 1A summary of energy impacts by program through PY7Q1 is presented in Table 2-1.Table 2-1: EDC Reported Participation and Gross Energy Savings by Program (MWh/Year)Reported Gross ImpactParticipantsProgramAppliance Turn-InIQPYTD(MWh/Year)Phase IIIQPYTDPhase 7419,32919,866Home Performance79679670,9951,9671,96724,24725,464Low Income / WARM1981987,77990902,3142,305C/I Small Energy EfficientEquipment31312511,4761,47613,62213,646C/I Small Energy EfficientBuildings41411,90129293,1212,715C/I Large Energy EfficientEquipment223225825823,05023,196C/I Large Energy t, 7891,83793,826Energy Efficient ProductsTOTAL PORTFOLIOCarry Over Savings fromPhase I822,580116,406Total Phase II-Q-CO7Phase IIQ7Phase II cumulative savings reflect PY5 verified savings and reported savings for PY6 and PY7.The Phase I carryover values as listed in this quarterly report are based on verified impacts reported in theCompany’s Final Phase I report to the Commission all remaining values for all periods are shown ex-ante.8Pennsylvania Power Company Page 13
October 15, 2015 Quarterly Report to the PA PUC – Program Year 6 Quarter 13 Summary of Demand Impacts by ProgramA summary of the reported demand reduction by program is presented in Figure 3-1 and Figure 3-2.Figure 3-1: Phase II Demand Reduction by ProgramDemand Reduction (MW)3.002.502.001.501.000.500.00Figure 3-2: Phase II-Q Demand Reduction by ProgramDemand Reduction (MW)3.002.502.001.501.000.500.00Pennsylvania Power Company Page 14
October 15, 2015 Quarterly Report to the PA PUC – Program Year 6 Quarter 1A summary of total demand reduction impacts by program through PY7Q1 is presented in Table 3-1.Table 3-1: Participation and Reported Gross Demand Reduction by ProgramReported Gross ImpactParticipantsProgramAppliance Turn-InEnergy Efficient ProductsPYTD5655,703Phase II565IQPYTDPhase IIPhase IIQ94,0770.080.080.450.505,703 166,4380.080.081.561.83Home Performance79679670,9950.990.992.092.25Low Income / WARM1981987,7790.010.010.180.18C/I Small Energy EfficientEquipment31312510.170.171.721.81C/I Small Energy EfficientBuildings41411,9010.010.010.500.43C/I Large Energy EfficientEquipment22320.020.022.672.77C/I Large Energy EfficientBuildings1190.330.330.340.34Government, & Institutional0020.000.000.040.047,337 251,4841.681.689.5610.16TOTAL PORTFOLIO9IQ(MW)7,337Phase II cumulative demand impacts reflect PY5 verified savings and reported savings for PY6 and PY7.Pennsylvania Power Company Page 15
October 15, 2015 Quarterly Report to the PA PUC – Program Year 6 Quarter 14 Summary of Finances4.1 Portfolio Level ExpendituresA breakdown of the portfolio finances is presented in Table 4-1.Table 4-1: Summary of Portfolio FinancesEDC Incentives to ParticipantsEDC Incentives to Trade AlliesSubtotal EDC Incentive CostsDesign & DevelopmentAdministration, Management andTechnical Assistance[1]MarketingSubtotal EDC Implementation CostsEDC Evaluation CostsSWE Audit CostsTotal EDC Costs[2]Quarter 1( 000)PYTD( 000)Phase II( 000) 458 458 5,125 0 0 0 458 458 5,125 12 12 51 456 456 5,695 50 50 557 518 518 6,303 77 77 381 42 42 668 1,095 1,095 12,477Participant Costs[3]Total TRC Costs[4]NOTESPer PUC direction, TRC inputs and calculations are required in the Annual Report only and should comply with the 2013 Total Resource Cost TestOrder approved August 30, 2012.Costs shown above include startup expenses prior to June 1, 2013.Negative values are the result of prior period adjustments in the current quarter and are reflected throughout the program level tables.1 Includes the administrative ICSP (rebate processing), tracking system, general administration and clerical costs, EDC program management,ICSP program management, general management oversight major accounts and technical assistance2 Per the 2013 Total Resource Cost Test Order – Total EDC Costs, here, refer to EDC incurred expenses only. Total EDC Costs Subtotal EDCIncentive Costs Subtotal EDC Implementation Costs EDC Evaluation Costs SWE Audit Costs.3 Per the 2013 Total Resource Cost Test Order –Net participant costs; in PA, the costs of the end-use customer.4 Total TRC Costs Total EDC Costs Participant CostsPennsylvania Power Company Page 16
October 15, 2015 Quarterly Report to the PA PUC – Program Year 6 Quarter 14.2 Program Level ExpendituresProgram-specific finances are shown in the following tables.Table 4-2: Summary of Program Finances – Res Appliance Turn-InEDC Incentives to ParticipantsEDC Incentives to Trade AlliesSubtotal EDC Incentive CostsDesign & DevelopmentAdministration, Management andTechnical Assistance[1]MarketingSubtotal EDC Implementation CostsEDC Evaluation CostsSWE Audit CostsTotal EDC Costs[2]Quarter 1( 1,000)PYTD( 1,000)Phase II( 1,000) 29 29 247 0 0 0 29 29 247 1 1 4 49 49 385 14 14 106 64 64 495 3 3 12 3 3 54 100 100 808Participant Costs[3]Total TRC Costs[4]NOTESPer PUC direction, TRC inputs and calculations are required in the Annual Report only and should comply with the 2013 Total Resource Cost TestOrder approved August 30, 2012.Costs shown above include startup expenses prior to June 1, 2013.1Includes the administrative ICSP (rebate processing), tracking system, general administration and clerical costs, EDC program management,ICSP program management, general management oversight major accounts and technical assistance2 Per the 2013 Total Resource Cost Test Order – Total EDC Costs, here, refer to EDC incurred expenses only. Total EDC Costs Subtotal EDCIncentive Costs Subtotal EDC Implementation Costs EDC Evaluation Costs SWE Audit Costs.3 Per the 2013 Total Resource Cost Test Order –Net participant costs; in PA, the costs of the end-use customer.4Total TRC Costs Total EDC Costs Participant CostsPennsylvania Power Company Page 17
October 15, 2015 Quarterly Report to the PA PUC – Program Year 6 Quarter 1Table 4-3: Summary of Program Finances – Res Energy Efficient ProductsEDC Incentives to ParticipantsEDC Incentives to Trade AlliesSubtotal EDC Incentive CostsDesign & DevelopmentAdministration, Management andTechnical Assistance[1]MarketingSubtotal EDC Implementation CostsEDC Evaluation CostsSWE Audit CostsTotal EDC Costs[2]Quarter 1( 1,000)PYTD( 1,000)Phase II( 1,000) 79 79 1,047 0 0 0 79 79 1,047 1 1 4 5 5 674 0 0 42 6 6 721 11 11 52 3 3 52 100 100 1,870Participant Costs[3]Total TRC Costs[4]NOTESPer PUC direction, TRC inputs and calculations are required in the Annual Report only and should comply with the 2013 Total Resource Cost TestOrder approved August 30, 2012.Costs shown above include startup expenses prior to June 1, 2013.1Includes the administrative ICSP (rebate processing), tracking system, general administration and clerical costs, EDC program management,ICSP program management, general management oversight major accounts and technical assistance2Per the 2013 Total Resource Cost Test Order – Total EDC Costs, here, refer to EDC incurred expenses only. Total EDC Costs Subtotal EDCIncentive Costs Subtotal EDC Implementation Costs EDC Evaluation Costs SWE Audit Costs.3Per the 2013 Total Resource Cost Test Order –Net participant costs; in PA, the costs of the end-use customer.4 Total TRC Costs Total EDC Costs Participant CostsPennsylvania Power Company Page 18
October 15, 2015 Quarterly Report to the PA PUC – Program Year 6 Quarter 1Table 4-4: Summary of Program Finances – Res Home PerformanceEDC Incentives to ParticipantsEDC Incentives to Trade AlliesSubtotal EDC Incentive CostsDesign & DevelopmentAdministration, Management andTechnical Assistance[1]MarketingSubtotal EDC Implementation CostsEDC Evaluation CostsSWE Audit CostsTotal EDC Costs[2]Quarter 1( 1,000)PYTD( 1,000)Phase II( 1,000) 109 109 1,945 0 0 0 109 109 1,945 3 3 13 96 96 1,877 13 13 220 112 112 2,110 10 10 39 11 11 170 242 242 4,264Participant Costs[3]Total TRC Costs[4]NOTESPer PUC direction, TRC inputs and calculations are required in the Annual Report only and should comply with the 2013 Total Resource Cost TestOrder approved August 30, 2012.Costs shown above include startup expenses prior to June 1, 2013.1Includes the administrative ICSP (rebate processing), tracking system, general administration and clerical costs, EDC program management,ICSP program management, general management oversight major accounts and technical assistance2Per the 2013 Total Resource Cost Test Order – Total EDC Costs, here, refer to EDC incurred expenses only. Total EDC Costs Subtotal EDCIncentive Costs Subtotal EDC Implementation Costs EDC Evaluation Costs SWE Audit Costs.3Per the 2013 Total Resource Cost Test Order –Net participant costs; in PA, the costs of the end-use customer.4 Total TRC Costs Total EDC Costs Participant CostsPennsylvania Power Company Page 19
October 15, 2015 Quarterly Report to the PA PUC – Program Year 6 Quarter 1Table 4-5: Summary of Program Finances – Res Low IncomeEDC Incentives to ParticipantsEDC Incentives to Trade AlliesSubtotal EDC Incentive CostsDesign & DevelopmentAdministration, Management andTechnical Assistance[1]MarketingSubtotal EDC Implementation CostsEDC Evaluation CostsSWE Audit CostsTotal EDC Costs[2]Quarter 1( 1,000)PYTD( 1,000)Phase II( 1,000) 0 0 0 0 0 0 0 0 0 4 4 17 133 133 1,163 0 0 2 138 138 1,182 9 9 74 14 14 221 160 160 1,476Participant Costs[3]Total TRC Costs[4]NOTESPer PUC direction, TRC inputs and calculations are required in the Annual Report only and should comply with the 2013 Total Resource Cost TestOrder approved August 30, 2012.Costs shown above include startup expenses prior to June 1, 2013.1Includes the administrative ICSP (rebate processing), tracking system, general administration and clerical costs, EDC program management,ICSP program management, general management oversight major accounts and technical assistance2Per the 2013 Total Resource Cost Test Order – Total EDC Costs, here, refer to EDC incurred expenses only. Total EDC Costs Subtotal EDCIncentive Costs Subtotal EDC Implementation Costs EDC Evaluation Costs SWE Audit Costs.3Per the 2013 Total Resource Cost Test Order –Net participant costs; in PA, the costs of the end-use customer.4 Total TRC Costs Total EDC Costs Participant Costs5 Negative values represent accounting adjustments from prior periods.Pennsylvania Power Company Page 20
October 15, 2015 Quarterly Report to the PA PUC – Program Year 6 Quarter 1Table 4-6: Summary of Program Finances – Small CI Efficient EquipmentEDC Incentives to ParticipantsEDC Incentives to Trade AlliesSubtotal EDC Incentive CostsDesign & DevelopmentAdministration, Management andTechnical Assistance[1]MarketingSubtotal EDC Implementation CostsEDC Evaluation CostsSWE Audit CostsTotal EDC Costs[2]Quarter 1( 1,000)PYTD( 1,000)Phase II( 1,000) 93 93 633 0 0 0 93 93 633 2 2 7 84 84 783 12 12 87 97 97 877 15 15 68 6 6 89 211 211 1,667Participant Costs[3]Total TRC Costs[4]NOTESPer PUC direction, TRC inputs and calculations are required in the Annual Report only and should comply with the 2013 Total Resource Cost TestOrder approved August 30, 2012.Costs shown above include s
through 2013). In 2009, each EDC submitted energy efficiency and conservation (EE&C) plans—which were approved by the Pennsylvania Public Utility Commission (PUC)—pursuant to these goals. The PUC established energy savings and demand reduction goals for Phase II (June 2013 through May 2016) of the Act 129 programs.