Transcription
ArticleClimatic Impacts of Wind PowerLee M. Miller, David W. Keithlmiller@seas.harvard.edu (L.M.M.)david keith@harvard.edu (D.W.K.)HIGHLIGHTSWind power reduces emissionswhile causing climatic impactssuch as warmer temperaturesWarming effect strongest at nightwhen temperatures increase withheightNighttime warming effectobserved at 28 operational USwind farmsWind’s warming can exceedavoided warming from reducedemissions for a centuryWind beats fossil, but wind power does cause non-negligible climatic impacts. Thisstudy advances work on wind power’s climate impacts by: (1) providing amechanistic explanation for wind turbines’ climate impacts by comparingnumerical simulations with observations, (2) filling a current gap between smalland very-large-scale wind power simulation studies, (3) making the firstquantitative comparison between wind power’s climatic impacts and benefits, and(4) using the same framework to make a quantitative comparison with solar power.Miller & Keith, Joule 2, 1–15December 19, 2018 ª 2018 Elsevier Inc.https://doi.org/10.1016/j.joule.2018.09.009
Please cite this article in press as: Miller and Keith, Climatic Impacts of Wind Power, Joule (2018), Climatic Impacts of Wind PowerLee M. Miller1,3,* and David W. Keith1,2,*SUMMARYContext & ScaleWe find that generating today’s US electricity demand (0.5 TWe) with wind power would warm Continental US surface temperatures by 0.24 C. Warmingarises, in part, from turbines redistributing heat by mixing the boundary layer.Modeled diurnal and seasonal temperature differences are roughly consistentwith recent observations of warming at wind farms, reflecting a coherent mechanistic understanding for how wind turbines alter climate. The warming effectis: small compared with projections of 21st century warming, approximatelyequivalent to the reduced warming achieved by decarbonizing global electricitygeneration, and large compared with the reduced warming achieved by decarbonizing US electricity with wind. For the same generation rate, the climaticimpacts from solar photovoltaic systems are about ten times smaller thanwind systems. Wind’s overall environmental impacts are surely less than fossilenergy. Yet, as the energy system is decarbonized, decisions between windand solar should be informed by estimates of their climate impacts.Wind power can impact theclimate by altering theatmospheric boundary layer, withat least 40 papers and 10observational studies now linkingwind power to climatic impacts.We make the first comparisonbetween the climatic impacts oflarge-scale wind power and sitescale observations, findingagreement that warming fromwind turbines is largest at night.Wind power’s climatic impacts willcontinue to expand as more areinstalled.INTRODUCTIONTo extract energy, all renewables must alter natural energy fluxes, so climate impactsare unavoidable, but the magnitude and character of climate impact varies widely.Wind turbines generate electricity by extracting kinetic energy, which slows windsand modifies the exchange of heat, moisture, and momentum between thesurface and the atmosphere. Observations show that wind turbines alter localclimate,1–10 and models show local- to global-scale climate changes from thelarge-scale extraction of wind power.11–15 Previous studies have assessed climateimpacts of hydropower,16 biofuels,17 and solar photovoltaic systems (PVs).18 Rapidexpansion of renewable energy generation is a cornerstone of efforts to limit climatechange by decarbonizing the world’s energy system. In addition to climate benefits,wind and solar power also reduce emissions of criteria pollutants (NOx, SOx, andPM2.5) and toxic pollutants such as mercury that cause significant public healthimpacts.19,20 The climate impacts of wind and solar are small compared with theimpacts of the fossil fuels they displace, but they are not necessarily negligible.Improved understanding of the environmental trade-offs between renewableswould inform choices between low-carbon energy sources. With growth of windand solar PVs far outstripping other renewables,21 we combine direct observationsof onshore wind power’s impacts with a continental-scale model, and compare it toprior estimates of PVs’ impacts to assess the relative climate impacts of wind andsolar energy per unit energy generation.Do these impacts matter? How dothese impacts compare to theclimate benefits of reducingemissions? We offer policyrelevant comparisons: wind’sclimatic impacts are about 10times larger than solarphotovoltaic systems per unitenergy generated. We explorethe temporal trade-off betweenwind’s climatic impacts and theclimate benefits it brings byreducing emissions as it displacesfossil fuels. Quantitativecomparisons between low-carbonenergy sources should informenergy choices in the transition toa carbon-free energy system.Climatic impacts due to wind power extraction were first studied using generalcirculation models (GCMs). These studies found statistically significant climaticimpacts within the wind farm, as well as long-distance teleconnections, with impactsoutside the wind farm sometimes as large in magnitude as impacts inside the windfarm.11–13,22 Note that such impacts are unlike greenhouse gas (GHG)-driven warming, as in some cases wind power’s climatic impacts might counteract such GHGJoule 2, 1–15, December 19, 2018 ª 2018 Elsevier Inc.1
Please cite this article in press as: Miller and Keith, Climatic Impacts of Wind Power, Joule (2018), —at least four studies have found that mid-latitude wind power extractioncan cool the Arctic.11,12,23,24 However, these studies often used idealized or unrealistic distributions of turbines installed at unrealistic scales. Model simulations ofgeometrically simple, isolated wind farms at smaller scales of 3,000–300,000 km2(10- to 1,000 times larger than today’s wind farms) in windy locations foundsubstantial reductions in wind speed and changes in atmospheric boundary layer(ABL) thickness, as well as differences in temperature,11,13,14,24 precipitation,14,25and vertical atmospheric exchange.15,26We want to assess wind power’s climate impacts per unit of energy generation, yetwind’s climatic impacts depend on local meteorology and on non-local climateteleconnections. These twin dependencies mean that wind power’s impacts arestrongly dependent on the amount and location of wind power extraction, frustrating the development of a simple impact metric.As a step toward an improved policy-relevant understanding, we explore theclimatic impacts of generating 0.46 TWe of wind-derived electricity over the Continental US. This scale fills a gap between the smaller isolated wind farms and globalscale GCM. We model a uniform turbine density within the windiest one-third ofthe Continental US, and vary the density parametrically.Our 0.46 TWe benchmark scenario is 18 times the 2016 US wind power generationrate.21 We intend it as a plausible scale of wind power generation if wind power playsa major role in decarbonizing the energy system in the latter half of this century. Forperspective, the benchmark’s electricity generation rate is only 14% of current USprimary energy consumption,25 about the same as US electricity consumption,27and about 2.4 times larger than the projected 2050 US wind power generationrate of the Central Study in the Department of Energy’s (DOE) recent Wind Vision.28Finally, it is less than one-sixth the technical wind power potential over about thesame windy areas of the US as estimated by the DOE.28,29Modeling FrameworkWe use the WRF v3.3.1 high-resolution regional model30 with a domain that encompasses the Continental US, forced by boundary conditions from the North AmericanRegional Reanalysis.31 The wind farm region is more than 500 km from the modelboundaries, and encompasses only 13% of the domain (shown in Figure 1A).The model configuration used dynamic soil moisture and 31 vertical levels with3 levels intersecting the turbine’s rotor and 8 levels representing the lowermost kilometer. The model is run for a full year after a 1-month spin-up using horizontal resolutions of 10 and 30 km. The wind turbine parametrization was originally releasedwith WRF v3.3,32 and represents wind turbines as both a momentum sink and turbulent kinetic energy (TKE) source. We updated the wind turbine parameterization tomake use of the thrust, power, and TKE coefficients from a Vestas V112 3 MW.This treatment of wind power is very similar to previous modeling studies.14,15,24The advantage of the regional model is that we can use a horizontal and vertical resolution substantially higher than previous global modeling studies,11–13,22,23,26,33,34allowing better representation of the interactions of the wind turbines with the ABL.The disadvantage of using prescribed boundary conditions is that our simulationswill underestimate the global-scale climatic response to wind power extractioncompared with a global model with equivalent resolution, which would allow theglobal atmosphere to react to the increased surface drag over the US and wouldreveal climate teleconnections.2Joule 2, 1–15, December 19, 20181Schoolof Engineering and Applied Sciences,Harvard University, Cambridge, MA 02139, USA2HarvardKennedy School, Cambridge, MA02138, d.edu (L.M.M.),david keith@harvard.edu 9
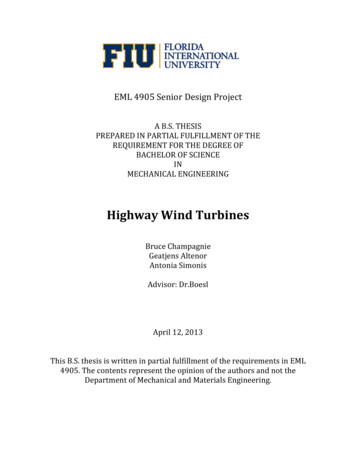
Please cite this article in press as: Miller and Keith, Climatic Impacts of Wind Power, Joule (2018), https://doi.org/10.1016/j.joule.2018.09.009Figure 1. Temperature Response to Benchmark Wind Power Deployment (0.5 MW km 2)(A–C) Maps are 3-year mean of perturbed minus 3-year mean of control for 2-m air temperatures, showing (A) entire period, (B) daytime, and (C)nighttime. The wind farm region is outlined in black, and, for reference, presently operational wind farms are shown as open circles in (A).We tested horizontal resolution dependence by comparing the 10- and 30-kmsimulations with a turbine density of 3.0 MW km 2 with the respective 2012 controls.Differences in the annual average 2-m air temperature were small, as shown inFigure S1. The following results use a 30-km resolution (about one-ninth of thecomputational expense) and 2012, 2013, and 2014 simulation periods to reducethe influence of interannual variability. We use four turbine densities (0.5, 1.0, 1.5,and 3.0 MW km 2) within the wind farm region to explore how increased wind powerextraction rates alter the climatic impacts.RESULTS AND DISCUSSIONFigure 1 shows the climate impacts of the benchmark scenario (0.5 MW km 2). Thewind farm region experiences warmer average temperatures (Figure 1A), with abouttwice the warming effect at night compared with during the day (Figures 1B and 1C).Warming was generally stronger nearer to the center of the wind farm region, butJoule 2, 1–15, December 19, 20183
Please cite this article in press as: Miller and Keith, Climatic Impacts of Wind Power, Joule (2018), https://doi.org/10.1016/j.joule.2018.09.009perhaps because teleconnections are suppressed by the forced boundary conditions. The climate response is concentrated in the wind farm region, but there areregions well outside the wind farm region also experiencing a climate response.The clearest example here is along the East Coast during the daytime, whereaverage daytime temperatures are 0.1 C–0.5 C cooler (Figure 1B).To separate the local direct boundary layer impacts from the mesoscale climatechanges, we ran a diagnostic simulation with a 250 3 250-km ‘‘hole’’ near the centerof the wind farm region, finding that the ‘‘hole’’ experienced about half the warmingof the original ‘‘no hole’’ benchmark scenario during 2014 (Table S1 and Figure S2).This suggests that about half the warming effect is attributed to localized changes inatmospheric mixing, with the other half attributed to mesoscale changes, but thisrequires further study.Changes in precipitation are small and show no clear spatial correlation (Figure S3).The warming is greatest in an N-S corridor near the center of the wind turbine array,perhaps because of an interaction between wind turbines and the nocturnal lowlevel jet (LLJ). The LLJ is a fast nocturnal low-altitude wind ( 12 m s 1 at 0.5 km) common in the US Midwest, which occurs when the atmosphere decouples from surfacefriction, resulting in a steep vertical temperature gradient35—meteorological conditions that might be sensitive to perturbations by wind turbines. We quantified thepresence of the LLJ in our control simulation but did not find a strong spatialcorrelation between the probability of LLJ occurrence and the nighttime warming(Figure S4). To explore mechanisms, we examine the vertical temperature gradient,atmospheric dissipation, and wind speed (Figure S5), and then explore therelationship between warming and these variables using scatterplots (Figure S6).We find some consistency between the dissipation rate of the control and thewarming effect of wind turbines, but the correlation is weak.Figure 2 explores the relationship between changes in vertical temperaturegradient, atmospheric dissipation, and the simulated warming. Wind turbinesreduce vertical gradients by mixing. During the day, vertical temperature gradientsnear the surface are small due to solar-driven convection and are only slightlyreduced by the turbines. Gradients are larger at night, particularly during summer,and the gradient reduction caused by turbine-induced mixing is larger. The largestwarming occurs when the reduction in gradient is strongest and the proportionalincrease in TKE is largest.Warming and power generation saturate with increasing turbine density (Figure 3).The temperature saturation is sharper, so the ratio of temperature change per unitenergy generation decreases with increasing turbine density. This suggests thatwind’s climate impacts per unit energy generation may be somewhat larger for lowervalues of total wind power production.Power generation appears to approach the wind power generation limit at turbinedensities somewhat above the maximum (3.0 MW km 2) we explored. A capacitydensity of 1.5 MWi km 2 roughly matches that of US wind farms installed in2016,36 and that simulation’s power density of 0.46 We m 2 is very close to the0.50 We m 2 observed for US wind farms during 2016.36 The highest turbine densityyields an areal (surface) power density of 0.70 We m 2, consistent with some previousstudies,15,22,24,26,33 but half the 1.4 We m 2 assumed possible by 2050 from thesame 3.0 MW km 2 turbine density into windy regions by the DOE.28 While wedid not compute a maximum wind power generation rate here, extrapolation of4Joule 2, 1–15, December 19, 2018
Please cite this article in press as: Miller and Keith, Climatic Impacts of Wind Power, Joule (2018), https://doi.org/10.1016/j.joule.2018.09.009Figure 2. Monthly Day-Night Climate Response to the Benchmark Scenario(A and B) Average monthly day and night values over the wind farm region for (A) vertical temperature gradient between the lowest two model levels(0–56 and 56–129 m) for the control and benchmark scenario (0.5 MWi km 2 ), and (B) differences between the benchmark scenario and control in 2-mair temperature (solid blue boxes) and turbulent kinetic energy (TKE) in the lowest model level (transparent boxes). In both, the vertical line extent showsthe standard 1.5,interquartile range, and the box represents the 25th, 50th, and 75th percentiles.Figure 3 suggests that it is about 2 TWe, significantly less than the 3.7 TWe of technical potential estimated by the DOE28,29 over less land area. Clearly, interactions ofwind turbines with climate must be considered in estimates of technical wind powerpotential.InterpretationThe climatic impacts of wind power may be unexpected, as wind turbines only redistribute heat within the atmosphere, and the 1.0 W m 2 of heating resulting fromkinetic energy dissipation in the lower atmosphere is only about 0.6% of the diurnallyaveraged radiative flux. But wind’s climatic impacts are not caused by additionalheating from the increased dissipation of kinetic energy. Impacts arise becauseturbine-atmosphere interactions alter surface-atmosphere fluxes, inducing climaticimpacts that may be much larger than the direct impact of the dissipation alone.As wind turbines extract kinetic energy from the atmospheric flow and slow windspeeds, the vertical gradient in wind speed steepens, and downward entrainmentincreases.15 These interactions increase the mixing between air from above andair near the surface. The strength of these interactions depends on the meteorologyand, in particular, the diurnal cycle of the ABL.During the daytime, solar-driven convection mixes the atmosphere to heights of1–3 km.35Joule 2, 1–15, December 19, 20185
Please cite this article in press as: Miller and Keith, Climatic Impacts of Wind Power, Joule (2018), ure 3. Variation in Mean Response to Changes in Installed Capacity Density(A–D) The shared x axis is the installed electrical generation capacity per unit area. All values areaverages over the wind farm region. (A) Eighty-four-meter hub-height wind speed, (B) capacity6Joule 2, 1–15, December 19, 2018
Please cite this article in press as: Miller and Keith, Climatic Impacts of Wind Power, Joule (2018), https://doi.org/10.1016/j.joule.2018.09.009Figure 3. Continuedfactor, i.e., the ratio of realized electrical output to generation capacity, (C) power output as a sumand per unit area, and (D) difference in 2-m air temperature. For each value, three distinct years ofdata (2012–2014 from left to right) are shown as three boxplots (1.5,interquartile range, with 25th,50th, and 75th percentiles). Colors help group identical installed capacity densities. The 3-yearmean is shown using white points and connecting solid lines. Dashed lines illustrate the expectedresults if climate did not respond to the deployment of wind turbines.Wind turbines operating during the daytime are enveloped within this alreadywell-mixed air, so climatic impacts such as daytime temperature differences aregenerally quite small. At night, radiative cooling results in more stable surfaceconditions, with about 100–300 m of stable air separating the influence of surfacefriction from the winds aloft.35 Wind turbines operating at night, with physicalextents of 100–150 m and an influence height at night reaching 500 m ormore,15 can entrain warmer (potential temperature) air from above down intothe previously stable and cooler (potential temperature) air near the surface,warming surface temperatures. In addition to the direct mixing by the turbinewakes, turbines reduce the wind speed gradient below their rotors and thussharpen the gradient aloft. This sharp gradient may then generate additionalturbulence and vertical mixing.This explanation is broadly consistent with the strong day-night contrast of ourbenchmark scenario (Figures 1B and 1C). Within the wind farm region during theday, most locations experience warmer air temperatures, although 15% oflocations show a daytime cooling effect in July-September. At night during JulySeptember, less than 5% of locations show a cooling effect, and the warming effectat night over all months is much larger than during the daytime. This daytime andnighttime warming effect is also larger with higher turbine densities (Figure S7).Finally, the temperature perturbation in the benchmark scenario shows a strong correlation to differences in TKE within the lowest model level from 0 to 56 m (Figure 2B),with these increases in TKE downwind of turbines previously observed in Iowa4 andoffshore Germany,37 and supporting our explanation that the temperature responseis driven by increased vertical mixing (Figure 2).Observational Evidence of Climatic ImpactsWhile numerous observational studies have linked wind power to reduced windspeeds and increased turbulence in the turbine wakes,1,4,7,38,39 ten studies havequantified the climatic impacts resulting from these changes (Table 1).Three ground-based studies have measured differences in surface temperature1,5,7and evaporation.5 Generally, these ground-based observations show minimalclimatic impacts during the day, but increased temperatures and evaporation ratesat night.Seven satellite-based studies have quantified surface (skin) temperature differences.By either comparing time periods before and after turbine deployment, or bycomparing areas upwind, inside, and downwind of turbines, the spatial extent andintensity of warming for 28 operational wind farms in California,40 Illinois,6 Iowa,2and Texas8–10 has been observed. There is substantial consistency between thesesatellite observations despite the diversity of local meteorology and wind farmdeployment scales. Daytime temperature differences were small and slightly warmerand cooler, while nighttime temperature differences were larger and almost alwayswarmer (Table 1). Interpretation of the satellite data is frustrated by fixed overpasstimes and clouds that sometimes obscure the surface.Joule 2, 1–15, December 19, 20187
Please cite this article in press as: Miller and Keith, Climatic Impacts of Wind Power, Joule (2018), https://doi.org/10.1016/j.joule.2018.09.009Table 1. Overview of Observational Studies Linking Air Temperature Differences to Wind FarmsReferenceSAT or GNDBaidya Roy andTraiteur,1 2010GNDWalsh-Thomaset al.40 2012SATZhou et al.9 2012SATZhou et al.10 2013StateNotes: Climatic Impacts within or Very near to the Operational Wind FarmCAsummer; 1 C increase in 5-m air temperature downwind at night through the earlymorning; slight cooling effect during the dayCA 2 C warmer skin temperatures extending to about 2 km downwind, with visibletemperature differences to 12 km downwind9 yearsTXJJA night 0.72 C, DJF night 0.46 C; JJA day 0.04 C; DJF day 0.23 C;warming is spatially consistent with the arrangement of wind turbinesSAT6 yearsTXQA1 values: DJF night 0.22 C, MAM night 0.29 C, JJA night 0.35 C,SON night 0.40 C, DJF day 0.11 C, MAM day 0.11 C, JJA day 0.17 C,SON day 0.04 CZhou et al.10 2013SAT2 yearsTXQA1 values: DJF night 0.01 C, MAM night 0.42 C, JJA night 0.67 C,SON night 0.47 C, DJF day 0.14 C, MAM day 0.42 C, JJA day 1.52 C,SON day 0.12 CXia et al.8 2016SAT7 yearsTXDJF night 0.26 C, MAM night 0.40 C, JJA night 0.42 C, SONnight 0.27 C, Annual night 0.31 C, DJF day 0.18 C, MAM day JJA day 0.26 C, SON day 0.02 C, Annual day 0.09 CHarris et al.2 2014SAT11 yearsIAMAM night 0.07 C, JJA night 0.17 C, SON night 0.15 CRajewski et al. 2013GND122 daysIAalong the edge of a large wind farm directly downwind of 13 turbines; generallycooler temperatures (0.07 C) with daytime periods that were 0.75 C cooler andnighttime periods that were 1.0–1.5 C warmerRajewski et al.5 2014GND122 daysIAalong the edge of a large wind farm downwind of 13 turbines co-located with cornand soybeans; night-sensible heat flux and CO2 respiration increase 1.5–2 timesand wind speeds decrease by 25%–50%; daytime H2O and CO2 fluxes increase5-fold 3–5 diameters downwindSlawsky et al.6 2015SAT11 yearsILDJF night 0.39 C, MAM night 0.27 C, JJA night 0.18 C, SON 0.26 C;Annual 0.26 CSmith et al.7 2013GND47 daysconfidentialSpring; nighttime warming of 1.9 C downwind of a 300 turbine wind farm4Period53 days–0.25 C,SAT, satellite-based observations; GND, ground-based observations. Note that measurements identified as the same state were completed over the samewind farms.Although our benchmark scenario is very different in scale and turbine placementcompared with operational wind power, it is nevertheless instructive to compareour simulation with observations. We compare results at a single Texas location(100.2 W, 32.3 N) where one of the world’s largest clusters of operational windturbines ( 200 km2, consisting of open space and patchy turbine densities of3.8–4.7 MW km 2)41 has been linked to differences in surface temperature in 3of the observational studies in Table 1. Weighting the observations by the numberof observed-years, the Texas location is 0.01 C warmer during the day and 0.29 Cwarmer at night (data in Table S2). Our benchmark scenario with a uniform turbinedensity of 0.5 MW km 2 at this location is 0.33 C warmer during the day and0.66 C warmer at night. To explore the quantitative correlation between theseasonal and diurnal response, we take the 8 seasonal day and night values asindependent pairs (Table S2), and find that the observations and the simulationsare strongly correlated (Figure 4). This agreement provides strong evidence thatthe physical mechanisms being modified by the deployment of wind turbines arebeing captured by our model. This mechanism could be tested more directly iftemperature observations upwind and downwind of a large turbine array wereavailable at a high temporal resolution ( 3 hr).Limitations of Model FrameworkClimate response is partly related to the choice and placement of wind turbine(s).We modeled a specific 3.0-MW turbine, but future deployment may shift to windturbines with taller hub heights and larger rotor diameters. We also assumed8Joule 2, 1–15, December 19, 2018
Please cite this article in press as: Miller and Keith, Climatic Impacts of Wind Power, Joule (2018), https://doi.org/10.1016/j.joule.2018.09.009Figure 4. Comparison of Observations and Simulations for the Texas Location (Table 1)We compare day and night response over four seasons. Observations are surface (skin)temperature differences. Simulation is differences in 2-m air temperatures between the benchmarkscenario (0.5 MW km 2 ) and control. Note that while correlation over eight points is high, thesimulated response is larger, likely due to the much larger perturbed area and the differencebetween skin and 2 m air temperature.that turbines were evenly spaced over the wind farm region, but real turbinedeployment is patchier, potentially also altering turbine-atmosphere-surfaceinteractions.The model’s boundary conditions are prescribed and do not respond to changescaused by wind turbines. Yet prior work has established that non-local climateresponses to wind power may be significant,12 suggesting that simulating ourbenchmark scenario with a global model (no boundary conditions restoring resultsto climatology) would allow possible climatic impacts outside the US to beassessed. Removal of the boundary conditions might also increase the warmingin the wind farm region. The 3-year simulation period was also completed in1-year blocks, so we do not simulate the response of longer-term climate dynamicsinfluenced by variables such as soil moisture. Finally, model resolution influencedthe estimated climatic impacts. Simulations with a 10-km horizontal resolution andthe highest turbine density of 3.0 MW km 2 caused 18% less warming than the30-km simulation ( 0.80 C and 0.98 C). Simulations using a global model withan unequally spaced grid with high-resolution over the US could resolve someof these uncertainties.Comparing Climatic Impacts to Climatic BenefitsEnvironmental impacts of energy technologies are often compared per unit energyproduction.42 Because a central benefit of low-carbon energies like wind and solaris reduced climate change, dimensionless climate-to-climatic comparisons betweenthe climate impacts and climate benefits of reduced emissions are relevant forpublic policy.Climate impacts will, of course, depend on a range of climate variables that wouldneed to be examined in a comprehensive impact assessment. In this analysis wenevertheless use 2-m air temperature as a single metric of climate change given(1) that there are important direct impacts of temperature, (2) that temperatureJoule 2, 1–15, December 19, 20189
Please cite this article in press as: Miller and Keith, Climatic Impacts of Wind Power, Joule (2018), https://doi.org/10.1016/j.joule.2018.09.009change is strongly correlated with other important climate variables, and (3) that useof temperature as a proxy for other impacts is commonplace in climate impactsassessments. Limitations and caveats of our analysis are addressed in the followingsub-section.When wind (or solar) power replace fossil energy, they cut CO2 emissions, reducingGHG-driven global climate change, while at the same time causing climatic impactsas described above and elsewhere.1–15,22–26,34,40,43–45 The climatic impacts differ in(at least) two important dimensions. First, the direct climatic impact of wind power isimmediate but would disappear if the turbines were removed, while the climaticbenefits of reducing emissions grows with the cumulative reduction in emissionsand persists for millennia. Second, the direct climatic impacts of wind power are predominantly local to the wind farm region, while the benefits of reduced emissions areglobal. We revisit and elaborate these differences in a systematic list of caveats atthe end of this subsection.As a step toward a climate-impact to climate-benefit comparison for wind, wecompare warming over the US. We begin by assuming that US wind power generation increases linearly from the current level to 0.46 TWe in 2080 and isconstant thereafter. We estimate the associated warming by scaling our benchmarkscenario’s temperature differences linearly with wind power generation. Theamount of avoided emissions—and thus the climate benefit—depends on theemissions intensity of the electricity that wind displaces. We bracket uncertaintiesin the time evolution of the carbon-intensity of US electric power generation inthe absence of wind power by using two pathways. One pathway assumes a staticemissions intensity at the 2016 value (0.44 kgCO2 kWh 1), while the second pathway’s emissions inten
Wind power can impact the climate by altering the atmospheric boundary layer, with at least 40 papers and 10 observational studies now linking wind power to climatic impacts. We make the first comparison between the climatic impacts of large-scale wind power and site-scale observations, finding agreemen