Transcription
EC3008//p:htty/t.lbiFUNnN2ble EnaElseisaevSOLAR ELECTRICINVESTMENT ANALYSISF. John Hay
SOLAR ELECTRIC INVESTMENT ANALYSISBy: F. John HayAdapted from Solar Electric Investment Analysis 2016 B-1291.1 by Milton Geiger, Eric Romich, and Benjamin S. Rashford made available under aCreative Commons Attribution Non-Commercial 4.0 license (international)Solar Electtric Investment Analysis is a peer-reviewed publication.Original available at: Suggested acknowledgment: Geiger, Milton; Eric Romich, Benjamin S. Rashford. Solar Electric Investment Analysis. Part 1: Estimating SystemProduction. B-1291.1. 2016.Permission is granted to share, copy, and redistribute the material in any medium or format and adapt, remix, transform, and build upon thematerial for any purpose other than commercial, under the following terms:Attribution — You must give appropriate credit, provide a link to the license, and indicate if changes were made. You may do so in anyreasonable manner but not in any way that suggests the licensor endorses you or your use.Editor: Steven L. Miller, senior editor, College of Agriculture and Natural Resources, Office of Communications and Technology.Graphic Designer: Tana Stith, College of Agriculture and Natural Resources, Office of Communications and Technology.Extension is a Division of the Institute of Agriculture and Natural Resources at the University of Nebraska–Lincoln cooperating with the Countiesand the United States Department of Agriculture.University of Nebraska–Lincoln Extension educational programs abide with the nondiscrimination policies of the University of Nebraska–Lincolnand the United States Department of Agriculture. 2016 , University of Nebraska. All Rights Reserved. 2
Table of ContentsIntroduction.4Part 1: Estimating System Production.5Part 2: Assessing System Cost.7Part3: Forecasting the Value of Electricity.10Part 4: Understanding Incentives. 14Part 5: Conducting a Financial Analysis.19Part 6: PV Solar Example.23IntroductionPhotovoltaic (PV) panels are an increasingly common sight on urban rooftops and rural properties acrossthe U.S. The declining cost of equipment and installation makes installing a behind-the-electric-meter(net metered) solar electric system enticing for many homeowners, businesses, non-profits, and agriculturalproducers. Evaluating the financial prudence of an investmentin solar requires careful consideration of installation costs, theOther Small Scale Renewablevalue of production, and operation and maintenance costs.Systems.Unfortunately, some installers are not forthcoming withinformation necessary to make fully informed investmentdecisions. Third-party ownership structures, such asleases, further increase the challenge of understanding theviability of an investment. This six-part series distills theinformation collection and decision process throughout.We highlight in each part critical questions you must askyourself and your installer. You will be empowered inthe ultimate goal of making an informed decision aboutwhether PV is right for you.Solar electric is now the dominanttype of distributed renewable energysystem, but other renewable energytechnologies, such as small wind, solarthermal, micro-hydropower, groundsource heat pumps, and efficiencyupgrades, require similar scrutiny.Systems that provide thermal energy,as opposed to electricity, have lessregulatory and policy considerations,but the analysis framework is the same.Introduction 3
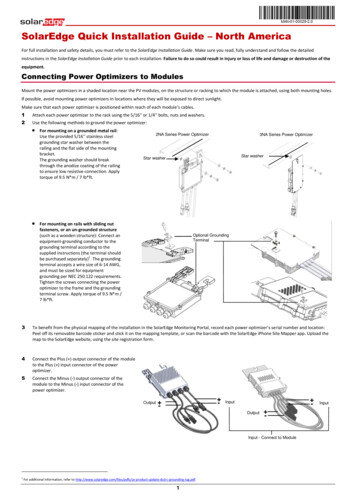
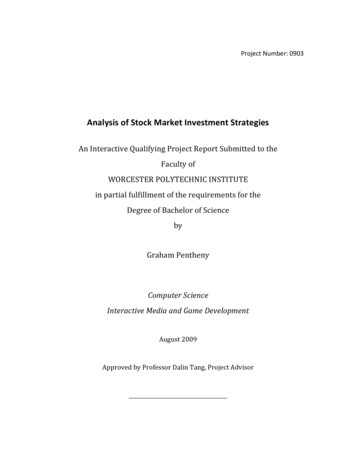
1.EstimatingSystem ProductionProducing renewable energy is much like gardening or farming – the quantity produced and the net value of theproduct determine profitability. If you grow more tomatoes, more tomatoes can be sold at the farmers market.Similarly, if you have tomatoes for sale when others do not, then the tomatoes can be sold at a higher price. Theprofit earned on tomatoes must consider the capital put into growing them (e.g., a high tunnel) and the ongoinginputs (e.g., labor and fertilizer) during the growing season.Two similar components drive the return from a PV system – total amount of electricity produced and net valueof that production. Since electricity is measured in kilowatt-hours (kWh), the value of a solar installation is dictatedby the number of kWh produced and how much they are worth after expenses. The more kWh generated from aninstallation and the higher the net value, the better the rate of return.YOUR SITE-SPECIFIC SOLAR RESOURCEPV installers should provide an estimate of production, typically separated into average monthly production.On a flat landscape, the climate, elevation, and temperature determine the amount of energy produced by aPV solar system. Generally, the resource decreases as one moves from the equator to the poles, but local factorscan significantly influence production. For example, Lincoln, Nebraska, is at approximately the same latitudeas Columbus, Ohio, but Lincoln is sunnier, the same PV array produces 15 percent more electricity in Lincolnthan in Columbus.Site-specific factors are most critical to determineproduction, and the ultimate value, of a solarinvestment. Shading has the most visible negativeimpact on production. Shading effects will vary byseason, often increasing as the sun angle becomeslower in winter months. Departure from truesouth also affects production, as panels facing eastor west will generally produce less than the sameinstallation facing due south. The tilt, often roofslope, of the panels also influences production, asflatter angles will increase production in summerbut decrease production in winter. Temperaturecan also affect production as increasedFigure 1. – Photo by: F. John Haytemperatures increase electrical resistance andreduces PV efficiency. Figure 1 shows a solar array on a barn roof in Ohio.Most PV panels carry at least a 25-year warranty, but like most man-made objects, the sun will degrade PVpanels over time. A typical warranty guarantees that production declines will be less than 0.5 percent a year.A 25-year old panel will produce at least 87.5 percent of original rated capacity of the system – a 10 kW systemwould be 8.75 kW in year 25. These calculations are considered in the National Renewable Energy Lab’sPVWatts and System Advisory Model (SAM), but an installer should also account for these losses. The NationalPart 1: Estimating System Production 4
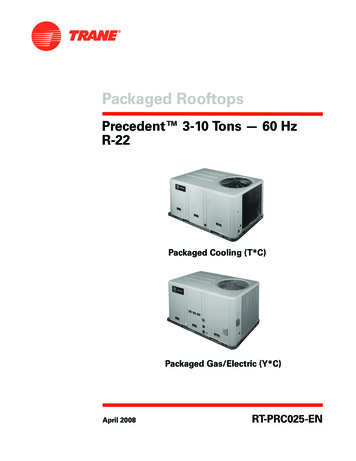
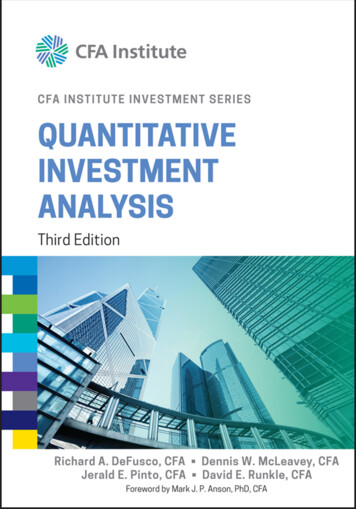
Renewable Energy Lab’s tools and resources can quickly verify an installer’s estimates. Figure 2 shows the resultof a PV Watts model for a 3.6 kW array in Lincoln, NE.KEY QUESTIONS: Is shading, orientation, angle, and temperature included in production estimates? Does the lifetime production include annual declines from degradation?NATIONAL RENEWABLE ENERGY LAB’S PVWattsPVWatts is the most commonly used tool for evaluating solar resource. Novices and expertscan use the easy-to-use platform. PVWatts even allows customized sizing of a solar array andvariations based upon slope and orientation. The tool also offers rudimentary financial analysis.http://pvwatts.nrel.govFigure 2.Part 1: Estimating System Production 5
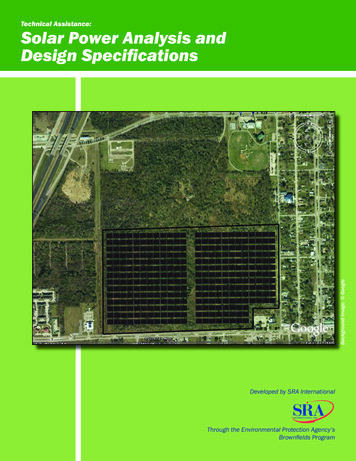
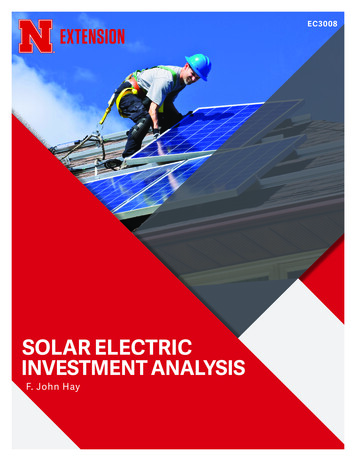
2.AsessingSystem CostInvesting in a photovoltaic solar energy system is a major investment that will influence the future profitabilityof a farm or ranch. In many ways, investing in a solar system is similar to purchasing new farm machinery.When investing in a new tractor, investors start by reassessing their needs for the tractor before researchingvarious models, options, and costs to determine the best option. Whether considering a new tractor or PV solarsystem, the goal is to get the most return on the investment by maximizing the ratio between performance andcost.Investors should carefully evaluate multiple quotes or project proposals when considering a PV solar system.Due to different variables and assumptions used to develop a PV solar proposal, evaluating proposals may seemlike trying to compare apples to oranges. Combining the total system cost with various savings, rebates, taxcredits, grants, and subsidies will further distort the actual investment. If necessary, do not hesitate to ask theinstaller to put the information in an easier-to-understand format. This section will help readers understand thecore components of the cost ofa PV solar system, includingdirect capital costs, indirectcapital costs, and operationsand maintenance. A betterunderstanding of system costsand standard assumptionsallows a more accuratefinancial analysis, fosteringinformed investment decisions.DIRECT CAPITALCOSTSDirect capital costs are thosedirectly associated with the PVsolar system and can be clearlyassigned to a specific pieceof equipment or componentsFigure 3.related to the project. Directcapital costs are included in the total system cost, which is an upfront cost incurred in year zero of the cash flowanalysis. Common examples of direct capital costs for a PV solar system include the solar panels, inverters,and the balance of system components that typically includes racking, wiring, fuses, breakers, and monitoringequipment. As illustrated in Figure 3, the national average cost for utility scale PV solar projects in 2013 was11.2 cents per kilowatt-hour. Direct capital cost accounted for 59 percent of the total costs including panels/modules (33 percent), inverters (9 percent), and the balance of systems hardware (17 percent).INDIRECT CAPITAL COSTSIndirect capital cost represents the soft costs associated with a project. Indirect capital costs are also included inthe total system cost, which is an upfront cost incurred in year zero of the cash flow analysis. Common examplesPart 2: Estimating System Production 6
of indirect capital costs for a PV solar system include the installation costs (labor), grid interconnection,engineering, permitting, environmental studies, and sales tax. As illustrated in Figure 3, indirect capital costaccounted for 41 percent of the total installation cost in 2013. In most instances, the installation costs representthe largest indirect costs for small and midsized systems.OPERATION AND MAINTENANCEUnlike direct and indirect capital costs that occur upfront, operation and maintenance cost represent theongoing annual expenses required to maintain, service, and/or replace critical components of a PV solarsystem. Common examples of operations and maintenance costs for a PV solar system include re-torqueingelectrical connections, replacing fuses, repairing broken/crushed wiring conduit and fittings, locating groundfaults, resealing leaking junction boxes, and repairing or replacing inverters and modules. Proposals usevarious assumptions and can report operation and maintenance costs in many ways, including as a simplefixed annual cost, fixed annual cost proportionate to the system size (nameplate capacity), fixed cost as apercentage of the overall capital investment, and a variable annual cost proportionate to the projected annualelectrical production of the system. The National Renewable Energy Laboratory suggests a fixed operationsand maintenance costs of 19 per kW/year for midsized (10 – 100 kW) PV solar systems. As an example, a 20kW PV solar system would allocate 380 per year ( 19 x 20kW 380) for operations and maintenance costs.Some proposals will apply an annual inflation rate and annual escalation rate to the operation and maintenancecosts. An escalation rate represents the estimated increase in operations and maintenance costs above theannual inflation rate due to the aging of system components. Because there are no moving parts, low operationand maintenance costs are a benefit of PV solar compared to other renewable energy technologies; however, acomprehensive PV solar proposal will account for the operation and maintenance costs because they represent areal cost and are essential to maximizing a system’s production throughout its useful life.SUMMARY - COMPARING MULTIPLE PROPOSALSSeparating the actual system cost from financial incentives, such as tax credits and grants, is important whenevaluating multiple proposals. Typically, renewable energy incentives provided through state and federalgovernment programs and utility providers are not unique to any one installer. The first question whencomparing proposals is an important yet simple one: What is the total system cost?While the question is simple, careful consideration of multiple PV proposals is challenging due to variousconfigurations, assumptions, and system sizes. Establishing consistent metrics is critical to fairly compare systemcost from multiple installers. An easy way to conduct an apples to apples comparison of multiple system costsis to calculate the installedcost per watt (Table 1).Divide the total installedTable 1: Example of Comparing Multiple System Proposalssystem cost by the systemsProposal 1Proposal 2Proposal 3nameplate capacity in wattsSystem Size (kW)9.84811.7777.927(tip: 1 kilowatt 1,000 watts).kilowatts to watts9,84811,7777,927Calculating the installed costDirect Capital Cost 16,600 18,300 14,600per watt is a valuable metricIndirect Capital Cost 11,500 10,900 13,000to compare system cost fromTotal Installed Cost 28,100 29,200 27,600multiple installers whoseIns
installation and the higher the net value, the better the rate of return. YOUR SITE-SPECIFIC SOLAR RESOURCE PV installers should provide an estimate of production, typically separated into average monthly production. On a flat landscape, the climate, elevation, and temperature determine the amount of energy produced by a PV solar system. Generally, the resource decreases as one moves from the .