Transcription
Healthcare Economics, Policy, and OrganizationSection Editor: Nancy BorkowskiSmoothing Effect in Vital Sign Recordings: Fact orFiction? A Retrospective Cohort Analysis of Manualand Continuous Vital Sign Measurements to AssessData Smoothing in Postoperative CareHamish R. Tomlinson, BE (Hons),* Marco A. F. Pimentel, PhD,* Stephen Gerry, MSc,†David A. Clifton, PhD,* Lionel Tarassenko, PhD,* and Peter J. Watkinson, MBChB, MD‡Downloaded from https://journals.lww.com/anesthesia-analgesia by BhDMf5ePHKav1zEoum1tQfN4a kJLhEZgbsIHo4XMi0hCywCX1AWnYQp/IlQrHD3yEktEEoDE Fh N urgVax1yySihqDgQbLjS/pSptlaM on 11/15/2018BACKGROUND: Data smoothing of vital signs has been reported in the anesthesia literature,suggesting that clinical staff are biased toward measurements of normal physiology. However,these findings may be partially explained by clinicians interpolating spurious values from noisysignals and by the undersampling of physiological changes by infrequent manual observations.We explored the phenomenon of data smoothing using a method robust to these effects in alarge postoperative dataset including respiratory rate, heart rate, and oxygen saturation (Spo2).We also assessed whether the presence of the vital sign taker creates an arousal effect.METHODS: Study data came from a UK upper gastrointestinal postoperative ward (May 2009 toDecember 2013). We compared manually recorded vital sign data with contemporaneous continuous data recorded from monitoring equipment. We proposed that data smoothing increasesdifferences between vital sign sources as vital sign abnormality increases. The primary assessment method was a mixed-effects model relating continuous-manual differences to vital signvalues, adjusting for repeated measurements. We tested the regression slope significance andpredicted the continuous-manual difference at clinically important vital sign values. We calculated limits of agreement (LoA) between vital sign sources using the Bland–Altman method,adjusting for repeated measures. Similarly, we assessed whether the vital sign taker affectedvital signs, comparing continuous data before and during manual recording.RESULTS: From 407 study patients, 271 had contemporaneous continuous and manual recordings, allowing 3740 respiratory rate, 3844 heart rate, and 3896 Spo2 paired measurementsfor analysis. For the model relating continuous-manual differences to continuous-manual average vital sign values, the regression slope (95% confidence interval) was 0.04 ( 0.01 to 0.10;P .11) for respiratory rate, 0.04 ( 0.01 to 0.09; P .11) for heart rate, and 0.10 (0.07–0.14;P .001) for Spo2. For Spo2 measurements of 91%, the model predicted a continuous-manualdifference (95% confidence interval) of 0.88% ( 1.17% to 0.60%). The bias (LoA) betweenmeasurement sources was 0.74 ( 7.80 to 6.32) breaths/min for respiratory rate, 1.13( 17.4 to 15.1) beats/min for heart rate, and 0.25% ( 3.35% to 2.84%) for Spo2. The bias(LoA) between continuous data before and during manual observation was 0.57 ( 5.63 to4.48) breaths/min for respiratory rate, 0.71 ( 10.2 to 8.73) beats/min for heart rate, and 0.07% ( 2.67% to 2.54%) for Spo2.CONCLUSIONS: We found no evidence of data smoothing for heart rate and respiratory ratemeasurements. Although an effect exists for Spo2 measurements, it was not clinically significant. The wide LoAs between continuous and manually recorded vital signs would commonlyresult in different early warning scores, impacting clinical care. There was no evidence of anarousal effect caused by the vital sign taker. (Anesth Analg 2018;127:960–6)KEY POINTS Question: Does a “smoothing effect” exist between manually recorded and electronicallyrecorded vital sign measurements in postoperative care? Findings: Using a mixed-effects model, we found no relationship between continuous-manualdifferences and continuous-manual average values for heart rate and respiratory rate, and wefound a weak (but clinically insignificant) relationship for oxygen saturation. Meaning: We found that clinical staff in a postoperative ward did not “smooth” vital signvalues with a bias toward recording more normal readings because the differences betweenmanual and continuous vital sign measurements were not related to the vital sign values.From the *Department of Engineering Science, Institute of BiomedicalEngineering, University of Oxford, Oxford, United Kingdom; †Centre forStatistics in Medicine, Nuffield Department of Orthopaedics, RheumatologyCopyright 2018 The Author(s). Published by Wolters Kluwer Health, Inc.on behalf of the International Anesthesia Research Society. This is an openaccess article distributed under the Creative Commons Attribution License4.0 (CCBY), which permits unrestricted use, distribution, and reproductionin any medium, provided the original work is properly cited.DOI: gesia.organd Musculoskeletal Sciences, Botnar Research Centre, University of Oxford,Oxford, United Kingdom; and ‡Kadoorie Centre for Critical Care Research andEducation, Nuffield Department of Clinical Neurosciences, Oxford UniversityHospitals National Health Service (NHS) Trust, Oxford, United Kingdom.Accepted for publication June 19, 2018.Funding: H.R.T. was funded by the Rhodes Trust (Rhodes Scholarship).M.A.F.P. was funded by the Research Councils United Kingdom (RCUK)Digital Economy Programme grant number EP/G036861/1 (OxfordOctober 2018 Volume 127 Number 4
Manual measurements of the main vital signs—which include respiratory rate, blood pressure,heart rate, temperature, and oxygen saturation(Spo2)—are often inaccurate.1–3 Manual calculations ofclinical risk scores are also error prone.4–6 While automatedmonitoring technology exists, it is mostly confined to highacuity patients, and manual measurement and documentation of vital signs remain the standard of care in manywards. A potential source of inaccuracy that may exist inthe manual vital sign record is data smoothing.7 Clinicalstaff may be biased toward vital sign values that lie withinthe assumed limits of normality and record vital sign valuesthat are incorrectly normal— “smoothing” the extremes inthe vital sign record. If real, this “smoothing effect”8 mayresult in lost opportunities for early recognition of physiological deterioration.The smoothing effect has been reported to occur during anesthesia8–13 and in acute ward monitoring.14,15 Moststudies use methods based on the comparison of vitalsign values from manual and automated measurementssources.9–15 The comparison method makes the cause of“data smoothing” unclear. Vital sign values from monitoring equipment are noisy and may be corrupted with signalartefact, so the smoothing effect may partly result fromclinicians correcting spurious values.14 Undersamplingmay also affect data smoothing based on the magnitudeand frequency of extremal values in longitudinal recordsbecause sparsely sampled manual observations may notcoincide with times of large fluctuations in vital sign values. Analysis compensating for these confounding factorsis essential to discover whether the smoothing effect is ofclinical relevance.We present a secondary analysis of a large database ofpostoperative vital sign records to investigate data smoothing of respiratory rate, heart rate, and Spo2. We propose thatdata smoothing increases the differences between continuous and manual vital sign measurements as the (absolute)value of the vital sign becomes more extreme. We testedwhether differences between continuous and manual vitalsign recordings are related to the average value of the 2 vitalsign recordings. We also assessed agreement between continuous and manual data. Finally, we investigated whetherthere is an arousal effect caused by the vital sign taker.15Centre for Doctoral Training in Healthcare Innovation) and Fundaçãopara a Ciência e a Tecnologia under the grant SFRH/BD/79799/2011. S.G.was funded by a National Institute for Health Research (NIHR) DoctoralFellowship (DRF-2016-09-073). D.A.C. was funded by the Wellcome Trustand Engineering and Physical Sciences Research Council (EPSRC) undergrant number WT 088877/Z/09/Z. L.T. and P.J.W. were supported by theNIHR Biomedical Research Centre Programme, Oxford, which funded theComputer Alerting Monitoring System 2 study.The authors declare no conflicts of interest.Supplemental digital content is available for this article. Direct URL citationsappear in the printed text and are provided in the HTML and PDF versions ofthis article on the journal’s website (www.anesthesia-analgesia.org).Clinical Trial Registration: International Standard Randomised ControlledTrial Number (ISRCTN) database—principal investigator: Dr PeterWatkinson; ISRCTN No: ISRCTN58660550, August 11, 2017 (ComputerAlerting Monitoring System 2 study).Reprints will not be available from the authors.Address correspondence to Hamish R. Tomlinson, BE (Hons), Departmentof Engineering Science, Institute of Biomedical Engineering, University ofOxford, Old Rd Campus Research Bldg, Oxford OX3 7DQ, United Kingdom.Address e-mail to Hamish.tomlinson@eng.ox.ac.uk.October 2018 Volume 127 Number 4METHODSThis article adheres to the Reporting of Studies ConductedUsing Observational Routinely-Collected Health Data statement, an extension of the Strengthening the Reporting ofObservational Studies in Epidemiology guidelines.16,17DatasetThe database for this retrospective analysis was created during the Computer Alerting Monitoring System2 (CALMS-2) study, which was granted ethical approval(Mid and South Buckinghamshire ethics committeeResearch Ethics Committee: 08/H0604/79, December 9,2008, and Leeds [West] ethics committee Research EthicsCommittee: 11/YH/0056, May 20, 2011) and registered inthe International Standard Randomised Controlled TrialNumber (ISRCTN) database (principal investigator: P.J.W.,ISRCTN No: ISRCTN58660550, August 11, 2017). Thisstudy assessed whether ambulatory physiological monitoring combined with an alerting system improved recognition and outcomes in patients after major surgery.Vital sign data used in the CALMS-2 study were collected in a step-down postoperative ward of the OxfordUniversity Hospitals National Health Service (NHS) Trust,Oxford, between May 2009 and December 2013. Potential participants were screened during preoperative assessment anddeemed eligible if they were planned to undergo major uppergastrointestinal surgery. This category was defined as follows: oesophagectomy, oesophagogastrectomy, gastrectomy,Whipple’s operation, liver resection, pancreatectomy, gastricbypass, biliary reconstruction, and splenectomy. Participantswere excluded based on the following criteria: participants 16 years of age, pregnant women, participants unable towear the required monitoring, participants without the capacity to consent, and participants who could not understandwritten English and for whom no translator could be found.For this secondary analysis, patients who did not receivecontemporaneous bedside electronic vital sign monitoringand manual vital sign observations were excluded a priori.Written informed consent was obtained for all subjects.In the step-down ward used in the CALMS-2 study, highrisk patients are admitted after a period of elective intensivecare unit stay, while patients with a lower risk of complication are admitted to the ward immediately after surgery.High-risk patients typically receive an increased level of carefor the first 2–48 hours of their ward stay, during which timethey undergo conventional bedside monitoring, consistingof continuously measured respiratory rate, heart rate, andSpo2 (Philips M3046A/Intellivue MP50 clinical monitor;Philips Healthcare, Best, the Netherlands). Respiratory ratewas measured by impedance pneumography, heart rate wasderived from the electrocardiogram, and Spo2 was measuredby pulse oximetry. Clinical staff also made manual measurements of blood pressure and temperature, typically at hourlyintervals. After this initial period, these patients then join theother patients on the ward in receiving general-ward-levelcare, which consists of manual vital sign recording typically at 4-hour intervals. The standard of care for measuringrespiratory rate on the ward is by counting chest wall movements, and heart rate and Spo2 measurements were likelyto be transposed from the monitor screen. In the CALMS-2study, ambulatory monitoring of heart rate and Spo2 waswww.anesthesia-analgesia.org961
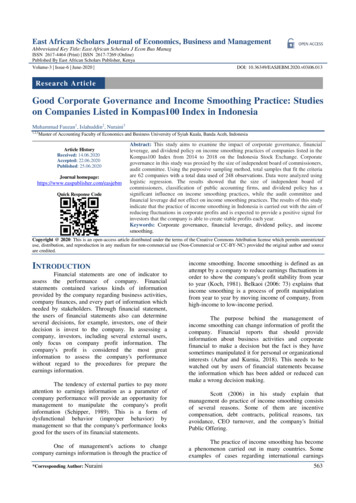
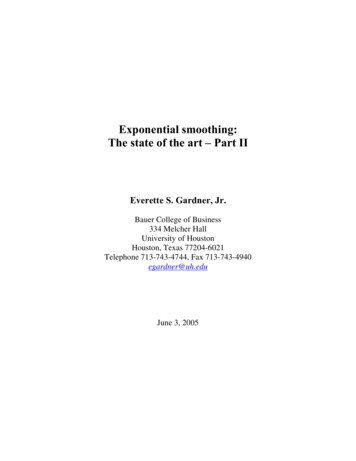
Smoothing Effect in Postoperative Careundertaken. However, for consistency, we restricted thisanalysis to manually recorded values that could be comparedwith contemporaneous values from bedside monitoring.Manual vital sign measurements documented on paperbased bedside charts were double entered into an electronic database. A third researcher reconciled differenceswith access to the original charts.5 Continuous vital signdata from the bedside monitors were saved directly fromthe monitor every second. The final dataset obtained forthis study consisted of vital sign records of respiratory rate,heart rate, and Spo2 from continuous bedside monitoringequipment and manual vital sign observations.Manual and continuous vital sign values were compared based on the timestamps taken from paper recordsand the computer-generated timestamps from the patientmonitor. Clinical staff manually recorded blood pressuremeasurements at the time of observation, and these werealso logged in the automatically generated data record. Weset the manual observation time for all vital signs to thecomputer-generated timestamps for blood pressure (whilechecking that data were correctly matched). This calibrationmethod ensured that the data considered contemporaneousfrom manual and continuous measurement sources weresynchronized, and thus could appropriately be used forcomparison.Statistical AnalysisWe summarized the number of vital sign measurementsincluded per patient using the sample median and interquartile range.We sampled the continuous data at the time of eachmanual observation to create paired measurements of continuous and manual vital signs. We sampled the continuousdata by extracting the median value of a 5-minute windowcentered at the time of manual observation. We used thismethodology (also known as “median filtering”) to summarize the continuous data without the effects of measurementnoise or short-term variance while retaining long-term vitalsign trends. We included all manual observations withcontemporaneous periods of continuous data, allowingpatients to provide multiple observations in our analysis.We selected a 5-minute window to reflect clinical practice,in line with previous work.13,15 We undertook sensitivityanalyses by recomputing the primary assessment methodfor windows of 1–10 minutes.To obtain the differences between the 2 measurementsources, we subtracted the manual vital sign from the continuous vital sign in each measurement pair. We also calculated the average of the continuous and manual vital signsfor each measurement pair. We modeled the relationshipbetween the differences and the averages of the measurement recordings using a linear mixed-effects model, withaverages as a fixed effect and subject as a random effect toadjust for repeated measurements. We note that there maybe factors other than a smoothing effect that could affect therelationship between the continuous-manual difference andthe continuous-manual average, notably the accuracy of thecontinuous monitoring equipment. However, given our useof gold standard monitoring equipment and median filtering to remove transient outliers, the continuous data werelikely to be equally reliable over the range of measurement962www.anesthesia-analgesia.org values. Thus, a linear relationship between the continuousmanual difference and the continuous-manual averagewould be best explained by a clinical bias in the manualdata, allowing the smoothing effect to be tested.The regression slope of the fixed effect in the mixedeffects model represents the increase in the continuous-manual difference for a 1-unit increase in the continuous-manualaverage. Statistical significance of the regression slope wascalculated with an F test (type III with Kenward–Rogerdegrees of freedom approximation),18 using a significanceof 0.05 to reject the null hypothesis that the regression slopewas 0 (no relationship). To assess the clinical significanceof the linear relationship, we simulated the mean differences and 95% confidence intervals (CIs) predicted by ourmodel at vital sign values corresponding to important clinical thresholds. We used respiratory rate values of 8 and 24breaths/min, heart rate values of 40 and 130 beats/min, andan Spo2 value of 91%, which are the maximum NationalEarly Warning Score limits for each vital sign.19We generated Bland–Altman plots for the continuous andmanual vital sign data by plotting the differences betweenthe 2 measures (y-axis) against the averages of the 2 measures (x-axis). The bias was calculated as the mean difference between continuous and manual measurement pairs.Limits of agreement (LoAs) were calculated using a mixedeffects model, including a subject random effect to adjust forrepeated measurements.20 CIs (95%) were calculated for thebias and the LoAs using the method recommended by Blandand Altman.21 Horizontal lines were included on the Bland–Altman plots to show the bias and LoAs. The regression linefrom the linear mixed-effect model was plotted to visualizethe relationship between the differences and the averages.We assessed whether there is an arousal effect caused bythe vital sign taker by comparing continuous data beforeand during the time of manual observation. For the continuous data before the observation, we used the median valueof a 15-minute window ending 5 minutes before the timeof observation. For the continuous data during the time ofobservation, we used the median of a 5-minute window, asdescribed in previous paragraphs. These methods replicatethose of Taenzer et al,15 to allow comparison. The selectionof the continuous data is shown schematically for heartrate in Figure 1. We prepared Bland–Altman plots for the“before” and “during” measurements using the same methodology described in the previous paragraph.We did not perform sample size calculations for thisstudy because it is a retrospective cohort study of an existing dataset—we used all available data, noting that ourdataset was larger than those used in most previous analyses of the smoothing effect.9–13,15,22 We also could not identify the statistical power of the study since previous studiesof “the smoothing effect” have not used Bland–Altmananalyses (preventing estimation of approximate populationregression slopes). We instead provided CIs for all reportedoutcomes to demonstrate the precision of our results, as recommended by Goodman and Berlin.23RESULTSPatient inclusion is shown in Figure 2. Concurrent manual and continuous vital sign measurements were available for respiratory rate from 263 patients (3740 pairedANESTHESIA & ANALGESIA
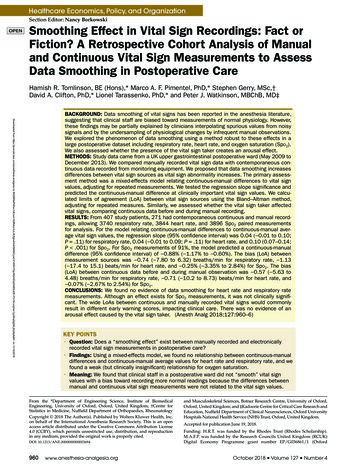
1.13 ( 17.4 to 15.1) beats/min for heart rate, and 0.25%( 3.35% to 2.84%) for Spo2 (Figure 3 and Table).The bias (LoA) between continuous data before andduring manual recording was 0.57 ( 5.63 to 4.48) breaths/min for respiratory rate, 0.71 ( 10.2 to 8.73) beats/min forheart rate, and 0.07% ( 2.67% to 2.54%) for Spo2 (Figure 4and Table). CIs (95%) for the bias and LoAs are reported inthe Table.Results for the sensitivity analysis of the primary assessment method for different window sizes (during the manualobservation) are given in Supplemental Digital Content 1,Table 1, http://links.lww.com/AA/C522.DISCUSSIONFigure 1. An example heart rate observation, for which the “before”window is shown in blue, the “during” window is shown in green,and the manual observation (synchronized to the time of the bloodpressure measurement) is shown in red.Figure 2. The vital sign data selection process. CALMS-2 indicatesComputer Alerting Monitoring System 2; Spo2, oxygen saturation.measurements), heart rate from 267 patients (3844 pairedmeasurements), and Spo2 from 271 patients (3896 pairedmeasurements). The median (interquartile range) numberof observations for each patient was 11 (7–18) respiratoryrate, 11 (7–18) heart rate, and 11 (7–19) Spo2 measurements.The mixed-effect model regression slope (95% CI)between the continuous-manual difference and the continuous-manual average was 0.04 ( 0.01 to 0.10; P .11) forrespiratory rate, 0.04 ( 0.01 to 0.09; P .11) for heart rate,and 0.10 (0.07–0.14; P .001) for Spo2 (Figure 3 and Table).The mean differences (95% CI) predicted by the model were 1.14 ( 1.57 to 0.71) and 0.44 ( 1.57 to 0.04) breaths/minfor respiratory rates of 8 and 24 breaths/min, respectively.Likewise, the differences were 2.93 ( 4.75 to 1.11) and0.63 ( 4.75 to 3.26) beats/min for heart rates of 40 and 130beats/min, respectively, and 0.88% ( 1.17% to 0.60%) forSpo2 values of 91%.The bias (LoA) between the continuous and manual datawas 0.74 ( 7.80 to 6.32) breaths/min for respiratory rate,October 2018 Volume 127 Number 4We found no clinically relevant smoothing effect in postoperative care. If vital sign data were smoothed, then manualmeasurements would be recorded above abnormally lowand below abnormally high continuous measurements,causing continuous-manual differences to be related to vitalsign values. However, differences between manual andcontinuous heart rate and respiratory rate measurementswere not related to the average values because the regression slope was not significantly different to 0. Differencesbetween manual and continuous measurements of Spo2were related to the measurement value. However, this relationship was clinically insignificant (Figure 3), with minordifferences for low values of Spo2. For example, for Spo2measurements of 91%, the model predicted a continuousmanual difference of 0.88% ( 1.17% to 0.60%), which iswithin the measurement error of most pulse oximeters.24The LoAs (95% CI) between continuously and manuallyrecorded vital signs were large: 14.1 (13.8–14.4) breaths/min, 32.5 (31.9–33.3) heartbeats/min, and 6.2% (6.1%–6.3%)Spo2 between LoAs, suggesting that these recordings cannot be used interchangeably. We found no evidence of anarousal effect from the vital sign taker. The bias betweencontinuous vital sign values recorded before and duringmanual observation was less than a single breath, heartbeat,or percentage Spo2.Our sensitivity analysis showed that window sizeaffected the relationship between continuous-manual differences and averages but not to a clinically meaningful extent(Supplemental Digital Content 1, Table 1, http://links.lww.com/AA/C522). As window size was reduced, lesseningthe effect of median filtering, the differences predicted by themodel increased, although only by 1–2 heartbeats or breaths.Increasing the window size does not affect our findings, suggesting that the choice of a 5-minute window (also chosen byReich et al13 and Taenzer et al15) appropriately removes artefact without increasing the sample size beyond what is plausible for bedside measurement. Notably, 4 previous studiesfound a smoothing effect using automated monitoring signals without temporal averaging, relying on manufacturersettings for artefact removal.8,9,11,12 Sapo et al14 demonstratedthat Spo2 values 90% are associated with poor signal quality, suggesting that the effects in these studies may be due toclinicians correctly removing spurious values.Further methodological differences may explain whyour results contrast with the previous literature suggesting a smoothing effect.8–10,12,13,22 Four studies compared thewww.anesthesia-analgesia.org963
Smoothing Effect in Postoperative CareFigure 3. Bland–Altman plots for RR, HR, and Spo2 showing limits of agreement between the continuous data and the manual observation(continuous data–manual observation). Bias and limits of agreement are shown with blue lines, the regression line is shown in green, and adashed red line shows the zero y-intercept. HR indicates heart rate; RR, respiratory rate; Spo2, oxygen saturation.Table. Results for the Bland–Altman Analysis Comparing Continuous Vital Sign Data to ManualObservations for Respiratory Rate, Heart Rate, and Oxygen SaturationBland–Altman AnalysisSample sizePatients (observations)Continuous-manualBias (CI)Lower LoA (CI)Upper LoA (CI)Regression slopea (CI), P valueb“Before” – “During”Bias (CI)Lower LoA (CI)Upper LoA (CI)Respiratory Rate (breaths/min)263 (3740)Vital SignHeart Rate (beats/min)Spo2 (%)267 (3844)271 (3896) 0.74 ( 0.82 to 0.66) 7.80 ( 7.94 to 7.66)6.32 (6.18–6.46)0.04 ( 0.01 to 0.10), .11 1.13 ( 1.32 to 0.94) 17.4 ( 17.7 to 17.1)15.1 (14.8–15.5)0.04 ( 0.01 to 0.09), .11 0.25 ( 0.29 to 0.22) 3.35 ( 3.41 to 3.29)2.84 (2.78–2.90)0.10 (0.07–0.14), .001 0.57 ( 0.63 to 0.51) 5.63 ( 5.72 to 5.53)4.48 (4.38–4.58) 0.71 ( 0.82 to 0.60) 10.2 ( 10.3 to 9.97)8.73 (8.55–8.92) 0.07 ( 0.10 to 0.04) 2.67 ( 2.72 to 2.62)2.54 (2.49–2.59)Abbreviations: CI, confidence interval; LoA, limits of agreement; Spo2, oxygen saturation.aRegression slope from the linear mixed-effect model, which represents the increase in the continuous-manual difference for a 1-unit increase in the continuousmanual average.bStatistical significance of the regression slope between the differences and the average of continuous and manual vital sign data was calculated with an F test(type III with Kenward–Roger degrees of freedom approximation),18 using a significance of .05 to reject the null hypothesis that the regression slope was 0.Figure 4. Bland–Altman plots for RR, HR, and Spo2 showing limits of agreement between continuous data sampled before the observation andcontinuous data sampled during the observation (“before” data – “during” data). Bias and limits of agreement are shown with blue lines, anda dashed red line shows the zero y-intercept. HR indicates heart rate; RR, respiratory rate; Spo2, oxygen saturation.magnitude and frequency of extreme values in manualand automated vital sign measurements where the automated measurement had higher measurement rates.9,10,12,22Frequently sampled signals are more likely to capture transient extreme measurements than sparsely sampled signals,964www.anesthesia-analgesia.org partly explaining the discrepancies found in these articles.Furthermore, 1 study compared manual and automatedmeasures from different patient cohorts,13 while others onlypresented data from automated measurements8 or usedsimulated measurements from mannequins.22ANESTHESIA & ANALGESIA
In contrast to our Spo2 findings, Taenzer et al15 reporteda difference of 6.5% between continuous and manual measurements of Spo2 90% in general medical and postoperative wards. The method used continuous data to group Spo2measurements 90% or 90%, thus comparing the differencesbetween measurement sources to the values of the continuous source. Bland and Altman25 have shown that this processintroduces a false correlation to the data. Hence, we comparedthe differences to the average values as recommended.25,26 Forreaders interested in this effect, we have replicated our analyses, comparing the difference against the continuous measure (and finding false correlations) in Supplemental DigitalContent 2, Figure 1, http://links.lww.com/AA/C523.25Manually recorded vital sign measurements variedwidely from the continuous measurements. Respiratoryrate is difficult to measure clinically,2,3 so the high variancein the differences between continuous and manual measurements is perhaps not unexpected. However, as earlywarning scores commonly include respiratory rate rangesbetween 2 scores of 4 breaths/min or less,19,27 these differences would commonly impact clinical care. The LoAs forheart rate and Spo2 were also wide and again would commonly result in different early warning scores. These resultsare important for those seeking to automate early warningscores,28,29 which have not been designed for use with continuous data, so patients would clearly alert differently.Our study is limited by its single-center design becausepractices may vary between hospital wards and institutions. There may have been transcription errors in the valueor timing of manual vital sign observations. This effect wasminimized by double data entry and synchronizing observation times with computer-generated timestamps of bloodpressure. One bedside monitoring provider was used in thisstudy, so we could not assess differences between monitors.If we had found a relationship between the continuousmanual differences and averages, then this would haveprevented exploration of whether the relationship couldbe explained by monitor inaccuracy, rather than cliniciansmoothing. Because there is no clinically significant relationship, this is not a significant issue for our findings. Ourresults are not influenced by undersampling because themeasurement pairs of manual and continuous data samplethe same physiology. The strengths of our article are thelarge dataset used in comparison to previous work and theanalysis of 3 different vital signs.We have provided evidence against the existence of asmoothing effect in postoperative care. However, this phenomenon may still exist in the context of anesthesia. It ispossible that errors in vital sign documentation increasewhen clinicians record vital signs from memory after themeasurement has been taken.9,10 This may be more pervasive in acute episodes during surgery and may not applyto postoperative wards, where nursing staff are available tomeasure and document vital signs simultaneously. Furtherresearch should investigate the smoothing effect duringanesthesia, using the Bland–Altman method of assessingagreement between measurement sources, and comparingmanually recorded measures to the median of a continuouswindow. If confirmed, the effects of the large differencesbetween manually recorded and
monitoring technology exists, it is mostly confined to high-acuity patients, and manual measurement and documen-tation of vital signs remain the standard of care in many wards. A potential source of inaccuracy that may exist in the manual vital sign record is data smoothing.7 Clinical staff may be biased toward vital sign values that lie within