Transcription
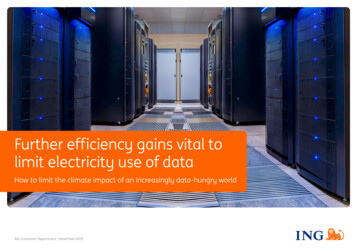
Further efficiency gains vital tolimit electricity use of dataHow to limit the climate impact of an increasingly data-hungry worldING Economics Department November 2019
Introduction Conclusion Data and electricity explained Looking back Looking forward Implications ContentsIntroductionPrefaceContentsAmounts of data at unimaginable levelsConclusion 3Billions of people watching videos on their smartphone, more and more machinesconnecting to the internet, blockchain calculations being performed and manycompanies moving their businesses into the cloud.4Looking back 6Looking forward 8Devices are currently main power users Electricity intensity and volume determine power use The data behind these activities travels over networks, through the air, and viaunderground and submarine cables that pass through ever expanding data centres.The technology sector is increasingly considered to be an electricity guzzler ofinterest. It is often assumed that the amount of data will skyrocket in the comingdecade, which will also lead to increasing energy consumption. With energyreduction – in relation to climate impact – becoming a top priority for businessesand governments after the Paris agreement, this aspect is of increasing interest tothe technology sector. Electricity use is relevant for tech companies such as cloudproviders, software vendors, data centres, internet service providers and mobilenetwork operators. Their data-related electricity use is determined by both datavolumes and efficiency.Power rise was limited despite sharp data increase Networks and data centres became much more efficient Future data growth dwarfs further increase in number of devices Devices: Shift to handheld devices drives down future power use Networks: swift drop in 5G energy intensity needed to prevent power demand surging Data centres: Scaling and AI to boost energy efficiency In 2030, 5% of global power is needed for data flows 456789101112Implications 13This report focuses on the energy needed to enable data to flow and will thereforeinvestigate: To what extent data flows will increase and what this means for electricityconsumption; What impact additional electricity consumption has on achieving the Parisclimate goals; and What technology companies can do to limit energy use.ING Economics DepartmentData and electricity explained Using renewable energy is key to limiting CO2 emissions A lot can be done when combining power-saving innovations and renewables 1314Sources 15Additional information 2 16Further efficiency gains vital to limit electricity use of data November 2019
Introduction Conclusion Data and electricity explained Looking back Looking forward Implications ContentsConclusionData growth will be staggeringBy 2030, global dataflows are expected to be more than20 times those of 2018. This staggering growth is driven bymore people having access to the internet, more internettraffic per user, connected machines, cloud servicesflourishing and more big data and computations in AI.Share of data-driven electricity use will probablyincrease from 3% to at least 5% of global use.The exponential growth in data means power use forthese flows will double and therefore grow to about 5% ofworldwide electricity use in 2030. Networks and data centresin particular will see the strongest growth.Cloud data increases twentyfold towards 2030.without efficiency gains this share will be morethan 30%CO2 emissions, the tech and telco (telecoms) sector shouldfocus on implementing efficiency-increasing innovationsthat limit electricity use.Increasing data demand means network and data centreservices require more and more power. Without efficiencygains the share of data in global power use would rise tomore than 30%. To keep the rise in electricity use limitedto 5% of global power use, electricity use by network anddata centre services has to get substantially more efficient.Recent history shows that the efficiency improvementneeded can be achieved, but it requires power-savinginnovations to continue.Focus on efficiency to limit climate impact of dataSourcing renewables to limit climate impact ofgrowing electricity useDevices, networks and data centres handle large quantities ofdata. In limiting the impact that growing data flows have onA strong rise in electricity use seems inevitable, given thehuge growth in data. Therefore, in addition to focusingon implementing efficiency-increasing innovations, usingrenewable power to generate electricity is vital to furtherlimit carbon emissions. Focusing on creating additionalrenewable energy capacity can prevent a potential shortfallbetween required and available green power.Future potential average annual efficiency gainsseem attainable from a historical perspectiveEfficiency gains (CAGR)Around 5% of global power needed for data flowsTotal data flow per year in ZB20102018201820304%3%Networks17%15% Shift away from 2G and 3G 5 G power management,architecture and protocolsDataCentres25%16% S cale: larger share forefficient hyperscalers AI energy managementElectricity use as % of total electricity consumptionworldwide250Cloud31% Without 10201420182022Source: ING Economics Department based on CiscoING Economics Department2026203020182030Source: ING Economics Department based on BNEF3 With efficiencyimprovementsEfficiency drivers in future Shift towards handheld Low energy designSource: ING Economics Department calculationsFurther efficiency gains vital to limit electricity use of data November 2019
Introduction Conclusion Data and electricity explained Looking back Looking forward Implications Contents1 Devices are currently the main power usersDevices, networks and data centers determineelectricity use for data flowsThis report looks at total power use for data flows by takingthe following as components:1Devices2Networks3Data centresCurrently, over 40% of electricity is consumed by devices,with networks responsible for about a third and data centres(DCs) for a quarter.More detailed descriptionNetworksData CentresDefinitionWhat part of electricity use is in scopeComputers, tablets, smartphones andother mobile phones of businesses andconsumers generating, sending andreceiving data. During use (‘at the plug’), not manufacturing and disposal. Electricity use of other connected devices out of scope becausetheir primary role is not communication or data storage (e.g.connected washing machine, car).Mobile and fixed-line networks used totransfer data, operated by telecomsplayers and other carriers. Electricity use of equipment such as switches and routers,transmission link elements and supporting infrastructure forcooling, power, etc. Traditional fixed telephony is excluded.Providers of storage, processing anddistribution of data Power for the IT hardware (e.g. servers, storage drives andnetwork devices) as well as the supporting infrastructure (e.g.cooling, lighting). Consists of single tenant (private), multi-tenant(co-location) and hyperscale data centres.ING Economics Department4 Electricity consumption per year as a percentage oftotal, 2018ComponentTo provide more insight into what makes up the threecomponents of data-related electricity use, the table belowpresents a more detailed description of devices, networksand DCs.Devices, networks and data centres determine electricity use for data flowsDevicesCurrently devices consume more than 40% ofelectricity for global data trafficSubcomponentShare in s entInfrastructure24%Source: ING Economics Department based on BNEF, IEAFurther efficiency gains vital to limit electricity use of data November 2019
Introduction Conclusion Data and electricity explained Looking back Looking forward Implications Contents2 Electricity intensity and volume determine power usePower use depends on both the amount of data andintensityElectricity use in this report is determined by both volumesand how efficient devices, networks and data centres are.This is the electricity intensity, or the power needed per unit.How are software companies involved in power use?Power use of devices is the number of devices in use timesthe electricity use per device. Networks' total electricityuse is network data times electricity use per byte. For DCs,this is cloud data times the electricity intensity, in this caseelectricity per byte of data.1On the next page, we look at how device numbers, dataflows and the electricity intensity and subsequent electricityuse have developed in the past.How is eletricity use of devices, networks and data centres determined?Although the software sector is not at first sight a driver ofelectricity use, it has a role in: Software efficiency: Software-related electricity use bydevices, networks and DCs, such as the efficiency of theoperating system and applications both through coding(programming language), design (e.g. background) and otherattributes. Software defined: Using software to shape generic hardwareinto different functions for networks and DCs, which also hasan impact on power use. Software managed: Automatic upscaling and downscalingof network and DC IT infrastructure, enabling an increase ordecrease in hardware capacity.Number of .Electricity use ofdevices depends on Electricity use ofnetworks depends on Electricity use of datacentres depends onElectricity intensity measured as DevicesxElectricity useper device101010101010101Bytes ofnetwork dataxElectricity useper byte101010101010101Bytes ofcloud dataxElectricity useper byte1 Drivers of electricity use are more complex in reality, especially for DCs. DCs use power for storage, communication and computation function through the servers the DC houses (expressed in MWs).ING Economics Department1010101010101015 Further efficiency gains vital to limit electricity use of data November 2019
Introduction Conclusion Data and electricity explained Looking back Looking forward Implications Contents3 Electricity rise was limited despite sharp data increaseData flows show strong increase The amount of data and number of devices has grown inrecent years. Especially data has shown strong growth: More and more people and their devices are constantlyonline; More and more data is generated and collected; and Businesses are moving their activities online, into thecloud.All this requires a constant movement of data. Thereforetotal cloud data volume reached 11.6 zettabytes2 in 2018,– a tenfold increase on 2010. Network data flows, mainlyinternet data, were more than eight times the levels in 2010.As the pace of data growth keeps increasing.Development of number of devices, network and clouddata flows (index 2010 100)Clouddata1.000Networkdata500.while electricity use only goes up 1.2 times To enable these data flows, electricity is needed to run thehardware and the software that transports data across theglobe. It is estimated that more than 800 TWh is consumedyearly, about the power use of Belgium, the Netherlandsand Germany combined. Between 2010 and 2018, the powerneeded increased by 23%, or by approximately 1.2 timesthat of 2010, despite the gigantic data increase. meaning electricity intensity declinedThis means that the electricity intensity of data flowshas decreased, requiring substantially less electricity perzettabyte of data. Potential explanations of this developmentare more efficient semiconductors3 plus advances intransmission technology and compression technology.the rise in power used is limited.Tech sector limits power use despite data growthThe share of the technology and telco sector in total globalelectricity use is fairly stable at around 3%. So, despite theenormous increase in data flows, the sector has succeededin limiting the rise in electricity demand by becoming moreenergy-efficient.The question is whether the sector can continue to keep itsshare in electricity use stable in the future, given an expecteddata increase. It will require substantial improvementsin electricity intensity through further technologicaladvancements. In looking towards the future, this reporttakes 2030 as the horizon. therefore the share in power needed remainsstableDevelopment of electricity used for data flows(index 2010 100)Electricity for data flows as % of total electricityconsumption 2012201420162018Source: ING Economics Department analysis based on Cisco VNI, GSMA,Andrae20102012201420162018Source: ING Economics Department analysis based on IEA and others2010Source: ING Economics Department calculations2 A Zettabyte is a 1 followed by 21 zero’s, with bytes being the unit of digital information3 How much electricity a computer consumes (at peak-output) is subject to Moore’s law, the observation that the number of transistors that can be crammed onto a chip of a given size doubles every two years.ING Economics Department6 Further efficiency gains vital to limit electricity use of data November 2019
Introduction Conclusion Data and electricity explained Looking back Looking forward Implications Contents4 Networks and data centres became much more efficientElectricity intensity in more detailElectricity intensity: a lever to pullData centres use less electricity than networks perbyte of dataElectricity intensity decreased significantly between 2010 and 2018Overall, the tech and telco sector managed to considerablyreduce electricity intensity in the past few years. In this case,we will look at how electricity intensity developed for devices,networks and data centres specifically, and what significanceit holds for limiting power use.Average annual improvement inelectricity intensity 2010-2018 (CAGR)Currently electricity consumed per zettabyte of data for DCsis almost 90% lower than for networks. Electricity intensity ofdevices is at 27 TWh per billion devices.Data centres and networks show biggest increase inefficiencyBetween 2010 and 2018, devices have increased in efficiencyby 4% yearly on average, benefiting from a focus on batterylife improvement (display, processor). Both networks and DCshave significantly improved their electricity intensity (CAGRof 17% and 25% respectively). Fixed networks have benefitedfrom the move to fibre cables, which require less energy thancopper and greatly benefit from advances in transmissiontechnologies. Mobile networks have increased efficiency withevery generation.Data centres have seen the application of infrastructuremanagement technologies and improvements in coolingthat also allow a higher standard temperature. Furthermore,equipment has seen improved utilisation and has becomemore electricity-efficientING Economics DepartmentThe following pages will describe future devices and datagrowth and then focus on innovations and trends thatcontribute to further improvements in electricity intensity ofdevices, networks and data centres.Electricity intensity is the key to limiting the tech and telcosector's future electricity consumption. The main questiontherefore is: how can energy intensity be improved?And what effort is needed to limit additional electricityconsumption?DevicesNetworksData Centres4%Main efficiency drivers Display technology Solid state drive or SSD (flash memory) Improvements to battery technology Processing efficiency (Moore’s Law)17% Moving from copper to fibre Multiplexing; combining multiple signals and transporting theseover a single fibre Network virtualisation25%Equipment:Infrastructure: VirtualisationScalingProcessing efficiency (Moore’s Law)SSDHigher temperaturesHot/cold air separationFree air coolingSource: ING Economics Department7 Further efficiency gains vital to limit electricity use of data November 2019
Introduction Conclusion Data and electricity explained Looking back Looking forward Implications Contents5 Future data growth dwarfs further increase of devicesWe will look at future developments for devices, networks and DCs, and zoom in on their drivers: the number of devices, network data and cloud data.DevicesNetworksNumber of devices shows weakening growthData centersData over networks doubles in size every 2 to 3 yearsCloud data will continue to see exponential growthGrowth in devices limitedNetwork data 23 times bigger in 2030 than in 2018Cloud data increases twentyfold towards 20301650Cloud403020100250 Cloud2001501005002010Growth in the number of devices (computers, tablets,smartphones and other mobile phones) in use will be limitedto 1.7% on average towards 2030.4 This growth is mainlydetermined by: Population growth of 1% yearly towards 2030.5 The potential for growth in the number of devices percapita is limited, translating into an additional annualincrease in devices of 0.7%. Most of the developed worldhas already reached saturation levels. In developingcountries, there will mainly be a substitution of ordinarymobile phones with internet connected smartphones.Total number of devices in use in billionsTotal data flow per year in ZB128420102014201820222026Global IP traffic over networks will continue to grow at astrong pace, roughly doubling in size every 2 to 3 years.Network data growth is mainly driven by the following: The number of people having access to the internet inAsia, Africa and South America is growing. A strong increase in internet traffic per user is expected,partly due to video and gaming, supported by fasterbroadband speeds More machines will be connected to the internet (internetof things [IoT]) generating, sending and receiving data.20302010x232014Source: ING Economics Department based on GSMA, Andrae20182022Increased accessworld populationPopulation growth main driver.Number of devices per capita stable.Source: ING Economics Department based on Cisco20262030IoT taking offGlobal cloud data will see strong growth, doublingapproximately every 3 years. Cloud data flows will growmainly due to: DC-to-DC traffic increasing as cloud services flourish,data is moved between clouds and replicated across DCs.CDNs (content distribution networks) gain importance asstreaming media grows. Within-DC traffic growing. Big data and AI computationsare significant drivers of traffic within the DC. More data isgenerated, collected, exchanged, analysed and stored. DC-to-user traffic expands. As this part largely overlapswith network data (which in addition includes peer-to-peerdata), its drivers are the same.Total data flow per year in ZBCx21201420182022Organisations continueto move to the cloud20262030Big data and AIgain further tractionSource: ING Economics Department based on Cisco4 Note that the IoT will result in more machines connecting to the internet, but these are not in scope under devices. Their primary role is not communication or data storage, and most of their energy consumption is related to their primary role.5 UN World Population Prospects 2019 estimate.ING16Economics Department12Cloud201612840Cloud8 Further efficiency gains vital to limit electricity use of data November 2019
Introduction Conclusion Data and electricity explained Looking back Looking forward Implications Contents6 D evices: Shift to handheld devices drives down futurepower useWith the ongoing strong growth in data in mind, thefocus will have to be on electricity intensity to limit futureelectricity use. The following three pages will look at whatdata growth will mean for power use with and withoutfurther efficiency gains. It will also describe efficiency drivers.Slow growth in numbers and shift towards handhelddevices keep electricity use in checkAs it stands, 1.4% of worldwide power is used by devices.Without innovations, electricity use would only go up atroughly the same pace as global power use, as growth in thenumber of devices is restrained. As a result, devices woulduse 1.2% of total electricity in 2030.Battery-powered devices are already highly energy-efficient.Overall, the average energy intensity of devices can improvefurther mainly because desktop computers lose ground toless energy-intensive devices (e.g. tablets).Assumptions and forecasts 2018-2030 The main driver of the improvement in electricity intensity isthe shift towards less energy-intense devices. By 2030, 86%of devices are handheld (2018: 71%), resulting in efficiencyimprovement of approx. 3% per year. Low-energy design innovations are estimated to result in anadditional decrease in energy intensity of approx. 0.5%Low-energy design main route to further increaseefficiencyProcessors and screens use the bulk of electricity in devices.Semiconductor manufacturers remain focused on lowenergy design, bringing chips to market that can perform thesame tasks as before while using less electricity. In practice,this means better performance while roughly keepingelectricity use the same. The main innovations to driveelectricity efficiency in processors are: Intelligent, dynamic power management: Finishing ajob quickly and efficiently to enable a faster return to theultra-low-power idle state. Power efficient design: Improvements to circuit designand component integration, e.g. power gating (reducingpower by turning off parts of a design) or multi-supplyvoltage techniques (using different voltages for differentchip parts). Heterogeneous computing: Combining central processingunits and special purpose accelerators such as graphicprocessing units on the same chip saves energy byeliminating connections between discrete chips.The efficiency improvements can lead to an estimated 3%annual decline in electricity intensity. That drives electricityuse down to 0.8% of worldwide power use.Smartphone and tablet use much less power thancomputersYearly electricity use in kWh56SmartphoneTablet32642LaptopDesktopSource: Fraunhofer USAImproved power intensity leads to a drop inrelative power use by devicesElectricity use as % of total electricity consumptionworldwide1.4%Without efficiency1.2% improvements0.8% With efficiencyimprovements20182030Source: ING Economics Department calculations, BNEFING Economics Department9 Further efficiency gains vital to limit electricity use of data November 2019
Introduction Conclusion Data and electricity explained Looking back Looking forward Implications Contents7 N etworks: swift drop in 5G energy intensity needed toprevent power demand surgingImpact of going mobile softened by generationalshiftNetworks currently use 1% of total global electricity. In theabsence of efficiency changes, this would grow to almost18% in 2030. However, consumers and businesses use moreand more mobile devices and data. This would drive upelectricity use even further, as mobile networks are moreelectricity-intense than fixed lines. However, mobile networkshave become significantly more energy-efficient with everygeneration. As network carriers invest more heavily in mobilenetworks, the phaseout of energy-intensive legacy networksaccelerates.Assumptions and forecasts 2018-2030 Shift towards wireless and mobile networks results in 3-5%increase in electricity intensity. Shift from 2G and 3G towards 4G and later 5G networks meansapprox. 10% decrease in electricity intensity. Other changes (e.g. move to fibre, intensity of equipment suchas switches, and reducing AC-to-DC conversion losses) result in8-10% decrease in electricity intensity.Designing and improving 5G networks with energyefficiency in mind is crucial.The next generation networks, 5G, are rolled out in thecoming years. 5G technology is based on high frequency,shorter wavelength signals that can carry large amounts ofdata – but not nearly as far as current systems. This meansinvesting in much more equipment and antennas. Themain concern therefore is that the increased speed of 5G(up to 20 times faster than 4G) will require a denser towerinfrastructure and, consequently, require more electricity. Toovercome this, energy efficiency can be improved by: Power management for base stations (switching offwhen idle). This becomes more relevant as data can betransferred in a shorter time, creating longer periods inwhich the network connection can be idle. New 5G architecture leads to better infrastructure scaling,lower computational redundancy and fewer hardwaresystems, reducing overall energy consumption. Softwaredefined networking enables a quick roll-out of energyefficiency enhancements. New protocols (e.g. on compression) and techniques (e.g.beamforming, directing radio transmission signals in aspecific direction) reduce power consumption.Innovations and shifts between networks will probably leadto an estimated aggregate energy intensity improvementof 15% annually. This results in a rise towards 2.5% ofworldwide power being used for networks in 2030.Mobile network energy intensity declines withevery generationElectricity intensity range (kWh/ GB) of networktransmission by access type100.0010.001.000.100.012G3G4G5G now5G futureSource: IEA, ING Economics Department. Please note the log scaleNetworks’ share in power use moves towards2.5% after efficiency gainsElectricity use with and without efficiency increase as %of total electricity consumption worldwide17.7% Without efficiencyimprovements1%20182.5% With efficiencyimprovements2030Source: ING Economics Department calculations, BNEFING Economics Department10 Further efficiency gains vital to limit electricity use of data November 2019
Introduction Conclusion Data and electricity explained Looking back Looking forward Implications Contents8 Data centres: Scaling and AI to boost energy efficiencyThe average size of DCs continues to increaseAI expected to further boost energy managementAt the moment DCs use about 1% of worldwide power.Without further reduction of electricity intensity, datagrowth would lead DCs to use 12% of global power by 2030.Supported by the move to the public cloud, hyperscale DCscontinue to increase their share in total DC capacity. Thisreduces the proportion of private, small-scale less efficientDCs and improves overall electricity efficiency.DCs will increasingly deploy artificial intelligence (AI)to autonomously handle various tasks such as serveroptimisation and equipment monitoring. AI will assistin reducing energy consumption by controlling coolingequipment and collecting sensor data to detect andsubsequently fix energy inefficiencies.6 A next step is to usemachine learning to optimise computer chips in servers.Hyperscale: much more efficientImpact of edge computing on energy use unclearHyperscale data centres – very efficient, large-scalecloud facilities – are very much focused on electricity use,not only for infrastructure (e.g. cooling) but also for ITequipment. They deploy specialised, more efficient serversand components, including through open source (e.g. OpenCompute).Abstraction to continueLarger scale DCs make use of virtualisation andcontainerisation. Virtualisation allows multiple virtualmachines (VM) to run isolated processes or applicationson a single server, sharing the underlying resources anddramatically increasing the utilisation rate. However, it stillrequires running heavyweight operating systems (OS),which draws on RAM, CPU and storage. Containerisationtechnologies enable multiple VMs to use the samelightweight OS. This drives a further reduction of energy use.Edge computing is about processing or storing critical datalocally with parts sent to central DCs. It’s important for IoT,where machines produce but also process vast amounts ofdata. As the impact on overall energy use is not clear yet andIoT devices are not in scope, the impact of edge computingon electricity use is not taken into account here.Altogether, innovations are estimated to lead to a yearly16% improvement of electricity intensity. This means that,despite strong data growth, the rise in the relative powerused by DCs will be limited, consuming 1.3% of worldwidepower in 2030.6 Google’s Deep Mind project realised a 40% gain in cooling energyconsumption.Efficiency gains at data centres mean rise inelectricity use is restrainedElectricity use with and without efficiency increase as %of total electricity consumption worldwide12% Without efficiencyimprovements1.3% With efficiencyimprovements0.8%20182030Source: ING Economics Department calculations, BNEFAssumptions and forecasts 2018-2030 The main driver of the improvement in electricity intensityis the shift towards large-scale, efficient DCs, with improvedequipment, cooling efficiency, storage and utilisation. This shiftleads to an approx. 20% decrease in electricity intensity earlyon, later slowing to around 10%. Energy management through AI contributes 5% per year todecreasing electricity intensity, starting in 2022.800 Other measures such as better UPS batteries, highertemperatures and reducing AC-to-DC conversion losses600contribute 1% per year.4002000ING Economics Department11 2014201520162017Further efficiency gains vital to limit electricity use of data November 2019
Introduction Conclusion Data and electricity explained Looking back Looking forward Implications Contents9 In 2030, 5% of global power is needed for data flowsData flows require 5% of global power in 2030The electricity needed for dataflows by devices, networksand data centres doubles between 2018 and 2030 toapproximately 1650 TWh. Over that period total worldwidepower demand is expected to rise by about a third, which isfor example due to electrification in transport and industry.This means by 2030 power demand by the tech and telcosector represents approximately 5% of worldwide electricityuse.Around 5% of global power needed for data flowsElectricity use as % of total electricity consumptionworldwide31% Without ks17%15%Data Centres25%16%Devices5%3%Innovations substantially limit
transmission technology and compression technology. Tech sector limits power use despite data growth The share of the technology and telco sector in total global electricity use is fairly stable at around 3%. So, despite the enormous increase in data flows, the sector has succeeded in limiting the rise in electricity demand by becoming more