Transcription
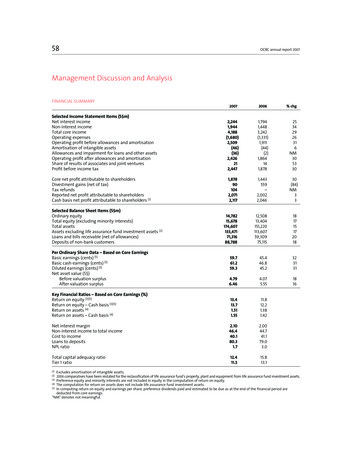
58OCBC annual report 2007Management Discussion and AnalysisFINANCIAL SUMMARYSelected Income Statement Items (S m)Net interest incomeNon-interest incomeTotal core incomeOperating expensesOperating profit before allowances and amortisationAmortisation of intangible assetsAllowances and impairment for loans and other assetsOperating profit after allowances and amortisationShare of results of associates and joint venturesProfit before income taxCore net profit attributable to shareholdersDivestment gains (net of tax)Tax refundsReported net profit attributable to shareholdersCash basis net profit attributable to shareholders (1)Selected Balance Sheet Items (S m)Ordinary equityTotal equity (excluding minority interests)Total assetsAssets excluding life assurance fund investment assets (2)Loans and bills receivable (net of allowances)Deposits of non-bank customers20072006% 2018Per Ordinary Share Data – Based on Core EarningsBasic earnings (cents) (5)Basic cash earnings (cents) (5)Diluted earnings (cents) (5)Net asset value (S )Before valuation surplusAfter valuation .551816Key Financial Ratios – Based on Core Earnings (%)Return on equity (3)(5)Return on equity – Cash basis (3)(5)Return on assets (4)Return on assets – Cash basis (4)13.413.71.511.5511.812.21.381.42Net interest marginNon-interest income to total incomeCost to incomeLoans to depositsNPL ratio2.1046.440.180.31.72.0044.741.179.03.0Total capital adequacy ratioTier 1 ratio12.411.515.813.1(1)Excludes amortisation of intangible assets.2006 comparatives have been restated for the reclassification of life assurance fund’s property, plant and equipment from life assurance fund investment assets.Preference equity and minority interests are not included in equity in the computation of return on equity.(4) The computation for return on assets does not include life assurance fund investment assets.(5) In computing return on equity and earnings per share, preference dividends paid and estimated to be due as at the end of the financial period arededucted from core earnings.“NM” denotes not meaningful.(2)(3)K5558 115952 OCBC AR P54-69.indd58 583/14/08 3:09:45 AM
OCBC annual report 200759Management Discussion and AnalysisGroup net profit attributable to shareholders (“net profit”) for the financial year ended 31 December 2007 increased by 3% toS 2,071 million, from S 2,002 million in 2006. Core net profit, which excludes gains from the divestment of non-core assetsand tax refunds, grew by 30% to S 1,878 million, driven by broad-based revenue growth across the Group’s key markets andsubsidiaries, particularly Great Eastern Holdings (“GEH”). Net interest income grew 25% and non-interest income rose 34%,while operating expenses increased 26%.Core earnings in 2007 exclude a S 90 million gain from the sale of an office property and S 104 million in tax refunds receivedduring the year. In 2006, divestment gains were significantly higher at S 559 million, derived from the sale of a residentialproperty as well as shareholdings in Robinson and Company Limited, The Straits Trading Company, Southern Bank Berhadand Raffles Holdings Limited.Return on equity, based on core earnings, improved from 11.8% in 2006 to 13.4% in 2007. The Group’s equity in the second halfof 2007 was boosted by about S 1 billion mark-to-market gain on its 10% stake in Bank of Ningbo, which was listed in July 2007.Excluding this effect, adjusted return on equity would have been higher at 13.8% for 2007. Core earnings per share for 2007grew by 32% to 59.7 cents.The Group’s net interest income grew 25% to S 2,244 million, supported by growth in interest earning assets and improvedinterest margins. Loans grew by 19%, contributed mainly by growth in corporate and SME loans in Singapore, Malaysia andother overseas markets. Housing loans in Singapore also picked up during the second half of the year. Net interest marginimproved from 2.00% to 2.10%, largely due to better margins in Singapore and Indonesia as the cost of funds fell faster thanasset yields.Non-interest income, excluding divestment gains, grew 34% to S 1,944 million, accounting for 46.4% of the Group’s corerevenue. Growth was driven by strong contributions from fee-based activities, higher profit from life assurance, as well ashigher gains from the sale of investment securities.Operating expenses increased by 26% to S 1,680 million in 2007. Approximately 41% of the expense increase was associatedwith the Group’s overseas business expansion, particularly in Indonesia and China, as well as business volume-related andperformance incentive compensation costs.The Group made total allowances of S 231 million for its investments in collateralised debt obligations (“CDOs”) in 2007.Allowances of S 226 million were made for the Bank’s investment in asset-backed securities (“ABS”) CDOs, reducing the carryingvalue of the portfolio by 85% to S 41 million as at end-2007. GEH provided an allowance of S 5 million for the CDOs investedunder its shareholders’ funds, reducing their carrying value to S 13 million as at end-2007. Loan recoveries, repayments, andupgrades resulted in a net write-back of S 108 million in specific allowances for loans. In addition, there was a net reversal ofS 87 million in allowances for other assets, mainly office properties in Singapore. As a result, the Group’s net allowances for theyear remained low at S 36 million, although this was higher than the S 2 million in 2006.Key subsidiaries of the Group reported healthy results for 2007. GEH achieved 15% increase in its net profit to S 547 million,underpinned by steady insurance underwriting results in Singapore and Malaysia, strong investment gains and increasedcontributions from Lion Capital Management. GEH contributed a significant S 449 million or 23.9% to the Group’s coreearnings, after deducting amortisation of intangible assets and minority interests.OCBC Bank (Malaysia) Berhad’s net profit rose 19% to RM512 million, led by growth in net interest income, Islamic Bankingincome and fees and commissions. Bank NISP’s net profit grew by 5% to IDR250 billion, as strong revenue growth was offsetto some extent by higher allowances and increased expenses related to its network and headcount expansion.The Board of Directors is recommending a final tax-exempt dividend of 14 cents per share, bringing the full year dividend to28 cents per share, up 22% from 23 cents in 2006 and representing a payout of 46% of the Group’s core earnings.K5558 115952 OCBC AR P54-69.indd59 593/14/08 3:09:46 AM
60OCBC annual report 2007Management Discussion and AnalysisNET INTEREST INCOMEAverage Balance Sheet20072006InterestS mAverageRate%AverageBalanceS mInterestS 955,2654.9389,8084,5165.03Interest bearing liabilitiesDeposits of non-bank customersDeposits and balances of banksOther borrowings 3.0184,5942,7223.222,2442.101,7942.00Interest earning assetsLoans and advances to non-bank customersPlacements with and loans to banksOther interest earning assets (1)TotalAverageBalanceS mNet interest income/margin (3)(1)(2)(3)Comprise corporate debt securities and government securities.Comprise mainly debts issued, including Tier 2 subordinated debt.Net interest margin is net interest income as a percentage of interest earning assets.Net interest income grew 25% to S 2,244 million, supported by growth in interest earning assets and improved interest margins.Average interest earning assets grew 19% as loans, interbank placements and securities increased. Net interest margin improvedfrom 2.00% in 2006 to 2.10% in 2007, largely due to better margins in Singapore and Indonesia where the cost of funds fell fasterthan asset yields.Volume and Rate AnalysisIncrease/(decrease) for 2007 over 2006VolumeS mRateS mNet changeS mInterest incomeLoans and advances to non-bank customersPlacements with and loans to banksOther interest earning nterest expenseDeposits of non-bank customersDeposits and balances of banksOther Net interest income337113450K5558 115952 OCBC AR P54-69.indd60 603/14/08 3:09:46 AM
61OCBC annual report 2007Management Discussion and AnalysisNON-INTEREST INCOME2007S m2006S m /(-)%Fees and commissionsBrokerageWealth managementFund managementCredit cardLoan-relatedTrade-related and remittancesGuaranteesInvestment bankingService dendsRental incomeProfit from life assurancePremium income from general insurance556250965777837659(28)(20)359Other incomeNet dealing income:Foreign exchangeSecurities and derivativesNet gains from investment securitiesNet gains from disposal of propertiesNet loss from disposal of 2,0362,04519.3%46.4%18.4%44.7%Total core non-interest incomeDivestment gainsTotal non-interest incomeFees and commissions/Total income (1)Non-interest income/Total income (1)(1)–Excludes divestment gains.Non-interest income, excluding divestment gains, grew 34% to S 1,944 million in 2007. The robust growth was driven by strongcontributions from fee-based activities, higher profit from life assurance, as well as higher gains from the sale of investment securities.Fees and commissions rose 35% to S 808 million in 2007, with the increase led by stock-broking, wealth management, loan-relatedand trade-related activities. Profit from life assurance was 35% higher, due mainly to healthy underwriting results in Singaporeand Malaysia and strong investment gains. Foreign exchange income rose 29% to S 186 million, while net gains from investmentsecurities increased from S 46 million to S 202 million. Securities and derivatives dealing registered a net loss of S 12 million in 2007,attributable to mark-to-market losses of S 18 million on credit default swaps linked to the Bank’s synthetic corporate CDO portfolio.Non-interest income accounted for 46.4% of the Group’s total core income in 2007, compared to 44.7% in 2006.K5558 115952 OCBC AR P54-69.indd61 613/14/08 3:09:46 AM
62OCBC annual report 2007Management Discussion and AnalysisOPERATING EXPENSES2007S m2006S m /(-)%Staff costs94672231Property and equipmentDepreciationMaintenance and hireRental her operating expenses43333230Total operating expenses1,6801,33126Group staff strengthPeriod endAverage18,67617,43115,85815,2701814Cost to income ratio (1)40.1%41.1%(1)Excludes divestment gains from income.Operating expenses increased by 26% to S 1,680 million in 2007. Approximately 41% of the expense increase was associatedwith the Group’s overseas business expansion, particularly in Indonesia and China, as well as business volume-related andperformance incentive compensation costs.Total staff costs rose 31% to S 946 million in 2007, due to higher base salaries, increased bonus accruals in tandem with the Group’sbetter performance, and increased headcount. Group headcount rose 18% year-on-year, with more than 80% of the increaseoccurring in overseas markets, including Malaysia, Indonesia and China. During the year, Bank NISP opened 93 additional branchesand offices in Indonesia, while the Group’s locally-incorporated banking subsidiary in China commenced operations.Premises and equipment costs increased 9% to S 301 million, due mainly to higher IT hardware and software costs and premisesrental costs. Other operating expenses rose 30% to S 433 million, contributed by increases in business promotion expenses,volume-related brokerage and processing fees, and legal and professional fees. Business promotion expenses increased asthe Group embarked on several thematic and service improvement projects such as the “Q” advertising campaign, credit cardpromotions and Sunday Banking.As revenue growth of 29% exceeded expenses increase of 26%, the cost-to-income ratio for 2007 fell slightly to 40.1%, from 41.1% in 2006.ALLOWANCES FOR LOANS AND OTHER ASSETS2007S mSpecific allowances/(write-back) for loansSingaporeMalaysiaOthers2006S m nces for CDOs231–NMAllowances and impairment charges/(write-back) for other assets(87)(19)363Net allowances and impairment362NM# Amount less than S 0.5 million.K5558 115952 OCBC AR P54-69.indd62 623/14/08 3:09:46 AM
63OCBC annual report 2007Management Discussion and AnalysisALLOWANCES FOR LOANS AND OTHER ASSETS (CONTINUED)The Group made total allowances of S 231 million for its investments in CDOs in 2007, of which S 221 million were taken inthe third quarter and S 10 million in the fourth quarter. Allowances of S 226 million (US 153 million) were made for the Bank’sUS 181 million investment in ABS CDOs, which have some exposure to US sub-prime mortgage assets. The carrying value of theABS CDO portfolio was reduced by 85% to S 41 million (US 28 million) as at end-2007. In addition, GEH made an allowance ofS 5 million for the CDOs invested under its shareholders’ funds, reducing their carrying value to S 13 million as at end-2007.Loan recoveries, repayments, and upgrades resulted in a net write-back of S 108 million in specific allowances for loans. Inaddition, there was a net reversal of S 87 million in allowances for other assets, mainly office properties in Singapore. As aresult, net allowances for the year were S 36 million, compared to S 2 million in 2006.LOANS AND ADVANCESBy IndustryAgriculture, mining and quarryingManufacturingBuilding and constructionHousing loansGeneral commerceTransport, storage and communicationFinancial institutions, investment and holding companiesProfessionals and individualsOthersBy CurrencySingapore DollarUnited States DollarMalaysian RinggitIndonesian RupiahOthersBy Geographical Sector (1)SingaporeMalaysiaOther ASEANGreater ChinaOther Asia PacificRest of the World(1)2007S m2006S m 73,1031,8662,5191516196565872,77561,13219Loans by geographical sector are based on where the credit risks reside, regardless of where the transactions are booked.The Group’s loan book increased by 19% to S 72.8 billion as at 31 December 2007, boosted by growth in corporate and SME loansin Singapore, Malaysia and overseas markets. Housing loans in Singapore also picked up during the second half of the year. Byindustry, the increase in loans was broad-based, with the largest increases derived from the building and construction, nonbank financial institutions and investment holding companies, transport and communication and manufacturing sectors.K5558 115952 OCBC AR P54-69.indd63 633/14/08 3:09:46 AM
64OCBC annual report 2007Management Discussion and AnalysisNON-PERFORMING LOANSNPLs by Grading and GeographyTotalNPLs (1)S mSubstandardNPLsS mDoubtfulNPLsS mLossNPLsS mSecuredNPLs as % oftotal NPLs%Non-bankNPLs as % ofnon-bank 58331239260.957.31.73.0(1)(2)(3)Comprises non-bank loans, debt securities and contingent facilities.Excludes debt securities.Include CDOs of S 86 million.The Group’s asset quality continued to improve. As at 31 December 2007, total non-performing loans (“NPLs”) were S 1.35 billion,down 26% from 31 December 2006. Singapore NPLs amounted to S 0.51 billion, while Malaysia NPLs were S 0.55 billion. Theseaccounted for 38% and 40% of total NPLs respectively. Of the total NPLs, 44% were in the substandard category while 61% weresecured by collateral.The Group’s NPL ratio was 1.7% in December 2007, an improvement over 3.0% in December 2006.NPLs by IndustryLoans and advancesAgriculture, mining and quarryingManufacturingBuilding and constructionHousing loansGeneral commerceTransport, storage and communicationFinancial institutions, investment and holding companiesProfessionals and individualsOthersSub-totalDebt securitiesS m2007% of grossloansS m2006% of .81.83.41.81,2381161.71,804253.01,354K5558 115952 OCBC AR P54-69.indd64 641,8293/14/08 3:09:47 AM
65OCBC annual report 2007Management Discussion and AnalysisCUMULATIVE ALLOWANCES FOR LOANSPortfolioallowancesS mSpecificallowancesas % oftotal NPLs%Cumulativeallowancesas % oftotal S mSpecificallowancesS des allowances of S 82 million for classified CDOs.As at 31 December 2007, the Group’s total cumulative allowances for loans amounted to S 1.57 billion, comprising S 0.61 billionin specific allowances, and S 0.96 billion in portfolio allowances. The cumulative specific allowances included S 82 million inallowances for classified CDOs. Total cumulative allowances were 116.1% of total NPLs at 31 December 2007, higher than thecoverage of 100.9% at 31 December 2006.K5558 115952 OCBC AR P54-69.indd65 653/14/08 3:09:47 AM
66OCBC annual report 2007Management Discussion and AnalysisDEPOSITS2007S m2006S mDeposits of non-bank customersDeposits and balances of banks88,78814,72675,11511,8691824Total deposits103,51486,98419Non-Bank Deposits By ProductFixed depositsSavings depositsCurrent 78875,1151880.3%79.0%Non-Bank Deposits By CurrencySingapore DollarUnited States DollarMalaysian RinggitIndonesian RupiahOthersLoans to deposits ratio (net non-bank loans/non-bank deposits) /(-)%As at 31 December 2007, total deposits were S 103.5 billion, an increase of 19% year-on-year. Non-bank customer deposits grewby 18% to S 88.8 billion, with increases of 17% in fixed deposits, 16% in savings deposits, and 25% in current account deposits.Deposits and balances of banks grew by 24% to S 14.7 billion.The Group’s loans to deposits ratio was 80.3% at 31 December 2007, higher than the 79.0% in December 2006.K5558 115952 OCBC AR P54-69.indd66 663/14/08 3:09:47 AM
67OCBC annual report 2007Management Discussion and AnalysisPERFORMANCE BY BUSINESS SEGMENTOCBC Group’s businesses are presented in the following customer and product segments: Consumer Banking, Business Banking,Treasury and Insurance.Revenue and Operating Profit by Business Segment2007S mTotal Income2006S m /(-)%Consumer BankingBusiness BankingTreasuryInsurance (1)Others 3Group (1) (2)4,1883,24229(1)(2)Operating Profit afterallowances and amortisation20072006S mS m 32)1,86430Excludes pre-tax divestment gains of S 53 million for 2006.Excludes pre-tax divestment gains of S 92 million for 2007 and S 545 million for 2006.Consumer BankingConsumer Banking comprises the full range of products and services offered to individuals, including deposit products (checkingaccounts, savings and fixed deposits), consumer loans (housing loans and other personal loans), credit cards and wealthmanagement products (unit trusts, bancassurance products and structured deposits).For 2007, operating profit of the consumer segment increased 32% to S 631 million. The broad-based revenue growth in netinterest income and fee income, coupled with lower loan allowances, more than offset the growth in expenses.Business BankingBusiness Banking provides a full range of financial services to business customers, ranging from large corporates and the publicsector to small and medium enterprises. The products and services offered include long-term loans such as project financing,short-term credit such as overdrafts and trade financing, deposit accounts and fee-based services such as cash management,trustee and custodian services.Business Banking’s operating profit grew by 27% to S 998 million in 2007. The improved performance was driven by increasein net interest income due to strong loans and deposits growth, higher fee income, as well as higher recoveries from nonperforming assets, partly offset by higher expenses.TreasuryTreasury engages in foreign exchange activities, money market operations, fixed income and derivatives trading, and also offersstructured treasury products and financial solutions to meet customers’ investment and hedging needs.Treasury’s operating profit rose 77% to S 313 million in 2007. The strong profit growth was driven by significantly higher net interestincome and foreign exchange gains, partly offset by lower gains from dealing in securities and derivatives, and higher expenses.InsuranceThe Group’s insurance business, including its fund management activities, is carried out by 86.9%-owned subsidiary GEH, whichprovides both life and general insurance products to its customers mainly in Singapore and Malaysia.For 2007, operating profit from GEH increased 38% to S 636 million, driven by higher insurance income and gains from investmentsecurities. After amortisation of intangible assets, minority interests and tax, GEH’s contribution to Group net profit was S 449million in 2007, an increase of 26% from S 357 million in 2006.OthersThe “Others” segment comprises Bank NISP, corporate finance, capital markets, property holding, stock brokerage andinvestment holding, support units, other investments and items not attributed to business segments.K5558 115952 OCBC AR P54-69.indd67 673/14/08 3:09:47 AM
68OCBC annual report 2007Management Discussion and AnalysisPERFORMANCE BY GEOGRAPHYTotal core incomeSingapore (1)MalaysiaOther ASEANAsia PacificRest of the WorldProfit before income taxSingapore (1)MalaysiaOther ASEANAsia PacificRest of the WorldTotal assetsSingaporeMalaysiaOther ASEANAsia PacificRest of the World(1)2007S m%2006S 100151,220100Excludes pre-tax divestment gains of S 92 million for 2007 and S 598 million for 2006.The geographical segment analysis is based on the location where the assets or transactions are booked. For 2007, Singaporeaccounted for 65% of total income and 70% of pre-tax profit, while Malaysia accounted for 23% of both total income and pre-taxprofit. The 2007 pre-tax profit for Malaysia include the impact of allowances of S 117 million for the CDOs booked in Labuan. Ifthe S 117 million allowances are classified under Singapore, the adjusted pre-tax contribution of Singapore and Malaysia wouldbe 65% and 27% respectively.K5558 115952 OCBC AR P54-69.indd68 683/14/08 3:09:47 AM
69OCBC annual report 2007Management Discussion and AnalysisCAPITAL ADEQUACY RATIO2007S m2006S 2,4262477043,1122053,3864,021225–3,6114,021Tier 1 and Tier 2 Capital15,04114,078Capital investments in insurance 105Risk weighted assets including marketing risk99,38176,514Tier 1 ratioTotal capital adequacy ratio11.5%12.4%13.1%15.8%Tier 1 CapitalPaid-up ordinary and preference sharesDisclosed reserves/othersGoodwill/othersUpper Tier 2 CapitalCumulative portfolio allowancesSubordinated term notesRevaluation surplus on equity securitiesLower Tier 2 CapitalTier 2 CapitalEligible Total CapitalThe Group’s total capital adequacy ratio (“CAR”) was 12.4% and Tier 1 CAR was 11.5% in December 2007, down from 15.8% and13.1% respectively, in December 2006. The declines were mainly due to the strong growth in risk weighted assets. In addition,total CAR was impacted by the annual amortisation of the Bank’s Tier 2 subordinated debt issued in 2001. The Group raisedadditional S 225 million of Lower Tier 2 capital during the year.In 2007, the Bank bought back approximately 5.0 million of its ordinary shares for S 43 million. Shares bought back are held astreasury shares. Under the third S 500 million share buyback programme which commenced in June 2006, S 269 million hadbeen utilised as at end-2007.VALUATION SURPLUS2007S m2006S mProperties (1)Equity securities es properties classified as investment properties and assets held for sale.Comprises investments in associates and quoted subsidiaries.The Group’s unrealised valuation surplus amounted to S 5.17 billion as at 31 December 2007, an increase of 13% compared to31 December 2006. The surplus for properties amounted to S 2.51 billion, up significantly from S 1.60 billion at end-2006 duemainly to the increase in property values in Singapore. The surplus of S 2.65 billion for equity securities was primarily fromthe Group’s holding of GEH shares.K5558 115952 OCBC AR P54-69.indd69 693/14/08 3:09:48 AM
Securities and derivatives (12) 1 NM Net gains from investment securities 202 46 343 Net gains from disposal of properties 5 8 (41) Net loss from disposal of subsidiaries - (6) NM Others 63 67 (6) Sub-total 444 260 71 Total core non-interest income 1,944 1,448 34 Divestment gains 92 598 (85) Total non-interest income 2,036 2,045 -
