Transcription
Running head: TEACHING VITAL SIGNS ASSESSMENTSaving Lives: Teaching Vital Signs Assessment to Radiography StudentsKimberly K. Suwa, R.T.(R)University of Hawaii at ManoaUSAsuwak@hawaii.eduAbstract: Early recognition of possible medical emergencies leads toquick intervention, potentially saving lives. Radiographers (x-ray techs)are often the only healthcare professionals present during an imaging examand must be able to accurately assess vital signs readings in order todetermine the need for medical response. The only radiography programin Hawaii had no formal method for teaching this important skill; therefore,an online vital signs assessment module was created to address this issue.The successful implementation of the Saving Lives: Learning Vital SignsAssessment website lead to the conversion of the module into a completecourse hosted by the NEO learning management system (LMS). JohnKeller’s ARCS Model of Motivational Design was used as the theoreticalfoundation for the new Saving Lives course, since literature reviewedsupported application of this framework for online instruction. Attentionand relevance were gained through presentation of medical scenarios.Confidence and satisfaction were boosted by the immediate feedback thatthe NEO LMS provided. The Saving Lives course was evaluated early inthe Spring semester, using one-on-one interviews conducted with a contentmatter expert and a website design expert. Suggested changes to themodule were made, and small group implementation was conducted.Thirteen first-year radiography students worked independently on theinstructional module for one week. Results demonstrated an overallimprovement between pre- and post-test scores and positive reception ofthe online instructional module. This study supports the effectiveness of elearning in the healthcare field when teaching practical skills such as vitalsigns assessment.IntroductionRadiographers, more commonly known as x-ray techs, are healthcare professionals whospecialize in the area of diagnostic imaging. All radiographers in the state of Hawaii arerequired to go through training in a formal education program and pass the national1
TEACHING VITAL SIGNS ASSESSMENT2certification examination administered by the American Registry of RadiologicTechnologists (ARRT). The ARRT Certification Handbook (2013) states that one of thecontent specifications that radiography students must learn while in their program ispatient care.Learning proper vital signs assessment is an important part of administering effectivepatient care. The radiographer is usually the only healthcare professional present duringthe examination of a patient. The safety and well-being of that patient depends on theability of the technologist to recognize the need for a medical response. Accuratelyassessing deterioration in a patient’s condition will prompt early intervention and mayhelp to prevent a life-threatening emergency (Ehrlich & Coakes, 2013).There is currently no formal method for teaching this skill within the only radiographyprogram in the state. In previous years, the students reviewed pertinent chapters in theirpatient care textbook on their own, then participated in a laboratory session where theypracticed their skills. This method proved ineffective for certain students, as theyexperienced a difficult time assimilating the knowledge from the textbook withoutinstruction or feedback of any kind. It took these students longer to achieve proficiency intaking vital signs readings, and their skill level in vital signs assessment was notmeasured at all.In an effort to remedy this situation, an online module for teaching vital signs assessmentwas created during the ETEC 613 Instructional Design and Development course in theSpring semester of 2014. The results of the initial Saving Lives: Learning Vital SignsAssessment module implementation were promising, with students displayingimprovement between pre- and post-test scores and responding positively when surveyedon this new means of instruction. However, there were certain weaknesses inherent inutilizing an open website as a platform for an educational module. As a result, theexisting module was revised and improved to address these issues and better suit thestudents’ needs.It is the responsibility of Hawaii’s only radiologic technology program to ensure that allstudents receive an exemplary education in the content specified by the ARRT.Educational technology can serve to bridge this gap, as it is widely being used to preparestudents for the healthcare industry, and can help students who have grown up usingtechnology to stay “engaged and focused” in the topic at hand (Bristol & Kyarsgaard,2012). The purpose of this instructional design project was to improve and evaluate anonline interactive module for teaching vital signs assessment to first-year radiographystudents at a community college in Honolulu, Hawaii.
TEACHING VITAL SIGNS ASSESSMENT3Literature ReviewThe ability to perform basic vital signs assessment is an essential skill for radiographers,who have the responsibility to intervene when potential emergency situations arise. Theradiographer is often the initial observer of any changes in the patient’s condition, andshould be trained to recognize signs of deterioration (Ehrlich & Coakes, 2013).Radiography students should be taught basic assessment skills such as using the properequipment to obtain vital signs, appropriately interpreting those readings, documentingother physical signs and symptoms, and analyzing that data (ARRT, 2013). These criticalthinking skills should be imparted to students while they are still in a safe and controlledlearning environment, to prevent exposing patients to the potential risk of adverse effectsdue to their inexperience (Lewis, Strachan, & Smith, 2012).The accurate interpretation of vital signs is of particular importance. Occasionally,changes in body position can affect vital signs such as heart rate or blood pressure andmay be mistaken for illness (Emergency Nurses Association, 2011). Students inhealthcare should learn to correctly assess a situation so that an appropriate response canbe performed, as physical deterioration often precedes dangerous or potentially fatalevents such as a heart attack (Liaw, Scherpbier, Klainin-Yobas, & Rethans, 2011). In astudy done by the Wake University School of Medicine on the predictive value ofabnormal vital signs for risk of death, researchers found that the presence of three“critically abnormal” vital signs was associated with a patient mortality rate of 23.6%(Bleyer, Vidya, Russell, Jones, Sujata, Daeihagh, & Hire, 2011). Disturbances in multiplevital signs are common in patients with severe illness, as they may exhibit eitherextremely high or very low respiratory rates, body temperatures, pulse rates, or bloodpressures. Early detection of these disturbances can lead to a faster response and improvethe outcome for these patients with acute illness (Royal College of Physicians, 2012).As teaching important skills such as vital signs assessment can be a challenge forinstructors in medical fields, the incorporation of educational technology into traditionalinstruction is one solution that can help prepare students for their entry into the healthcareindustry (Bristol & Kyarsgaard, 2012). Millennial learners expect e-learning as part oftheir education, and are progressively utilizing more technology as educational tools(Bahner, Adkins, Patel, Donley, Nagel, & Kman, 2012). E-learning is an effective way tomanage potentially limited resources in education, allowing for students to move at theirown pace and self-identify areas which require further study (Thomson, Campbell, &O’Leary, 2011). Multimedia items such as video demonstrations or animations canpresent complex concepts in a more efficient manner by replacing or supplementing textwith visual representations in motion, enhancing engagement and relevance to the learner(Yue, Kim, Ogawa, Stark, & Kim, 2013).
TEACHING VITAL SIGNS ASSESSMENT4Utilization of an online format for teaching health assessment has proven to besuccessful. In a study conducted at the Boston University School of Medicine, onlinemodules were used to teach delirium assessment to fourth-year medical students. Thosestudents who used the online modules performed better than their counterparts incorrectly identifying the problem and coming up with appropriate treatments (Chao,Brett, Wiecha, Norton, & Levine 2012). Online modules in pharmacy practice skills,including vital signs assessment, were also implemented by the University of MissouriKansas City School of Pharmacy. This two year study included 190 students, andrevealed significant improvement between pre- and post-test scores for students. 85% ofstudents were able to apply what they learned in the patient care setting (Ruehter,Lindsey, Graham, & Garavalia, 2012).Designing instruction in an online format requires specific issues to be kept in mind, asthere are new aspects of teaching and learning involved in these environments (Hess &Gunter, 2013). In order to effectively teach with technology, educators must align thecontent to be taught with an appropriate method of teaching and determine the besttechnology with which to accomplish that aim (Voogt, Fisser, Pareja-Roblin, Tondeur, &van Braak, 2012). According to Mayer’s cognitive theory of multimedia learning, it isalso important to keep in mind that learners have limited cognitive capacity in their visualand pictorial information processing channels; therefore, an effort should be made toprevent overloading them during learning. Too much extraneous cognitive processing canoverload the channels, so irrelevant information or distracting images and sounds shouldbe avoided (Mayer, 2010). Learners should be allowed to progress at their own pace so asnot to overwhelm their essential cognitive processing, and complex subject matter suchas that found in the medical field should be delivered in smaller chunks (Mayer, 2010;Kulasekara, Javatilleke, & Coomaraswamy, 2011).Allowing students to learn at their own pace promotes intrinsic motivation towardslearning and encourages problem solving and active application of knowledge (Fang &Strobel, 2011). Independent problem solving skills can also be developed throughproviding students with challenging scenarios, teaching them how to adapt to newsituations in order to effectively deal with a continuously changing environment such asthe healthcare setting (Valijataga & Laanpere, 2010). Incorporating self-assessmentquestions into the module can provide valuable and immediate feedback to students(Kulasekara et al., 2011). When designing online modules, it is important to consider elearning visual design principles as well. An unattractive look or feel can detract from thecontent and deter users from continuing onward (Foster, Shurtz, & Pepper, 2014).
TEACHING VITAL SIGNS ASSESSMENT5Project DesignThe initial Saving Lives learning module was constructed in Weebly, and assessmentswere created by embedding Google Forms within the website. The Weebly websitebuilder allowed for beautiful page design, and was easy to work with. Unfortunately, itwas lacking in specific features necessary to make for an effective educational tool. Asthe website was open and available to anyone who had the link, there was a potential foroutsiders who were not enrolled in the course to fill out the Google Forms andcontaminate the assessment data. Students had the ability to move through the varioussections in random order, and navigation through the site was somewhat confusing. Also,students could not review their responses for the embedded practice exams once theGoogle Forms were submitted, so the information on the feedback pages was not asrelevant or helpful as it should have been.When considering improvements to resolve these issues, the principal investigatordecided to retain an online format for the instructional module, as the literature stronglysupports online methods of learning for this generation of college students (Bahner et al.,2012). The literature reviewed also indicated that this student population prefers theirinformation to be delivered in smaller portions (Kulasekara et al., 2011), so the originalcontent of the module remained organized into the same concise sections when movedinto the new platform. The educational content of the revised module was based on thefollowing instructional goals.Instructional GoalsThe first instructional goal for the module was to instruct radiologic technology studentson how to correctly perform vital signs assessments. Students were given the appropriatetechniques for obtaining vital sign measurements, as well as information on how to assessthose measurements. Relevant images, including those of the proper equipment for takingvital signs, were placed in the appropriate sections of the module to complement the text(Mayer, 2010).The second instructional focus for this module was to teach students the normal andabnormal ranges for the four vital signs of body temperature, pulse rate, respiration rate,and blood pressure. The sections were reorganized in a different order from the originalmodule, sequencing the content from the easiest concepts to the more complex (Dick,Carey, and Carey, 2009). Embedded tests could be accessed multiple times in order toserve as self-assessments for students to obtain immediate and valuable feedback on theirprogress (Kulasekara et al., 2011).
TEACHING VITAL SIGNS ASSESSMENT6The final and most crucial instructional goal was to instruct students on how to applytheir knowledge and problem-solving skills to correctly evaluate various medicalscenarios. This module provided complex scenarios during which a patient’s vital signsmeasurements and other pertinent information were revealed. These challengingscenarios were designed to promote the development of adaptation and independentproblem solving skills in the healthcare setting (Valijataga & Laanpere, 2010).PlatformAs the original module was constructed in a Weebly website, various educationalcomponents such as testing and grading were not inherent in the system. It wasdetermined that a learning management system (LMS) would be the best choice forconstructing an instructional module for use in a formal educational program. The LMSplatform selected for this instructional module was NEO, formerly known as EDU 2.0.Information on the NEO LMS can be accessed at https://www.neolms.com. NEO is asecure system, so students need to be either enrolled by the instructor or given an accesscode in order to view the module and take the assessments. This addressed the securityvulnerability inherent in openly accessible website builders such as Weebly. The userinterface, although not customizable to the extent of Weebly, was much more userfriendly and visually appealing than other learning management systems such as Laulimaor Canvas (Appendix A). Visual items such as tables, images, emoticons and even videocould be embedded directly into the lesson page (Appendix B). Maintaining aestheticappeal was important, so as not to detract from the content or deter users from utilizingthe module (Foster, Shurtz, & Pepper, 2014).NEO also allowed for setting up “gateways” so that students could not progress to thenext section until they had completed and mastered the previous one. This remedied theproblem of having an instructional module set up in a website where students could freelynavigate to any page they wish to. The embedded tests served as “gatekeepers,” as theywere set to only allow progression to the next section after a specific benchmark had beenattained by the student (Appendix C). Students needed to demonstrate understanding ofthe easier concepts first, before being allowed to move on to the more complex orunfamiliar ones (Dick et al, 2009).The assessments within NEO were also fully customizable, with options to includeimages and personalize the feedback students received when reviewing their exam results(Appendix D). After completing the embedded tests, students could view their responsesto the questions and compare them to the correct answers via this feedback section. This
TEACHING VITAL SIGNS ASSESSMENT7increased the relevancy of the practice exams and allowed the students self-assess theirproficiency or any areas of weakness (Thomson, Campbell, & O’Leary, 2011).FrameworkThis project was based on John Keller’s ARCS Model of Motivational Design (Keller &Deimann, 2012). This theoretical framework was chosen because it best fit instructionaldesign in an online format. The learner’s attention was gained via perceptual arousalthrough the use of different information presentation methods such as images and text.Attention was also gained through inquiry arousal by posing various scenarios that thestudent were required to correctly evaluate (Appendix E).The relevance of the material being learned was reinforced in the introduction to themodule (Appendix F). Awareness of the present and future value of the skills that theywill be learning leads to intrinsic motivation to learn this required material. Clear learningobjectives at the top of each lesson page ensured that students understood theperformance requirements and evaluation criteria used to measure their success inlearning the skills presented (Appendix B). As each section of the module wascompleted, the feedback received from their performance on the embedded tests served toboost the learner’s confidence (Appendix D).This immediate feedback provided also served to address the satisfaction component ofthe ARCS model. Students can take pride in improving their performance in a skill thatmost of them are not familiar with. This factor of satisfaction will also be reinforcedwhen students are given the opportunity to practice their new vital signs assessment skillsin the laboratory setting later in the semester.MethodsResearch QuestionsThis project was driven by two major research questions. The first was to determine if thecontent presented was appropriate and sufficient for achieving the instructional goals ofthis module. The second was to determine if the methods of information delivery andinstruction were effective for this specific student population. It was anticipated thatsmall group testing with the target group of radiography students would reveal asignificant increase in their post-test scores as compared to their pre-test scores aftercompletion of the instructional module.
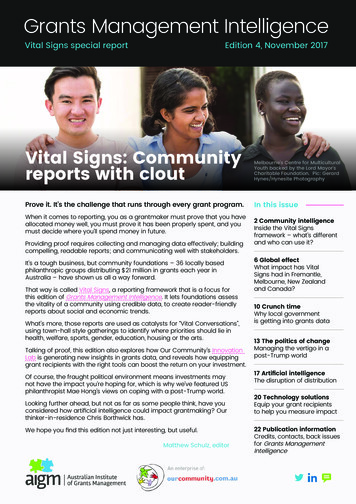
TEACHING VITAL SIGNS ASSESSMENT8Participants: One-on-One InterviewsA content matter expert and a website design expert were asked to review theinstructional module. The content matter expert was a professor in the radiographydepartment of a local community college who had been in the field for over 30 years.This content matter expert had reviewed the previous iteration of this project, and was agreat asset in maintaining the continuity of the formative assessment. The website designexpert was an advertising consultant who specialized in digital media art.Participants: Small Group TestingThe small group testing subjects for this study were 13 first-year students enrolled in aradiography program at a community college in Honolulu, Hawaii. These students rangedin age from 19 to 43 years of age, with an average class age of 26. There were 7 femalesand 6 males, so each gender was fairly evenly represented. The ethnicity of the studentswas predominantly Asian, with three Caucasian students. Previous medical experiencefor these students varied from five months to one year, with the majority of theirexperience coming from having spent the previous fall semester as a student in theradiography program. Most of the participants stated that they have previous experiencewith online courses, and the majority were very comfortable with using technology. (SeeFigure 1.) This corresponds with the information provided by the literature review, whichpoints to online learning as an appropriate means of instruction for students in the“Millenials” generation (Bahner et al., 2012).Figure 1. Small group participant demographics.
TEACHING VITAL SIGNS ASSESSMENT9ProceduresTo increase the efficiency of this instructional design module, extensive formative testingwas performed to identify potential issues as early as possible (Roytek, 2010). One-onone feedback sessions with a content matter expert and a website design expert wereconducted in the beginning of the study. A two-hour interview with the content matterexpert involved working through each section of the module while sitting together at thesame computer, reviewing the content portions line by line. A one-hour interview wasconducted with the website design expert in the same manner, with a focus on theaesthetics of the module. Notes taken during both of these sessions were compiled andanalyzed for possible points of improvement (Dick et al, 2009). Identified necessaryrevisions to the module were completed prior to small group implementation.The first-year Radiologic Technology program students were contacted as a group duringthe first week of Spring Semester. In the recruitment email sent to them (Appendix G),the purpose of the study was explained, the benefits and risks discussed, and contactinformation provided should they require more clarification on any points of the project.Consent to participate in the study was implied upon completion of the module. The linkto the demographic survey (Appendix H) was emailed to all participants prior to smallgroup implementation. This survey was administered via Google Forms and containedquestions regarding age, gender, ethnicity, patient care experience, previous experiencewith online courses, and comfort level with using technology. The results of that surveyare seen in Figure 1 above.Small group testing commenced after revisions to the module were completed. Studyparticipants were enrolled in the NEO LMS by the primary investigator and emailed alink to the online module. The students were given a week to work through the onlinemodule independently. The small group testing participants worked through a pre-test atthe beginning of the module to assess their prior level of knowledge regarding vital signsassessment. Each section of the module contained embedded tests, which the studentscould repeatedly take as practice exams to solidify their retention and comprehension.Finally, the students took a post-test to assess their knowledge acquisition. (See AppendixE for examples of the pre-test, embedded test, and post-test questions.)After the students had completed the instructional module, the link to a post-courseattitudinal survey was emailed to all participants to evaluate their perception of theinstructional module (Appendix I). This survey was administered via Google Forms andcontained questions which assessed their views on the adequacy of the content, theeffectiveness of the method of delivery, and the quality of the practice exercises andfeedback. The survey utilized a five-point Likert scale with a continuum from “Strongly
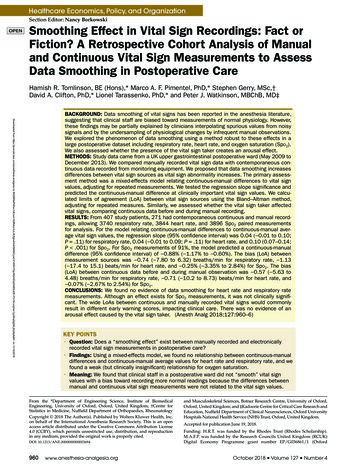
TEACHING VITAL SIGNS ASSESSMENT10Agree” to “Strongly Disagree”. Two open-ended questions at the end also allowed forspecific feedback regarding any areas of improvement to the content or aesthetics of themodule.ResultsData was collected from the NEO LMS following small group testing. Individual scoresfrom the pre-tests and post-tests were first grouped by test item number and divided bythe total number of participants to obtain the percentage of correct responses per test item(Dick et al, 2009). Each test item corresponds to a specific learning objective for thechapter (Appendix E). Figure 2 below displays student performance by test item for Unit1 - Body Temperature, Unit 2 - Pulse Rate, Unit 3 – Respiration Rate, Unit 4 – BloodPressure, and Unit 5 – Vital Signs Assessment.Student Performance Per Test Item100%93%93% 93%86%90%Percentage of Correct est Item NumberPre-TestPost-TestFigure 2. Student performance by test item for Units 1-5.Test item 1.1 tested knowledge of normal body temperature range, and displayed anincrease in percentage of correct responses from 71% in the pre-test to 93% in the posttest. Test item 1.2 tested knowledge of abnormal body temperature range, and alsodisplayed an increase in percentage of correct responses by the test subjects from 71% inthe pre-test to 93% in the post-test. Test item 1.3 posed a brief scenario for knowledge
TEACHING VITAL SIGNS ASSESSMENT11application regarding normal versus abnormal body temperature range. This itemdemonstrated an unexpected decrease in percentage of correct responses, from 93% in thepre-test to 71% in the post-test. These results, as well as other data gathered for thisstudy, will be further examined in the Discussion section.Test item 2.1 assessed knowledge of normal pulse rate range, and displayed a largeincrease in percentage of correct responses from 50% in the pre-test to 86% in the posttest. Test item 2.2 tested knowledge of abnormal pulse rate range, and displayed a smallerincrease in percentage of correct responses from 71% in the pre-test to 93% in the posttest. Test item 2.3 posed another brief scenario for knowledge application regardingnormal versus abnormal pulse rate range. This test item demonstrated a drastic increase inthe percentage of correct responses, from 23% in the pre-test to 86% in the post-test.Test item 3.1 gauged knowledge of normal respiration rate range, and demonstrated anincrease in percentage of correct responses from 64% in the pre-test to 93% in the posttest. Test item 3.2 tested knowledge of abnormal respiration rate range, and showed alarge increase in percentage of correct responses from 43% in the pre-test to 93% in thepost-test. Test item 3.3 posed a scenario to test the participant’s ability to apply their newknowledge when evaluating normal versus abnormal respiration rate range. This test itemdemonstrated another large increase in performance, from 50% correct responses in thepre-test to 93% correct responses in the post-test.Test item 4.1 tested knowledge of normal blood pressure range, and demonstrated a smallincrease in percentage of correct responses from 86% in the pre-test to 93% in the posttest. Test item 4.2 tested knowledge of abnormal blood pressure range, and demonstratedanother small increase in percentage of correct responses from 86% in the pre-test to 93%in the post-test. Test item 4.3 evaluated knowledge application ability with a scenarioregarding normal versus abnormal blood pressure range. This test item displayed anincrease in percentage of correct responses, from 64% in the pre-test to 93% in the posttest.Unit 5 was the most difficult section, as this was where the students needed to take theknowledge they had learned throughout the module and apply it to complicated medicalscenarios. Test items 5.1 and 5.2 posed different medical scenarios. Students were givenbackground information regarding the situation, then given the readings for the four vitalsigns. The participants needed to assess the readings and overall situation to determine ifthe given scenario constituted a medical emergency. Both test items displayed a drasticimprovement in performance; with a very large increase in percentage of correctresponses from 14% in the pre-test to 76% in the post-test for item 5.1, and another large
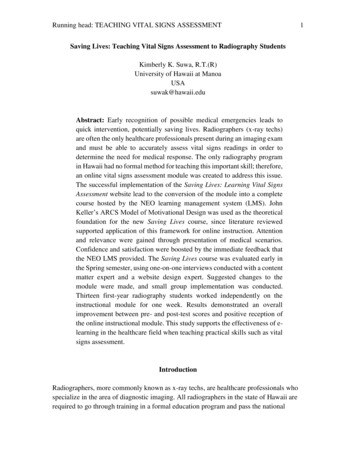
TEACHING VITAL SIGNS ASSESSMENT12increase in percentage of correct responses from 36% in the pre-test to 86% in the posttest for item 5.2.The test results were also analyzed by objective, to examine overall student mastery ofeach subject. Answering all items in a unit correctly was the criterion for mastery (Dicket al, 2009). The results can be seen in Figure 3 below.Percentage of Students Mastering ObjectivesStudent Mastery of -TestPost-Test40%15%20%15%8%0%Unit 1Unit 2Unit 3Unit 4Unit 5Units in ModuleFigure 3. Student mastery of objectives.Unit 1 displayed a small increase in the number of students mastering the concept ofbody temperature ranges, from 62% in the pre-test to 77% in the post-test. Unit 2demonstrated a drastic increase in the percentage of students mastering the less familiarvital sign of pulse rate, from 15% in the pre-test to 92% in the post-test. Unit 3 showedthe largest improvement in the percentage of students mastering the concept ofrespiration rate after completion of the module, from 15% in the pre-test to 100% in thepost-test. Unit 4 displayed another smaller increase in the number of students masteringthe concept of blood pressure ranges, from 62% in the pre-test to 100% in the post-test.Finally, Unit 5 illustrated another great improvement in the percentage of studentsmastering the difficult concept of overall vital signs assessment, with an increase from8% in the pre-test to 77% in the post-test.The results from the post-course attitudinal survey were also compiled and analyzed.Figure 4 displays the results of the first eight questions which employed a five-pointLikert scale to assess the participants’ opinions on the module.
TEACHING VITAL SIGNS ASSESSMENT13Figure 4. Results from the post-course attitudinal survey.The majority of the students (70%) surveyed strongly agreed that the instruction waspresented in an interesting manner, and 80% strongly agreed that they were able tounderstand the concepts that were taught in the module. Only 50% strongly agreed thatthe information presented was adequate for achieving the learning objectives, with 10%giving a neutral response. (For the purposes of this study, a neutral response wasconsidered a negative response.) Only half of the participants surveyed strongly agreedthat there were a sufficient number of practice exercises, but 70% of them stro
abnormal vital signs for risk of death, researchers found that the presence of three "critically abnormal" vital signs was associated with a patient mortality rate of 23.6% (Bleyer, Vidya, Russell, Jones, Sujata, Daeihagh, & Hire, 2011). Disturbances in multiple vital signs are common in patients with severe illness, as they may exhibit either