Transcription
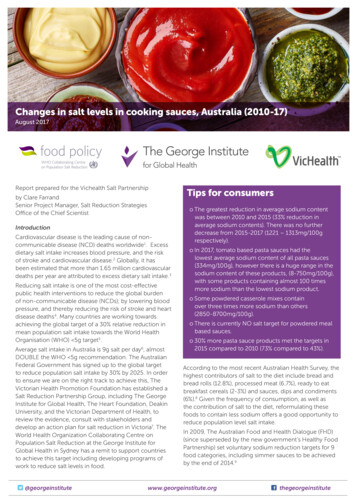
Changes in salt levels in cooking sauces, Australia (2010-17)August 2017Report prepared for the Vichealth Salt Partnershipby Clare FarrandSenior Project Manager, Salt Reduction StrategiesOffice of the Chief ScientistIntroductionCardiovascular disease is the leading cause of noncommunicable disease (NCD) deaths worldwide1. Excessdietary salt intake increases blood pressure, and the riskof stroke and cardiovascular disease.2 Globally, it hasbeen estimated that more than 1.65 million cardiovasculardeaths per year are attributed to excess dietary salt intake.3Reducing salt intake is one of the most cost-effectivepublic health interventions to reduce the global burdenof non-communicable disease (NCDs); by lowering bloodpressure, and thereby reducing the risk of stroke and heartdisease deaths4. Many countries are working towardsachieving the global target of a 30% relative reduction inmean population salt intake towards the World HealthOrganisation (WHO) 5g target5.Average salt intake in Australia is 9g salt per day6, almostDOUBLE the WHO 5g recommendation. The AustralianFederal Government has signed up to the global targetto reduce population salt intake by 30% by 2025. In orderto ensure we are on the right track to achieve this, TheVictorian Health Promotion Foundation has established aSalt Reduction Partnership Group, including The GeorgeInstitute for Global Health, The Heart Foundation, DeakinUniversity, and the Victorian Department of Health, toreview the evidence, consult with stakeholders anddevelop an action plan for salt reduction in Victoria7. TheWorld Health Organization Collaborating Centre onPopulation Salt Reduction at the George Institute forGlobal Health in Sydney has a remit to support countriesto achieve this target including developing programs ofwork to reduce salt levels in food.@georgeinstituteTips for consumerso The greatest reduction in average sodium contentwas between 2010 and 2015 (33% reduction inaverage sodium contents). There was no furtherdecrease from 2015-2017 (1221 – 1313mg/100grespectively).o In 2017, tomato based pasta sauces had thelowest average sodium content of all pasta sauces(334mg/100g), however there is a huge range in thesodium content of these products, (8-750mg/100g),with some products containing almost 100 timesmore sodium than the lowest sodium product.o Some powdered casserole mixes containover three times more sodium than others(2850-8700mg/100g).o There is currently NO salt target for powdered mealbased sauces.o 30% more pasta sauce products met the targets in2015 compared to 2010 (73% compared to 43%).According to the most recent Australian Health Survey, thehighest contributors of salt to the diet include bread andbread rolls (12.8%), processed meat (6.7%), ready to eatbreakfast cereals (2-3%) and sauces, dips and condiments(6%).8 Given the frequency of consumption, as well asthe contribution of salt to the diet, reformulating thesefoods to contain less sodium offers a good opportunity toreduce population level salt intake.In 2009, The Australian Food and Health Dialogue (FHD)(since superseded by the new government’s Healthy FoodPartnership) set voluntary sodium reduction targets for 9food categories, including simmer sauces to be achievedby the end of 2014.9www.georgeinstitute.orgthegeorgeinstitute
The aim of this study was to analyse the changes insodium contents in cooking sauces sold in Australia in2010, 2013, 2015 and 2017, and compare sodium contentsagainst the Australian FHD targets.10 This was with the viewto understanding the current levels of sodium levels incooking sauces in Australia and inform direction for futurereformulation efforts.Key findings Overall average sodium content of cooking saucesdecreased by 28% from 2010 (1815mg/100g) to 2017(1313mg/100g)o The greatest reduction in average sodium content wasbetween 2010 and 2015 (33% reduction in averagesodium contents). There was no further decrease from2015-2017 (1221 – 1313mg/100g respectively). In 2017, about 70% of products were covered by the FHDtargets, of which 55% of products met the targets. The average sodium content of ambient meal basedsauces increased by 29% from 542mg/100g in 2010 to696mg/100g in 2015. Black bean /Asian sauces had the highest averagesodium content in ambient meal based sauces (947mgsodium/100g) in 2017 with Ayam’s Pad Thai Stir Fry saucecontaining 2.9g of salt per serve. However there was ahuge range in sodium contents from 270-2250mg/100g– with some products containing more than 10 times theamount of sodium compared to others. Average sodium in ambient pasta sauces decreased by27% from 2010 (472mg/100g) to 2017 (342mg/100g),meeting the FHD (420mg/100g target). Howeverbetween 2015 and 2017 there was no further significantdecrease (376 and 342mg/100g respectively). Within ambient pasta sauces, the categories withthe greatest reductions included cream based andtomato based pasta sauces - reduced by 27% and 28%respectively from 2010-2017o In 2017, tomato based pasta sauces had thelowest average sodium content of all pasta sauces(334mg/100g), however there is a huge range in thesodium content of these products, (8-750mg/100g),with some products containing almost 100 times moresodium than the lowest sodium product. Powder based meal sauces had the highest meansodium content (5011mg/100g) amongst meal basedsauces in 2017. McCormick’s Slow Cookers MildChicken Curry sauce contains 8700g/100g for example.Whilst it is recognised that these products are dilutedwith water, there is a huge range of sodium contentfrom 715-8950mg/100g, which demonstrates thatmanufacturers are able to make these products with farless sodium.o For example: some powdered casserole mixescontain over three times more sodium than others(2850-8700mg/100g).2Changes in salt levels in cooking sauces, Australia (2010-17)The George Institute for Global Healtho There is currently NO salt target for powdered mealbased sauces. Curry pastes also contain high levels of sodium –average sodium content was 2000mg/100g in 2017 withsome products containing 20 times more sodium thanothers (range: 251-4530mg/100g). Since 2010, there has been an 18% increase in theproportion of products meeting the FHD targets (from37% in 2010 to 55% in 2017) The proportion of pasta sauce and other simmer sauceproducts meeting the FHD targets increased from 2010to 2015, however there was no further increase from2015 to 2017.o For example 30% more pasta sauce products met thetargets in 2015 compared to 2010 (73% compared to43%).ConclusionOverall the average sodium content of cooking saucesdecreased by 28% from 2010-2017. In addition, 55%of products, with FHD targets, now meet the targetscompared to 37% in 2010. However, there are somecategories, including where FHD targets were notapplicable, where average sodium levels have increased.The huge range in sodium content amongst similarproducts highlights the potential for further reductionsto be made by food manufacturers. The largest increasein the proportion of products meeting the targetsoccurred between 2010 and 2015, which suggests thatthe setting of targets may be effective in motivatingthe food industry to take action. However currently, nofurther targets have been set. This highlights the need forcomprehensive targets across the entire product category,with continuous, and specific time frames, and transparentmonitoring systems to ensure compliance by the foodindustry.LimitationsThe products captured in the packaged food compositiondatabase do not necessarily represent a completecoverage of the product supply within Australia, but ratherthose captured at specific time points during surveys, andlimited to major food retailers.About The George Institute’s Food Policy DivisionThe George Institute’s Food Policy group works in Australiaand internationally to reduce rates of death and diseasecaused by diets high in salt, saturated fat and sugar orexcess energy, by undertaking research and advocatingfor a healthier food environment. The George InstituteFood Policy group’s main focuses are food reformulation,monitoring changes in the food supply, and developingand testing innovative approaches to encourageconsumers towards better food choices.
The George Institute for Global HealthThe George Institute for Global Health is improving thelives of millions of people worldwide through innovativehealth research. Working across a broad health landscape,the Institute conducts clinical, population and healthsystem research aimed at changing health practice andpolicy worldwide. The Institute has a global network ofmedical and health experts working together to addressthe leading causes of death and disability worldwide.Established in Australia and affiliated with The Universityof Sydney, the Institute today also has offices in China,India and the United Kingdom, and is also affiliated withPeking University Health Science Centre, the University ofHyderabad and the University of Oxford.The George Institute prioritises clinical and populationhealth research that produces outcomes that are easilytranslated into practice, and effect real change within ashort period of time to health policy and practice. TheInstitute has been ranked among the top 10 globalinstitutes for impact for the last several years, and itsresearch has resulted in changes to medical guidelinesand ways of thinking about some of the most commonmedical treatments around the world. Examples includedeveloping a new treatment for stroke, showingthat blood pressure lowering reduces the risk ofcardiovascular disease in people with diabetes, andproviding safer fluid options for patients in intensive care.Developing better methods for delivering health care are apriority for the Institute. Follow us on Facebook at and onTwitter @georgeinstitutedisease 2013-2020. 2013; 789241506236 eng.pdf.6.Santos JA, Webster J, Land MA, et al. Dietary salt intakein the Australian population. Public health nutrition. May17 2017:1-8.7. Victorian Health Promotion Foundation. Salt Reductionin Victoria. 2017; ects/salt-reduction. Accessed 20 July,2017.8.Australian Bureau of Statistics. Australian Health Survey:Nutrition First Results - Foods and Nutrients, 2011-122014; 20Subject/4364.0.55.007 2011-12 Main%20Features Key%20Findings 1. Accessed 20 July, 2017.9.Australian Government Department of Health. Foodand Health Dialogue. 2016; nsf/Content/fhd. Accessed July20, 2017.10. Public Health England. Salt reduction: targets for 2017.2017; duction-targets-for-2017. Accessed 20 June,2017.Media EnquiriesJulia TimmsSenior Media AdvisorThe George Institute for Global HealthP: 61 410 411 983E: jtimms@georgeinstitute.org.auReferences:1. World Health Organization. Non Communicable DiseaseFactsheet. 2017; /. Accessed 20 July, 2017.2. He FJ, MacGregor GA. Effect of modest salt reductionon blood pressure: a meta-analysis of randomizedtrials. Implications for public health. Journal of humanhypertension. Nov 2002;16(11):761-770.3. Mozaffarian D, Fahimi S, Singh GM, et al. Globalsodium consumption and death from cardiovascularcauses. The New England journal of medicine. Aug 142014;371(7):624-634.4. Bibbins-Domingo K, Chertow GM, Coxson PG, et al.Projected effect of dietary salt reductions on futurecardiovascular disease. The New England journal ofmedicine. Feb 18 2010;362(7):590-599.5.World Health Organization. Global action plan forthe prevention and control of noncommunicableChanges in salt levels in cooking sauces, Australia (2010-17)The George Institute for Global Health3
Table 1: Mean, median, range of sodium in cooking sauces from 2010 to 2017FOOD CATEGORIESCOOKING SAUCESMeal-based saucesAmbient meal-based sauces2010 SODIUM LEVELS(mg/100g)2013 SODIUM LEVELS (mg/100g)2015 SODIUM LEVELS (mg/100g)2017 SODIUM LEVELS 89188-5890121696416108-8210100554416120-2250Black 353-430Sweet and 7611202419-422016617521220-1610Curry 000283-59605820001870251-4530Liquid meal-based 4245-1090Devilled 4248048057-902Pasta 829486-890Potato 2867396-1650Powdered meal-based 50-8700Chili con 455322890-6240CasseroleDevilled 2002825-6880Potato 8001033893885641-499026500751002100-8950Pasta 5971864133778-1350Ambient pasta 67321-75119452438341-74513397416292-506Pasta sauce with 450130-480Changes in salt levels in cooking sauces, Australia (2010-17)The George Institute for Global Health
Tomato-based108466444153153105355366Pasta sauce with 4316301Fresh pasta saucesCream-basedPestoTomato ble 2: Cooking sauces categories with FHD targets: proportion of products meeting the targets from 2010 to 2017FOODCATEGORIESFHD Target 2010(mg/100g) No. ofproducts2013No. meetingthe target2015% meetingthe targetNo. ofproductsNo. meetingthe target% meetingthe targetNo. ofproducts2017No. meetingthe target% meetingthe targetNo. ofproductsNo. meetingthe target% meetingthe targetAsian-style sauces16806925361314232712332953032Indian-style sauces2420562748582950754560592949Pasta sauces34201456243205129631921417316912775Other (simmer 7449207463932255737820655Includes Black bean/Asian ambient, satay ambient, sweet and sour ambient meal based sauces, and Asian-style liquid recipe bases; Includes curry-based ambient meal-based sauces and curry-style liquid recipebases; 3 Includes ambient cream-based, ambient pasta sauce with meat, ambient tomato-based, fresh cream-based, fresh pasta sauce with meat, fresh tomato-based pasta sauces, and pasta meal liquid recipe bases;4Includes chicken-based, stroganoff and other ambient meal-based sauces, and casserole, devilled sausages, potato bake, stroganoff and other liquid recipe bases12Table 3: Cooking sauces categories with UK targets (average): proportion of products meeting the targets from 2010 to 20171FOODCATEGORIESUK Target(mg/100g)2010201320152017No. ofproductsNo. meetingthe target% meetingthe targetNo. ofproductsNo. meetingthe target% meetingthe targetNo. ofproductsNo. meetingthe target% meetingthe targetNo. ofproductsNo. meetingthe target% meetingthe targetAll cook in and pastasauces13003173310439631437959163625916Pesto and other thicksauces2550911123292021020315Thick 570991746072164639921Includes ambient and liquid meal-based sauces (excluding passata), and ambient and fresh pasta sauces; 2 Includes pesto; 3 Includes curry and tomato pastesChanges in salt levels in cooking sauces, Australia (2010-17)The George Institute for Global Health5
Table 4: Cooking sauces categories with UK targets (maximum): proportion of products meeting the targets from 2010 to 2017FOODCATEGORIESUK Target(mg/100g)2010201320152017No. ofproductsNo.meeting thetarget% meetingthe targetNo. ofproductsNo.meeting thetarget% meetingthe targetNo. ofproductsNo.meeting thetarget% meetingthe targetNo. ofproductsNo.meeting thetarget% meetingthe targetAll cook in and o and other thicksauces26509222234172052520315Thick 85701592846014632463155331 Includes ambient and liquid meal-based sauces (excluding passata), and ambient and fresh pasta sauces; 2 Includes pesto; 3 Includes curry and tomato pastes6Changes in salt levels in cooking sauces, Australia (2010-17)The George Institute for Global Health
The average sodium content of ambient meal based sauces increased by 29% from 542mg/100g in 2010 to 696mg/100g in 2015. Black bean /Asian sauces had the highest average sodium content in ambient meal based sauces (947mg sodium/100g) in 2017 with Ayam's Pad Thai Stir Fry sauce containing 2.9g of salt per serve. However there was a


