Transcription
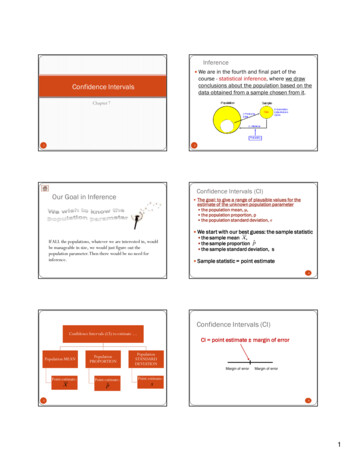
Inference We are in the fourth and final part of thecourse - statistical inference, where we drawconclusions about the population based on thedata obtained from a sample chosen from it.Confidence IntervalsChapter 7 1 2Confidence Intervals (CI)Our Goal in Inference The goal: to give a range of plausible values for theestimate of the unknown population parameter the population mean, μ,, the population proportion, p the population standard deviation, σ We start with our best guess: the sample statisticIf ALL the populations, whatever we are interested in, wouldbe manageable in size, we would just figure out thepopulation parameter. Then there would be no need forinference. the sample mean x, the sample proportion p the sample standard deviation, s Sample statistic point estimate 4Confidence Intervals (CI)Confidence Intervals (CI) to estimate CI point estimate margin of errorPopulation NMargin of errorPoint estimate:x 5Point estimate:p Margin of errorPoint estimate:s 61
Margin of errorConfidence Intervals (CI) for a Mean Suppose a random sample of size n is taken from a normal Shows how accurate we believe our estimate ispopulation of values for a quantitative variable whose meanµ is unknown,unknown, when the population’s standard deviation σ isknown.known. A confidence interval (CI) for µ is: The smaller the margin of error, the moreprecise our estimate of the true parameter Formula:CI point estimate margin of error critical standard deviation E value of the statistic σx z * Point estimatenMargin of error (m or E) 8So what’s z*?Statement: (memorize!!) A confidence interval is associated with a confidenceWe are % confident thatthe true mean context lies withinthe interval and .level. We will say: “the 95% confidence intervalfor the population mean is ” The most common choices for a confidence level are 90% :z* 1.645 95% : z* 1.96, 99% : z* 2.576. 9The Trade-offUsing the calculator Calculator: STAT TESTS 7:ZInterval Inpt: Data StatsUse this whenyou have datain one of your lists There is a tradetrade-off between the level of confidence andUse this whenyou know x and σprecision in which the parameter is estimated.estimated. higher level of confidence -- wider confidence interval lower level of confidence – narrower confidence interval 11 122
The Margin of Error95% confident means:In 95% of all possibleσ The width (or length) of the CI is exactly twicenthe margin of error (E):samples of this size n,Eµ will indeed fall in ourEconfidence interval.In only 5% of samplesEwould miss µ. The margin of error is therefore "in charge" of the width ofthe confidence interval. 14How can you make the margin of errorsmaller?Comment z* smaller The margin of error (E ) isE z * (lower confidence level)σn σ smaller(less variation in the population)and since n, the sample size, appears in thedenominator, increasing n will reduce themargin of error for a fixed z*. n larger Really cannot(to cut the margin oferror in half, n mustchange!be 4 times as big) 15Calculating the Sample SizeMargin of Error and the Sample Size In situations where a researcher has someflexibility as to the sample size, the researchercan calculate in advance what the sample size isthat he/she needs in order to be able to report aconfidence interval with a certain level ofconfidence and a certain margin of error.E z * σnσ n z * E 2Clearly, the sample size n must be an integer.Calculation may give us a non-integer result.In these cases, we should alwaysround up to the next highest integer.integer 17 183
σExampleAssumptions for the validity of x z * IQ scores are known to vary normally with standarddeviation 15. How many students should besampled if we want to estimate population mean IQat 99% confidence with a margin of error equal to2?2 The standard deviation, σ, is known and either the sample size must be large (n 30) or for smaller sample the variable of interest215 σ n z * 2.576 373.26 E 2 n The sample must be randomn 374must be normally distributed in thepopulation.They should take a sample of 374 students. 19 20Steps to follow1. Check conditions:conditions SRS, σ isknown, and either n 30 or thepopulation distribution is normal2. Calculate the CI for the givenconfidence level3. Interpret the CI 21Example 1 A college admissions director wishesto estimate the mean age of allstudents currently enrolled. In arandom sample of 20 students, themean age is found to be 22.9 years.Form past studies, the standard deviation is known tobe 1.5 years and the population is normally distributed.Construct a 90% confidence interval of the populationmean age. 22Step 1: Check conditionsStep 2: Calculate the 90% CI using the formula A college admissions director wishes to estimatex 22.9the mean age of all students currently enrolled. In arandom sample of 20 students, the mean age isfound to be 22.9 years. Form past studies, thestandard deviation is known to be 1.5 years and thepopulation is normally distributed.distributedσ 15.n 20z * 1645.x z* SRSσn 22.9 1645.15. 22.9 0.6 (22.3,235.)20 σ is known The population is normally distributed 23 244
Step 2: Calculate the 90% CI using thecalculatorStep 3: Interpretation Calculator: STAT TESTS 7:ZInterval Inpt: Data Stats σ 1.5 x 22.9 n 20 C-Level: .90 Calculate We are 90% confident that the meanage of all students at that college isbetween 22.3 and 23.5 years.ZInterval : (22.3, 23.5) 25 26Example 1Example 2 How many students should he ask if he wants theA scientist wants to know the density of bacteria in a certainsolution. He makes measurements of 10 randomly selectedsample:margin of error to be no more than 0.5 years with99% confidence?224, 31, 29, 25, 27, 27, 32, 25, 26, 29 *106bacteria/ml.2σ 15. n z * 2.576 59.72 E 0.5 From past studies the scientist knows that the distribution ofbacteria level is normally distributed and the populationstandard deviation is 2*106 bacteria/ml. Thus, he needs to have at least 60 students in hisa. What is the point estimate of μ?sample.x 27.5 *106 bacteria/ml. 27Example 2Example 2Using the calculator: Enter the number into on of the lists, say L1 STAT TESTS 7: ZInterval b. Findthe 95% confidence interval for themean level of bacteria in the solution. Step 1: check conditions: SRS, normal Inpt: Datadistribution, σ is known. All satisfied. σ: 2 Step 2: CI:x z*σn 27.5 1.96 List: L12 27.5 1.24 (26.26,28.74)10 Freq: 1 (it’s always 1) C-Level: .95 Step 3: Interpret: we are 95% confident that the Calculatemean bacteria level in the whole solution isbetween 26.26 and 28.74 *106 bacteria/ml. 29 (26.26, 28.74) 305
Example 2Example 2 c. What is the margin of error? d. How many measurements should he make toobtain a margin of error of at most 0.5*106bacteria/ml with a confidence level of 95%?From part b:x z*σ 27.5 1.96n2 27.5 1.24 (26.26,28.74)1022 σ 2 10 6 n z * 196. 614656 E 0.5 10 6 Thus, the margin of error is Thus, he needs to take 62 measurements.E 1.24 *106 bacteria/ml. 31 32Assumptions for the validity of The sample must be randomσx z * n The standard deviation, σ, is known and either The sample size must be large (n 30) or For smaller sample the variable of interest mustbe normally distributed in the population. The only situation when we cannot use this confidence interval, then, iswhen the sample size is small and the variable of interest is not known tohave a normal distribution. In that case, other methods called nonparameteric methods need to be used.Example 3In a randomized comparativeexperiment on the effects of calcium on bloodpressure, researchers divided 54 healthy, whitemales at random into two groups, takes calcium orplacebo. The paper reports a mean seated systolicblood pressure of 114.9 with standard deviation of9.3 for the placebo group. Assume systolic bloodpressure is normally distributed.Can you find a z-interval for this problem? Why orwhy not? 33So what if σ is unknown? Well, there is some good news and some bad news!σThe good news is that we can easily replace the population standarddeviation, σ, with the sample standard deviation s. 35And the bad news is that once σ has been replaced by s, we lose theCentral Limit Theorem together with the normalityof X and therefore the confidencemultipliers z* for the different levels ofconfidence are (generally) not accurate any more. The new multipliers come from a differentdistribution called the "t distribution" and aretherefore denoted by t* (instead of z*). 366
CI for the population mean when σ isunknownz* vs. t* There is an important difference between the The confidence interval for the population mean µ when σ isconfidence multipliers we have used so far (z*) andthose needed for the case when σ is unknown (t*). z*, depends only on the level of confidence, t* depend on both the level of confidence and on thesample size (for example: the t* used in a 95%confidence when n 10 is different from the t*used when n 40).unknown is therefore:x t * sn 37 38t-distributiont-distribution There is a different t distribution for each The t-distribution is bell shaped and symmetric about themean.sample size. We specify a particular tdistribution by giving its degrees offreedom. The degrees of freedom for theone-sample t statistic come from the samplestandard error s in the denominator of t.Since s has n-1 degrees of freedom, the tdistribution has n-1 degrees of freedom. 39 The total area under the t-curve is 1 The mean, median, and mode of the t-distribution are equalto zero. The tails in the t-distribution are “thicker” than those in thestandard normal distribution. As the df (sample size) increases, the t-distributionapproaches the normal distribution. After 29 df the tdistribution is very close to the standard normal zdistribution. 40Historical ReferenceDensity of the t-distribution (red and green) for 1, 2, 3, 5, 10, and30 df compared to normal distribution (blue) William Gosset (1876-1937)developed the t-distributionwhile employed by theGuinness Brewing Companyin Dublin, Ireland. Gossetpublished his findings usingthe name “Student”. The tdistribution is, therefore,sometimes referred to as“Student’s t-distribution”. 41 427
CalculatorExample To study the metabolism of insects, Calculator:researchers fed cockroaches measuredamounts of a sugar solution. After 2, 5,and 10 hours, they dissected some of thecockroaches and measured the amountof sugar in various tissues. Five roachesfed the sugar solution and dissected after10 hours had the following amounts ofsugar in their hindguts: STAT TESTS 8:TInterval Inpt: Data StatsUse this whenyou have datain one of your listsUse this whenyou know x and s 43 44ExampleExample 55.95, 68.24, 52.73, 21.50, 23.78 The large margin of error is due to the small sample size Find the 95% CI for the mean amount of sugar in cockroachand the rather large variation among the cockroaches.hindguts:x 44.44 Calculator:s 20.741 Put the data in L1.The degrees of freedom, df n-1 4, and from the table we findthat for the 95% confidence, t* 2.776. Thenx t * STAT TESTS 8:TInterval Inpt: Data Stats List: L1 Freq:1 C-level: .95s20.741 44.44 2.776 (18.69, 7019. )n5 45 46Examples: You take: 24 samples, the data are normally distributed, σ is knownσx z* normal distribution with σn 14 samples, the data are normally distributed, σ is unknownx t * t-distribution with ssn 34 samples, the data are not normally distributed, σ isunknown normal distribution with sx t*sn 12 samples; the data are not normally distributed, σ isunknown cannot use the normal distribution or the t-distribution 47 488
Some Cautions:Estimating a Population Proportion The data MUST be a SRS from theWhen the variable of interest is categorical, the populationparameter that we will infer about is a population proportion (p)associated with that variable.population The formula is not correct for morecomplex sampling designs, i.e., stratified,etc. No way to correct for bias in data Outliers can have a large effect onconfidence interval Must know σ to do a z-interval – whichis unrealistic in practice For example, if we are interested in studyingopinions about the death penalty among U.S.adults, and thus our variable of interest is"death penalty (in favor/against)," we'llchoose a sample of U.S. adults and use thecollected data to make inference about p the proportion of US adults who support thedeath penalty. 50Example 2Example 2 Suppose that we are interested in the opinions of U.S. If we wanted to estimate p, the population proportion by aadults regarding legalizing the use of marijuana. Inparticular, we are interested in the parameter p, theproportion of U.S. adults who believe marijuana shouldbe legalized. Suppose a poll of 1000 U.S. adults finds that 560 of thembelieve marijuana should be legalized.single number based on the sample, it would make intuitivesense to use the corresponding quantity in the sample, thesample proportion p 560/1000 0.56 . We say in thiscase that 0.56 is the point estimate for p, and that ingeneral, we'll always use p as the point estimator for p. Note, again, that when we talk about the specific value (.56), we usethe term estimate, and when we talk in general about the statisticwe use the term estimator. Here is a visual summary of this example: 52 51Example 2Back to Example 2 Suppose a poll of 1000 U.S. adults finds that 560 of thembelieve marijuana should be legalized. 53 549
The CI for pCalculator: Thus, the confidence interval for p is STAT TESTS A:1-PropZInt p E p z * p (1 p )nx np x is the number of successes: For a 95% CI use z* 1.96 For a 90% CI use z* 1.645 For a 99% CI use z* 2.576 55 56ConditionsExample The CI is reasonably accurate when three conditions are met: Suppose you have a random sample of 40 buses from a large city and find that24 buses have a safety violation. Find the 90% CI for the proportion of allbuses that have a safety violation. Conditions: SRS The sample was a simple random sample (SRS) from a binomialpopulation Bothand n(1 p ) 10 The size of the population is at least 10 times the size of the samplenp 10 bothnp 40( 2440 ) 24 10 andn(1 p ) 40(1 2440) 16 10 The size of the population (all the buses) is at least 10 times the size of thesample (40) 57 5890% CIp 24 0.640 For 90% CI z* 1.645p E p z * 59p (1 p )0.6(1 0.6) 0.6 1645. 0.6 013. (0.47, 0.73)n40Interpretation 1. What is it that you are 90% sure is in the confidence interval?The proportion of all of the buses in this population that have safetyviolations if we could check them all. 2. What is the meaning (or interpretation) of the confidenceinterval of 0.47 to 0.73?We are 90% confident that if we could check all of the buses in thispopulation, between 47% and 73% of them would have safetyviolations. 3. What is the meaning of 90% confidence?If we took 100 random samples of buses from this population andcomputed the 90% confidence interval from each sample, then wewould expect that 90 of these intervals would contain the proportionof all buses in this population that have safety violations. In otherwords, we are using a method that captures the true populationproportion 90% of the time. 6010
Margin of Error and Sample SizeMargin of Error and Sample Size When we have some level of flexibility in determining the samplesize, we can set a desired margin of error for estimating thepopulation proportion and find the sample size that will achievethat. For example, a final poll on the day before an election would wantthe margin of error to be quite small (with a high level ofconfidence) in order to be able to predict the election results withthe most precision. This is particularly relevant when it is a closerace between the candidates. The polling company needs to figureout how many eligible voters it needs to include in their sample inorder to achieve that. Let's see how we do that. The confidence interval for p isp E p z * p (1 p )nE z * p (1 p )n Thus, the margin of error isUsing some algebra we have2 z * n p (1 p ) E 61 622 z * n p (1 p ) E What sample size should we use for a survey ifwe want a margin of error to be at most 3%?Let’s use the 95% confidence here, so z* 1.96.Also, since we don’t have an estimate of p, we willuse p 0.5 .Then If you have a good estimate p of p, use it in this formula,otherwise take the conservative approach by setting p 12. You have to decide on a level of confidence so you know what2value of z* to use (most common one is the 95% level). Also, obviously, you have to set the margin of error (the mostcommon one is 3%).2. z * 196n p (1 p ) ( 0.5)(1 0.5) 1067.111 E 0.03 Because you must have a sample size of at least 1067.111,round up to 1068. So n should be at least 1068. 63 64Summary: CI for a population proportionp z * a population mean, σ is knownand normally distributed populationor n 30a population mean, σ is unknownand normally distributed populationor n 30p (1 p )nσx z*x z*nx t * snsn 6511
placebo. The paper reports a mean seated systolic blood pressure of 114.9 with standard deviation of 9.3 for the placebo group. Assume systolic blood pressure is normally distributed. Can you find a z-interval for this problem? Why or why not? So what if σis unknown? 35 Well, there is some good news and some bad news!