Transcription
A Guide to the Analysisand Purification ofProteins and Peptides byReversed-Phase HPLCHPLC ColumnsDavid Carr
Your decision has lasting effects.Choose wisely.HPLC ColumnsUltra Inert Base-Deactivated HPLC ColumnsFor Performance, Selectivityand Guaranteed ReproducibilityACE performanceguaranteeIf ACE does not outperform your existing column (of equivalent phase,particle size and dimensions), send in your comparative data within 60days and keep the ACE column FREE OF CHARGE.
ContentsA Guide to the Analysis and Purification of Proteinsand Peptides by Reversed-Phase HPLCTable of ContentsPagesIntroduction2-3Mechanism of protein/peptide retention4-5Column characteristics6 - 11Mobile phaseDetection12 - 1819Effect of temperature20 - 21Reversed-phase HPLC-MS22 - 25Peptide mapping26 - 31Protein oxidation32 - 33Protein deamidation34 - 36Disulphide bond determination37 - 39Protein/Peptide purification40 - 45Proteomics46 - 49References50-53Appendix: Column characteristicsAppendix: Amino Acid Charateristics5455 - 60
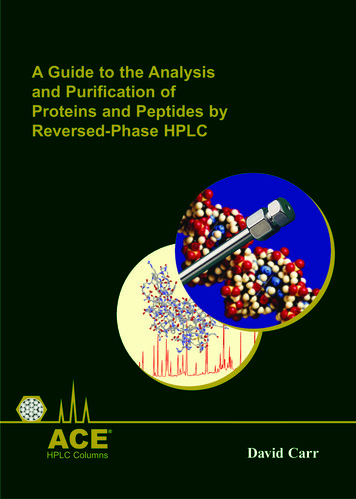
IntroductionReversed-phase HPLC has become an essential tool in the separation and analysis ofproteins and peptides. It is widely used in the biotechnology industry to characterizeprotein therapeutic products and to analyze these for product identity and impurities.Reversed-phase HPLC plays a vital role in the separation of peptides from digestedproteomes prior to protein identification by mass spectrometry. It is also used topurify many proteins and peptides during investigative studies and is used for largescale purification of protein therapeutic drugs.Reversed-phase HPLC has found a central role in protein studies because of itsversatility, sensitive detection and its ability to work together with techniques such asmass spectrometry. Most of all, however, reversed-phase HPLC is widely usedbecause of its ability to separate proteins of nearly identical structure. As illustratedby the separation of bovine, human and porcine insulin variants (Figure 1), reversedphase HPLC is able to separate very similar proteins. Bovine and human insulindiffer by only three amino acids and are well separated. Bovine insulin has analanine at residue 8 and a valine at residue 10 on the insulin ‘a’ chain and an alanineat residue 30 of the ‘b’ chain. Human insulin has a threonine at residue 8 and anisoleucine at residue 10 on the ‘a’ chain and a threonine at residue 30 of the ‘b’Figure 1 Separation ofclosely related insulinvariants by RP-HPLCUV absorbance215 nmHumanInsulinBovineInsulinConditionsColumn: ACE 5 C18,4.6 x 250mmEluent: 29.3 - 31.7% ACN in0.1% TFA over 16 min at 1.0mL/minSample: bovine, human andporcine insulinPorcineInsulin8101214MinutesPage 2www.ace-hplc.com1618
Introductionchain. Porcine and human insulin differ by just one amino acid (porcine has analanine at residue 30 of the ‘b’ chain; human insulin has a threonine at that position)and are baseline resolved. In another example rabbit insulin was separated fromhuman insulin even though they differ by one amino acid, threonine in place ofserine (Reference 1).The high resolving capability of reversed-phase HPLC extends to peptides as well.In Figure 2, two peptides are shown to be well resolved although differing by onlya single amino acid, serine versus threonine.It is this high resolution capability that is the foundation for the widespread use ofreversed-phase HPLC for the separation of proteins and peptides.Figure 2. Separation of closely related peptides by RP-HPLC. Two decapeptides differby a single amino acid, a serine in one case and a threonine in the other.ConditionsColumn: C18 wide pore,4.6 x 250 mmEluent:A. 0.1% TFA in waterB. 0.08% TFA in ACNGradient: 0 - 35% B over73 min(Reference 2)AQTVPWGISRAQSVPWGISR404550www.ace-hplc.com556065 minsPage 3
Mechanism of Protein/Peptide RetentionIn reversed-phase HPLC theparticle surface is veryhydrophobic due to thechemical attachment ofhydrocarbon groups to thesurface (wavy red lines inFigure 3). Proteins areretained by the adsorption ofa face of the protein (termedthe “hydrophobic foot”) to thehydrophobic surface (FigureFigure 3. The relatively large protein molecule isadsorbed onto the hydrophobic surface by means3). Since proteins are largeof the hydrophobic effectcompared to the thickness ofthe hydrophobic surface, onlya portion of the protein adsorbs to the hydrophobic surface. Much of the protein liesabove the surface and is in contact with the mobile phase. The net interaction causedby this hydrophobic adsorption is very strong resulting in the protein remainingadsorbed to the surface (Figure 4A) until a specific concentration of organic solventis reached, at which time the protein desorbs from the surface and elutes from thecolumn (Figure 4B). Although there is some interaction with the surface as theprotein moves down the column after the initial adsorption/desorption, furtherinteractions are minor and do not contribute to separation. Separation isaccomplished by the single adsorption/desorption process. The concentration ofFigure 4. Proteins entering thecolumn adsorb to the hydrophobicsurface near the top of the column (A)and remain adsorbed until the organicmodifier concentration reaches aspecific concentration, when theprotein desorbs from the surface (B).Page 4www.ace-hplc.comAB
Mechanism of Protein/Peptide Retentionorganic modifier required to desorb theprotein is highly specific and is a function ofthe size of the hydrophobic foot. For furtherdetails see Reference 3.RetentionBiphenylThe adsorption/desorption retention(black)Proteinsmechanism leads to protein retention(red, blue,behaviour that is different than with smallgreen)molecules in reversed-phase HPLC. Whilesmall molecules change retention slowlywith changes in organic solvent020406080concentration (Figure 5, biphenyl), thePercent organicretention of proteins changes abruptly oncethe required concentration of organic solvent Figure 5. Retention versus organicsolvent concentrationis reached, resulting in a rapid change inretention (Figure 5, proteins). This results inthe sharp peaks usually seen with proteins and peptides (Figure 6A). The largechange in retention with small changes in organic solvent concentration means thatisocratic elution is seldom useful with proteins because peaks become broad andsmall changes in organic solvent concentration result in large changes in proteinretention (Figure 6B).Figure 6.A. Peptides and proteins elute with sharp peaks during gradient elution.B. With isocratic elution protein peaks, in this case lysozyme, are broad and smallchanges in organic solvent result in large changes in retention.AB42% ACN with 0.1% TFA40% ACN with 0.1% TFA39% ACN with0.1% TFA03060 min0www.ace-hplc.com1020 minPage 5
Column CharacteristicsParticles. Proteins and peptides are separated by interacting with thehydrophobic surface of particles packed in columns. The particles in thecolumn are usually made of silica because silica is physically robust,it is stable under most solvent conditions (except at pH greaterthan 6.5) and silica can be made into spherical particles of various sizeswith pores of different diameters.Silica purity. The purity of the silica used in HPLC columns is important inseparation performance. Metal ion impurities cause peak tailing and loss ofresolution as shown in Figure 7A (0.01 and 0.005% TFA). Silica with metalimpurities (Figure 7A) requires the use of high concentrations of an ion-pair reagent,Figure 7. Silica purity affects peptide peak shape, especially at low concentrations of ionpairing reagent. High purity silica can be used at much lower concentrations of ion-pairingreagent than silica of lower purity.A. Lower purity silica:Vydac C18 , 4.6 x 250 mmB. High purity silica:ACE 5 C18 , 4.6 x 250 mm0.1% TFA01020 min01020 min01020 min1020 min0.01% TFA01020 min0.005% TFA0102030 min0Eluent: Gradient 10 - 55% ACN in 37.5 min with TFA as indicatedPage 6www.ace-hplc.com
Column Characteristicstrifluoroacetic acid (TFA), to maintain good peak shape. The use of lowconcentrations of TFA results in poor peak shape and loss of resolution. With highpurity silica (Figure 7B), TFA concentrations as low as 0.005% result in goodpeptide peak shape. This is especially important in LC-MS because TFA causes asignal reduction when using the electrospray interface. Low concentrations of TFAresult in better detection signal in LC-MS (see pages 22 - 25)Pore Diameter. Using small pore ( 100 angstrom) silica normally used in reversedphase HPLC results in inferior protein separations. Wide pore silica ( 300 angstromdiameter) gives much better separations of proteins (Reference 4). As illustrated inFigure 8, proteins cannot enter small pores, leaving only the very small exteriorsurface for separations to occur. Wide pore silica allows proteins and even largerpeptides to enter the pore and fully interact with the surface, thus resulting in betterpeak shape and resolution. Wide pore silicas are universally used today for proteinseparations. Small peptides, such as those resulting from protease digests, can enterthe pores of small pore silica and interact with the surface and therefore small poresilicas may be used for separating protein digests. However wide pore silicas alsoseparate peptides well and result in different selectivity and resolution.Figure 8. Small pore ( 100angstrom) particles commonly usedin reversed-phase HPLC (left) donot permit most proteins to enter thepores, thus limiting surfaceinteraction. Particles with wide( 300 angstrom) pores (right) allowproteins to enter and interact withthe hydrophobic surface.100300angstrom angstromporesporeswww.ace-hplc.comPage 7
Column CharacteristicsHydrophobic surface. The silica isFigure 9. The hydrophobic surface ismodified with a hydrocarbonformed by the chemicalattachment of hydrophobicmolecule in order to create aligands to the silica surfacehydrophobic surface. A chlorosilaneby means of anwith an attached hydrocarbon chain,organochlorosilane.such as octadecylchlorosilane, isreacted with the silica (the surfaceof which consists of polar silanolgroups) to attach the hydrocarbon tothe silica surface (Figure 9). Theorganosilane molecules do not reactwith every silanol on the silicasurface because of steric hindranceand a significant number of polarsilanols remain on the surface. Aprocess called “end-capping” whereby a small organosilane is subsequently reactedwith the silica surface, further reduces the number of polar silanol groups.Choosing the separation surface. The chemistry used to modify the silica surfaceallows various organic groups to be attached to the silica. The most commonmodification is attachment of a linear, aliphatic eighteen carbon chain resulting in a“C18” or ODS type column (Figure 10A). As shown, the organochlorosilane reactswith many of the silanols, but not all. This creates a fairly thick layer of hydrocarbonon the surface. It is to this thick hydrocarbon layer that proteins and peptides adsorb.The C18 column is particularly useful for the separation of peptides less than 2-3,000daltons and is usually the column of choice for the separation of peptides resultingfrom protease digestion of proteins (see pages 26 - 31) as well as the separation ofnatural and synthetic peptides. A less hydrophobic phase results from the attachmentof butyl (C4) groups to the silica surface (Figure 10B). The butyl phase is mostsuitable for protein separations but can also be used to separate large or hydrophobicpeptides.Page 8www.ace-hplc.com
Column CharacteristicsProteins can be separatedwith a C18 column,however some proteinshave poor peak shape ortailing peaks on C18columns and C4 columnsare recommended forprotein separations.Other columns used forpolypeptide separationsinclude phenyl phases(Reference 6), which aresimilar to C4 columns inhydrophobicity, and polarembedded or polarendcapped columnswhich enhance polarinteractions betweenpeptides and the particlesurface. This may resultin different selectivity forpeptides.Figure 10.A. C18 hydrophobic phase isbest suited to separationof peptides smallerthan 2000-3000daltonsB. C4 hydrophobic phase isbest suited toseparation ofpeptides greaterthan 3000daltons andproteinsPeptide selectivity. Column selectivity for peptides is affected by the nature andcharacteristics of the bonded phase as well as the underlying silica surface. Differentreversed-phase columns may offer different peptide selectivity. In particular:O The amount of phase (“carbon load”) on the silica affects selectivity. When lesshydrocarbon is attached to the surface (lower carbon load), polar silanols mayaffect the separation more than on columns with higher carbon load, thusresulting in different selectivity.O Different manufacturing processes yield silica with different properties, which canaffect peptide selectivity.www.ace-hplc.comPage 9
Column CharacteristicsColumn length. The more interactionsmall molecules have with the particlesurface the better the resolution and longcolumns give higher resolution than shortcolumns. Proteins, however, adsorb nearthe top of the column, are subsequentlydesorbed and do not interact appreciablywith the particle surface after beingdesorbed (Figure 11). Although datasuggests that some interaction does occurbetween a protein and the particle surface,the interaction is not selective and does notcontribute to resolution between proteins.Column length is not important in proteinseparations and short columns separateproteins as well as long columns.Figure 12. In contrast to proteins, peptides areusually better resolved on longer columns.A. 150 mm column.B. 250 mm column.Figure 11. Proteins adsorb anddesorb near thetop of thecolumn. Oncedesorbed,proteins interactminimally with thehydrophobicphase, thuslonger columnsdo not increaseresolution withproteins as theydo with smallmolecules.Since peptides interact lessstrongly with the hydrophobicreversed-phase surface thanproteins, length appears to play agreater role in peptide andprotein digest separations. Asillustrated in Figure 12, longercolumns usually result in betterresolution for peptides thanshorter columns. Fifteeen ortwenty-five centimetercolumns are recommended forpeptide separations.0Column: C18 small pore, 4.6 x 150 or 250 mmEluent: Gradient: 0 - 70% ACN over 60 minPage 10www.ace-hplc.com
Column CharacteristicsColumn Diameter. The standard diameter of analytical HPLC columns is 4.6 mm.These columns are best run at flow rates of 1 ml/min. Smaller bore columns arecommercially available and are used for specific reasons and purposes. Narrow borecolumns ( 2 mm i.d.) are run at flow rates of 200 microlitres/min and thus use lesssolvent than 4.6 mm i.d. analytical columns. Narrow bore columns also exhibit aboutfive times the sensitivity of standard analytical columns. This is because the amountof solvent passing through the detector per minute is lower, resulting in a higherconcentration of protein or peptide in the peak. Concentration dependent detectors,such as the UV detector and electrospray mass spectrometer, show greater sensitivitywith smaller bore columns.Microbore columns operate at flow rates of 50 microlitres/minutes and thereforetheir use results in even better sensitivity, about 50 times that of an analyticalcolumn. Finally, capillary columns operating at 1 - 50 microlitres/minute flowrates exhibit even higher relative sensitivity, about 200 times the sensitivity of ananalytical column. Microbore and capillary columns, however, require specializedinstruments because of the flow rates being used and the greater significance ofextra-column dead volume. Much greater care must be taken in the use of very smallbore columns. Column characteristics are summarized in Figure 13 and also in theAppendix. See Reference 5 for details regarding the use of small bore columns.Figure 13.Characteristics ofcolumns of differentdiametersColumn typeAnalyticalNarrow BoreMicroboreDiameter4.6 mm2.0 mm1.0 mmFlow rate 1 ml/min 200 L/min15Relative sensitivitywww.ace-hplc.com 50 L/min50Capillary 1 mm5 - 50 L/min200Page 11
Mobile PhaseProteins are desorbedfrom the hydrophobicsurface with an organicsolvent (Figure 14).When, during thesolvent gradient, theamount of organicsolvent reaches a preciseconcentration which isunique to each protein,the protein desorbs fromthe hydrophobic surfaceand continues down thecolumn and elutes fromthe column.Figure 14. Proteins are desorbed from the hydrophobicsurface when the organic modifier concentration reaches aspecific value.Acetonitrile. The organic solvent most commonly used in polypeptide reversedphase chromatography is acetonitrile. Acetonitrile is used because it:O Is volatile and easily removed from the sample.O Has low viscosity and thus low back pressure.O Is quite transparent to low wavelength UV light.O Has a long history of successful separations.Isopropanol. Isopropanol plays a particular role in polypeptide chromatography.While seldom used as the sole organic modifier because of its high viscosity (andconsequent high back pressure), it is useful to improve recovery of somepolypeptides, particularly very hydrophobic proteins. In such cases isopropanol isadded at a constant concentration of 1 - 5 percent to enhance recovery or elution ofhydrophobic polypeptides.Other organic modifiers. Organic modifiers such as methanol or ethanol areseldom used except for very hydrophobic proteins (Reference 7). Ethanol is alsoused for large scale process purification of proteins because of its low toxicity.Page 12www.ace-hplc.com
Mobile PhaseGradient elution. Polypeptides are almost always eluted using a solvent gradientwhere the relative concentration of organic solvent is slowly increased during theseparation. Proteins and peptides elute when the concentration of the organicmodifier rises to the precise concentration required for desorption. As illustrated inFigure 15, the slower the rate of change of organic modifier concentration (thegradient slope), the better the resolution of these protein subunits. In this example aslope of 0.25% per minute resulted in significantly improved resolution compared toa slope of 0.5% per minute.Figure 1 (Page 2) showsFigure 15. Reducing the rate of change of organic solventin the gradient generally improves resolution.the separation of insulinvariants which wereA. cytochrome c subunitsB. Re-chromatography of a fraction collected from theseparated with a solventmiddle of chromatogram A.change of 0.15% perColumn: C4 wide pore, 4.6 x 250 mmminute. A gradient slope(Reference 8)as low as 0.05% per minuteB. 35 - 45% ACN, 40 minmay be used for maximumslope 0.25%resolution.A reduction of theA. 25 - 50% ACN, 50 mingradient slope toslope 0.5%improve resolution mustbe tempered with theneed for keepinganalysis time as short aspossible. However,adjusting the gradientslope is important inoptimizing resolution ofproteins and peptides.www.ace-hplc.comPage 13
Mobile PhasePeptides sometimes exhibit a peculiar behaviour as the gradient slope is decreased(Figure 16). Instead of improving resolution as expected, resolution is sometimesreduced leading to coelution and, sometimes, even a reversal of elution order. Inthe example in Figure 16, peptides 11 and 12 are best separated with a 45 minutegradient. When the gradient time is extended to 90 minutes, resolution betweenpeptides 11 and 12 decreases and, with a gradient of 160 minutes, the two peptidescoelute. This retention behaviour is due to effects of the peptide-surface interaction,the cause of which is not well understood. It is, therefore, important whendeveloping peptide separations, particularly when separating protease digestsamples, to observe changes in resolution as the gradient slope is decreased. Ifresolution decreases instead of increasing then the slope must be carefullyoptimized to maximize overall resolution.Figure 16. Resolution between peptides sometimes decreases as the rate of changein the solvent concentration decreases (gradient time is increased). This can lead toreduced resolution or coelution, as exemplified by peptides 11 and 12 in the peptide mapof human growth hormone. In some cases peptides may even reverse elution order.(Reference 10)Sample. Tryptic digest of human growth hormone. Shown is a part of the peptide map.45 min90 min121112160 min11 1211Column: C18 wide pore, 4.6 x 150 mmEluent: Gradient: 0 - 60% ACN over time as indicated with 0.1% TFA in the aqueoussolvent and 0.08% TFA in the organic solvent forming the gradient.Page 14www.ace-hplc.com
Mobile PhaseThe reversed-phase chromatography of proteins and peptides requires a reagent,called an “ion-pair”, added to the mobile phase in order to achieve good peak shape.It is believed that metal impurities on the silica surface are responsible for poorprotein/peptide peak shape in the absence of an ion-pair reagent.Trifluoroacetic acid. The most commonly used ion-pair reagent is trifluoroaceticacid (TFA). TFA added to the mobile phase at a concentration of 0.1% results ingood peak shape on most columns (Figure 17). Lowering the concentration of TFAimproves LC-MS detection sensitivity (see pages 22 - 25) but may result in poorpeak shape on silica columnsFigure 17. The effect of TFA concentrationsbecause of impurities on the silicaon peak shape and selectivitysurface (Figure 17B). High purityB. Vydac 218TPsilica columns, however, can be used A. ACE 5 C18 - 300HighpuritysilicaLowerpurity silicaat very low concentrations of TFA0.1% TFA(Figure 17A - 0.01% TFA).The TFA concentration mayaffect peptide selectivity. InFigure 17A (high purity silica), twopeptides coelute with a TFAconcentration of 0.1% but areresolved with a TFA concentrationof 0.01%. (In Figure 17B - lowerpurity silica - the two peptidesremain unresolved). Generally,varying the concentration of TFAfrom 0.2% to 0.01% may improvethe selectivity of peptide separationson high purity silicas. Theconcentration of TFA may also beincreased to solubilize hydrophobicproteins or peptides, however somecolumns may not be stable at TFAconcentrations higher than 0.1%.1&2311&230.01% TFA2331&2Eluent: Gradient 20 - 32% ACN in 15 min withTFA as indicatedSample. 1. Angiotensin II 2. Angiotensin III3. Angiotensin Iwww.ace-hplc.comPage 15
Mobile PhaseAlternative ion-pair reagents. Although TFA is by far the most commonly usedion-pair reagent, other reagents such as phosphoric acid and heptafluorobutyric acid(HFBA) are sometimes used in protein/peptide separations.As illustrated in Figure 18, phosphoric acid can sometimes separate peptides that arenot separated by TFA. Phosphate is used at concentrations around 20-30 mM,pH 2 - 2.5. Phosphate buffers have also been shown to offer better separations ofsome proteins than TFA. While phosphate buffer is usually used at low pH like TFA,phosphate buffers can also be adjusted to higher pH, providing an opportunity tochange selectivity and resolution (see page 17). The principal drawback of usingphosphate as an ion-pair reagent is that it is not volatile, making it difficult to removefrom the peptide.Heptafluorobutyric acid is sometimes used as an ion-pair reagent for basic proteinssuch as histones (Reference 9).Figure 18. The use of ion-pair reagents other than TFA may result in different selectivityConditionsColumn: C18 wide pore, 4.6 x250 mmEluent:A. Gradient 4 - 40% ACN in 18min with 0.1% TFA, pH 2B. Gradient 4 - 40% ACN in 18min with 20mM phosphoricacid, pH 2Sample.1. bradykinin2. neurotensin3. bombesin4. eledoisinA. 0.1% TFA41B. 20 mM phosphoric acid10Page 162, 3246www.ace-hplc.com843210121416 min
Mobile PhaseThe effect of pH on peptide retention. Reversed-phase mobile phases used forpeptide separations are generally adjusted to low pH, whether using TFA, phosphoricacid or other ion-pair reagents. At low pH, carboxylic acid groups - the carboxyterminal group and the side chains of aspartic and glutamic acid - will be protonatedand only slightly polar. Increasing the mobile phase pH to 6 -7 will cause thecarboxylic acid groups to ionize, making the peptide less hydrophobic. This reducesthe retention of all peptides, but particularly affects peptides containing aspartic orglutamic acid (Figure 19). The retention of aspartic and glutamic acid containingpeptides will be reduced more than other peptides, thus changing selectivity.Although increasing the mobile phase pH for peptide separations is not usedfrequently, it can be useful in certain cases (see page 36 for an example).Figure 19. The pH of the mobilephase affects peptide retention,particularly of those containingacidic amino acid residues(aspartic and glutamic acids).A. 0.1% TFA, pH 2.01&2ConditionsColumn: ACE 5 C18-300 , 4.6 x250 mmEluent:A. Gradient 20 - 32% ACN in 15min with 0.1% TFA, pH 2B. Gradient 20 - 32% ACN in 15min with 10mM NH4OAc, pH 7Sample.1. Angiotensin II2. Angiotensin III3. Angiotensin I33B. 10 mM NH4OAc, pH 7.021024www.ace-hplc.com68101214 minPage 17
Mobile PhaseFlow rate. The mobile phase flow rate has little effect on reversed-phase HPLCresolution. As illustrated in Figure 20, the resolution of peptides from a tryptic mapis about the same when using flow rates of 0.5, 1.0 or 2.0 ml/min. The gradientvolume however, must be constant in order to maintain the resolution. This requiresreducing the gradient time as the flow rate is increased. The system pressureincreases as the flow rate is increased and pressure may limit the flow rate that can beused. Higher flow rates also decrease detection sensitivity slightly but may increasesolubility of large or hydrophobic proteins.Figure 20. The mobilephase flow rate has littleeffect on peptide resolution.The total gradient volumemust be held constant asflow rate is changed in orderto maintain resolution.ConditionsColumn: C18 small pore,4.6 x 250 mmEluent: 10 - 50%acetonitrile with 0.1%TFA over time and withflow rate as indicatedSample. tryptic digest of -lactoglobulin2 ml/min, 20 min057.51012.5 min1 ml/min, 40 min0510152025 min304050 min0.5 ml/min, 80 min0Page 182.51020www.ace-hplc.com
DetectionWhen separating polypeptides by reversed-phase HPLC, detection is normally byUV absorption at 214-215 nm. The peptidebond absorbs well in this wavelength rangeFigure 21. The increasingconcentration of acetonitrile duringand provides the most sensitive detection fora gradient changes the dielectricpolypeptides of all types.constant of the mobile phase whichresults in an increasing baseline dueto a shift in the absorbance spectrumof TFA. (Reference 11)One concern when using the low UV regionfor detection is absorbance by the mobilephase. Acetonitrile does not absorb UV lightat 215 nm, however TFA absorbs slightlyUV absorbancein this region. During gradient elution, theincreasing concentration of organic solventcauses the dielectric constant of the solutionto change which results in a shift in the0 10 20 30 40 50 60 70absorbance spectrum of TFA in the low UVPercentage acetonitrileregion. This absorbance shift results in anupward drift of the baseline as illustrated in Figure 21. It is particularly noticeablewhen sensitive detection is required. As an example, peptide maps will often displayan increasing baseline(Figure 22). A commonFigure 22. A baseline shift may be seen in a peptide mappractice to avoid thisdue to the change in TFA absorbance as the organicbaseline shift is to reducesolvent concentration increases.the TFA concentration inthe organic solventrelative to the aqueoussolvent. If 0.1% TFA isadded to the aqueoussolvent, then 0.08-0.09%TFA is added to theorganic solvent. Thisresults in a flatterbaseline during peptidemap elution.www.ace-hplc.comPage 19
Effect of TemperatureColumn and mobile phase temperature canaffect peptide separations in two ways.Retention is reduced slightly with increasedtemperature. However, more importantly, therelative retention (selectivity) of peptide pairsdepends on the temperature. Changes inselectivity with temperature affects resolutionand temperature can be an important factor inoptimizing the separation of a series ofpeptides, such as those produced during theprotease digestion of a protein. The separationof a series of synthetic peptides as a functionof temperature is shown in Figure 23. Peptideretention decreased slightly as the temperaturewas increased but, more importantly,resolution between peptide pairs changed withthe changes in temperature.It is therefore important to control thetemperature of column and mobile phasewhen separating peptides. Temperature is alsoan important variable to optimize whendeveloping peptide separations, particularlyseparations of peptide maps.Figure 23. Increasing thetemperature reduces the retentionof peptides. More importantly, thetemperature affects the relativeretention or selectivity, which affectsresolution18O C21O C25O C10203040 50 minConditionsColumn: C8, 2.1 x 150 mmMobile phase: Gradient from 0 to30% acetonitrile in 0.05% TFA over60 minutesSample: synthetic helical andnonhelical peptides (Reference 12)The separation of peptides in a peptide mapcan be significantly affected by temperature as shown in Figure 24. In this exampleof the separation of peptides from the tryptic digest of human growth hormone,raising the temperature of the column not only affects peptide selectivity but can alsocause a reversal on elution order. Peptides 7 and 8 are much better resolved at highertemperatures. Peptides 11 - 13 are best resolved at 40O C and raising the temperatureto 60O C causes peptides 11 and 12 to nearly co-elute. Peptides 14 and 15 are wellresolved at 20O C with peptide 15 eluting first. Raising the temperature to 40O CPage 20www.ace-hplc.com
Effect of TemperatureFigure 24. The relative retentionof peptides from the digestion ofa protein is often significantlyaffected by the temperature.87ConditionsColumn: C8 wide pore, 4.6 x150 mmMobile phase: Complexgradient from 0 to 60%acetonitrile in 0.1% TFA over60 minutesSample:Tryptic map of human growthhorm
from protease digestion of proteins (see pages 26 - 31) as well as the separation of natural and synthetic peptides. A less hydrophobic phase results from the attachment of butyl (C4) groups to the silica surface (Figure 10B). The butyl phase is most suitable for protein separations but can also be used to separate large or hydrophobic peptides.