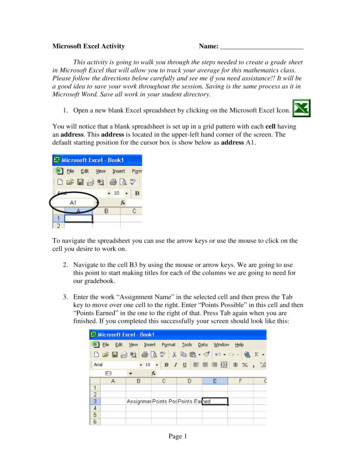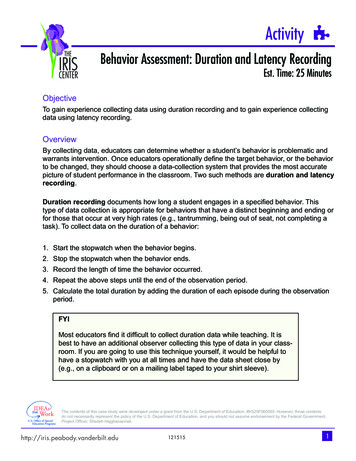
Transcription
Excel Spreadsheet ActivityObjective The students will create a double bar graph in Excel by using the ChartWizardThe students will format the graph by changing colors and fonts on.ActivityToday we are going to learn how to make a double bar graph. Charts andgraphs display data in a visual way and make it easier to interpret the data.Making charts can be beneficial in subjects other that math. Today, we will usean example from your social studies class. You are studying the development ofthe Olympics. We will create a chart showing how many women and men tookpart in the different winter Olympics.1
Direction1. Open Excel Go to the File menu. Click on Open. Open the file OlympicExcel by double clicking on it. You will see this The numbers of the games are in column A. It is in Romannumerals because that is how the Olympics number their games. Column B contains the number of female athletes in each game. Column C contains the number of male athletes in each game.2. Open Chart Wizard2
Select the data by left clicking on the mouse in the left top corner, A1, andgo down to the right bottom corner of the data, C20. The data will behighlighted. Click on the graph wizard in the tool bar. It lookslike this.3. Chart Wizard - Step 1.Click on the second chart. (The one in the middle of the top row) It will behighlighted like this: Click on Next.3
4. Chart Wizard – Step 2It will look like this click on Next.4
5. Chart Wizard – Step 3 In the chart title box, type Winter Olympic Games. In the Category (Y) axis, type Athletes. In the Value (Y) axis, type Games. Click Next.5
6. Chart Wizard – Step 4 Click on As new sheet option button.Click on Finish (The original data is in sheet 1 you can go back to it byusing the tab on the bottom of the screen).Your chart school look something like this: You can now change the look of you chart. 6
7. Change Colors and PatternChange background Start with changing the color of the plot area.Double click in the plot area. (The gray background area) This menuwill come up.Click on a color you prefer for your Plot Area.Click OK.Change Pattern Double click on one of the burgundy (male) bars in your graph.7
Click on a color you prefer for your male part of the bar.Click OK.Double click on one of the purple bars in you chart (female).Click on a color you prefer for your female part of the bar.Click on Fill Effect. Click on the Pattern tab. Pick a pattern you think is appropriate. Click OK.8
8. Format the Legend Double click on the legend. This is the legend: Click on the Font tab. Pick a font and size you think is appropriate.Click on OK.9
9. Change the font on the x-axis. Double click on the on the x-axis.Click on Font. Scroll down the menu to Times New Roman. Click on Times NewRoman.Click OK. 10
10. Change the Font and Color on the Title Click on Pattern tab.Double click on the title. Click on the color you prefer for the background.Click on Font.Pick a size and font you think is appropriate.11. Print Out Your Graph Click on File in the toolbar.Click on Print.11
Excel Spreadsheet Activity Objective The students will create a double bar graph in Excel by using the Chart Wizard The students will format the graph by changing colors and fonts on. Activity Today we are going to learn how to make a double bar graph. Charts and graphs display data in a visual way and make it easier to interpret the data. Making charts can be beneficial in subjects .