Transcription
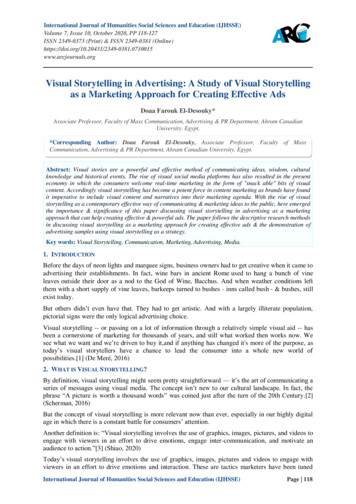
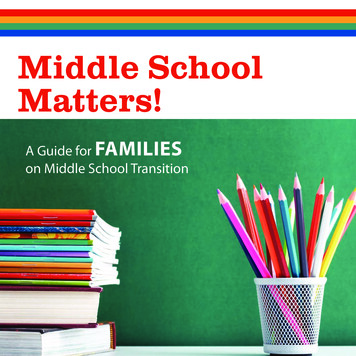
OVERVIEW The rationale behind using visual aids Tips for preparing effective visual aids Preparing effective PowerPoint slides Sample visual aids
VISUAL AIDS Enhance Understanding Add Variety Support Claims Have a Lasting Impact
HOW WE RECEIVE INFORMATION
HOW MUCH WE RETAIN
THE PURPOSE OF USING VISUAL AIDS Visual aids support your ideas and improve audiencecomprehension of your presentation Visual aids add variety to your presentation bygiving the audience a break from listening andletting them see something Visual aids help illustrate complex ideas or conceptsand are helpful in reinforcing your ideas
THE PURPOSE OF USING VISUAL AIDS Enliven a difficult/boring subject Make a presentation entertaining Help the presenter to stick to the intended plan
IT IS ALL ABOUT THE BRAIN!
TYPES OF AUDIO VISUAL AIDSPowerPoint slides Overheads/transperencies Videos Objects Models Photographs Drawings Other: handouts, brochures, posters etc.
ON PREPARINGVISUAL AIDS
Start with at least a rough outline / major points of thepresentation before selecting the visual aid(s). Your audio-visuals should be directly relevant to yourpresentation topic. Each element of an audio-visual must be simple andcontain only one message. Keep visual aids BRIEF. Determine the difference between what you will sayand what the visual aid will show. Do not read straightfrom your visuals.
Ask the audience to read or listen, not both; visual aidsshould not provide reading material while you talk. Account for production time in your planning andselection process. Never leave their preparation to thelast minute!
Use charts and graphs to support the presentation ofnumerical information. When preparing graphics, make sure they are not toocrowded in detail. If you have handouts, don't let them become adistraction during the presentation.
Practice presenting the full program using audiovisuals to be familiar with their use and order. Seek feedback on the clarity of your visuals and do soearly enough to allow yourself time to make neededadjustments. Your visual material should not contain grammar andspelling mistakes.
MAKING POWERPOINT SLIDESAvoiding the Pitfalls of Bad Slides
ADVANTAGES OF POWERPOINT SLIDES Projectsa professional image. Minimalexpense Compact Slideand portable.shows are easy to email. Visualseasily edited.
ADVANTAGES OF POWERPOINT SLIDES Allows easy insertion of graphics. Slide show can be printed, copied and providedas handout material during presentation. Expands options through the use of multimediasuch as animation, video clips and sound.
TIPS TO BE COVERED Outlines Slide Structure Fonts Color Background Spelling and Grammar Conclusions Questions
OUTLINE Present the outline of your presentation visually at thebeginning of your speech Ex:previous slide Follow the order of your outline for the rest of thepresentation Only place main points on the outline slide
SAMPLE: OUTLINE SLIDE
SLIDE STRUCTURE Use 1-2 slides per minute of your presentation Write in point form, not complete sentences Include 4-5 points per slide Avoid wordiness: use key words and phrases only
SLIDE STRUCTURE - BAD This page contains too many words for apresentation slide. It is not written in point form,making it difficult both for your audience toread and for you to present each point.Although there are exactly the same number ofpoints on this slide as the previous slide, it looksmuch more complicated. In short, youraudience will spend too much time trying toread this paragraph instead of listening to you.
SLIDE STRUCTURE – GOOD Show one point at a time: Willhelp audience concentrate on what you aresaying Willprevent audience from reading ahead Willhelp you keep your presentation focused
FONTS - GOOD Use at least an 18-point font Use different size fonts for main points andsecondary points thisfont is 28-point, the main point font is 32-point,and the title font is 44-point Use a standard font like Times New Roman orArial
SLIDE STRUCTURE - BAD Do not use distracting animation Do not go overboard with the animation Be consistent with the animation that you use
FONTS - BAD If you use a small font, your audience won’t be able to read what you have writtenCAPITALIZE ONLY WHEN NECESSARY. IT ISDIFFICULT TO READDon’t use a complicated font
COLOR - GOOD Use a color of font that contrasts sharply withthe background Ex: Use color to reinforce the logic of your structure Ex: blue font on white backgroundlight blue title and dark blue textUse color to emphasize a point Butonly use this occasionally
COLOR - BAD Using a font color that does not contrast with thebackground color is hard to read Using color for decoration is distracting and annoying. Using a different color for each point is unnecessary Usinga different color for secondary points is alsounnecessary Trying to be creative can also be bad
BACKGROUND - GOOD Use backgrounds that are simple Use backgrounds which are light Use the same background consistentlythroughout your presentation
BACKGROUND – BAD Avoid backgrounds that are distracting ordifficult to read from Always be consistent with the background thatyou use
GRAPHS Use graphs rather than just charts and words: Datain graphs are easier to comprehend & retainthan are raw data Trendsare easier to visualize in graph form
SPELLING AND GRAMMAR Proof your slides for: spelingmistakes the use of of repeated words grammatical errors you might have make If English is not your first language, please havesomeone else check your presentation!
CONCLUSION Use an effective and strong closing Your audience is likely to remember your last wordsUse a conclusion slide to: Summarizethe main points of your presentation Provide a sense of closure
QUESTIONS ? End your presentation with a simple questionslide to: Inviteyour audience to ask questions Provide a visual aid during question period Avoid ending a presentation abruptly
SAMPLE SLIDESBYGARR REYNOLDS
BEFOREAFTER
Less than 33%of U.S. adults are ata «healthy weight»
66% of Americansare obese or overweight.All adultsWomenMen134 million65 million69 million(66%)(62%)(71%)OECD Factbook 2007
90%of thefreshwaterin theworldis
ICE
DELIVERY OF VISUAL AIDS Tell your listeners what kind of visual you aredisplaying: “These Explain what the visual aid is designed to door show: “This are pictures of victims receiving CPR ”pie chart illustrates the distribution of ”Emphasize what the listeners should focus on: “Notice the blue segment that shows ”Comment on/interpret the visual: “Ascan be understood from this graph, ”
MORE SAMPLE SLIDES
GÖRSEL-İŞITSEL ARAÇLARıNİZLEYICI ÖNÜNDE KULLANıMı Görsel malzemelerinizigüvenli bir şekildekullanarak,dinleyicilerinizetablolarda, slaytlardaveya saydamlardakibilgileri kavramaları içinzaman tanıyın.Sunumunuzda gerekliolduğunu düşünerekişitsel malzeme ya davideo kasetlerdenyararlandığınızda,kullanım sırasında zamankaybetmemeye dikkatedin.
ALCOHOL, DRUGS AND FATIGUE alcohol: 30% of the injured driver are underthe influence of ALCOHOLfatigue: the legisltion is now only for professional driversdriving while drugged: is increasing in recent years methods for testing have to be developed on medical drugs that affect the drivingskills, the information is provided
Content highlights: Emotional eating Unhealthy dieting Smoking and weightcontrol
Drugsdo not really helppeople lose weight and keepit off. They can be addictive, andlead to dangerous physicalproblems if misused.
What’s Behind Population Growth Three Factors Fertility Infant Mortality Longevity Animal Domesticationand Agriculture Provided for a few tofeed many Industrial Revolution Growth of Cities andInfrastructure Water Energy Transportation Increased Productivity Nutrition Sanitation Medicine
Word that names APerson APlace A Thing An Idea
Life expectancy at birth, lSpainSwedenUnited KingdomUnited e1970-97(in .511.2Source: World Bank World Development Indicators (2000).
Music Is History reflects the times, country, andorigin of it’s creation Physical Education coordination of eyes,hands, fingers, lips, voice, facial, anddiaphragm muscles in response to thesounds heard and interpreted Art Use all of the technical aspects ofmusic to create emotion and beauty
Inattention BlindnessA narrowed scopeWhere drivers not using ahands-free cell phone looked.Where drivers using ahands-free cell phone looked.Source: Transport Canadansc.org
Joe, 12Bailey, Merideth,Hannah, Sara and KatieCady, 16Erica, 9Jean and Jay, 58Countless liveshave been lost as a result.Linda, 61nsc.orgJason, 38Lauren, 17Matt, 25Frances, 13Jordan, 18
Your audio-visuals should be directly relevant to your presentation topic. Each element of an audio-visual must be simple and contain only one message. Keep visual aids BRIEF. Determine the difference between what you will say and what the visual aid will show. Do not read straight from your visuals.