Transcription
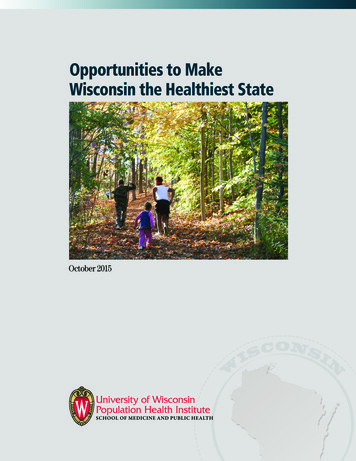
Opportunities to Make Wisconsin the Healthiest StateOpportunities to MakeWisconsin the Healthiest StateOctober 2015WIONSCS1IN
Opportunities to Make Wisconsin the Healthiest StateTable of ContentsIntroduction 1Overview of Report 2Key Findings 3Health Behaviors 4Clinical Care 8Social and Economic Factors 11Physical Environment 15Data Sources and References 17Funding for this report is provided by the Wisconsin Partnership Program, UW School of Medicine and Public Health(UWSMPH). Design by UWSMPH Media Solutions.Suggested citation: Hatchell K, Roubal AM, Catlin BB, Timberlake K. Opportunities to Make Wisconsin the Healthiest State,University of Wisconsin Population Health Institute, 2015.
Opportunities to Make Wisconsin the Healthiest StateIntroductionImproving broad health outcomes in Wisconsin – how long and how well people live – requiresimprovement in specific health indicators that span several health factor areas.The model below, from the County Health Rankings & Roadmaps, shows four modifiable categories, or“health factor areas,” that influence health outcomes. These areas are: health behaviors, clinical care,social and economic factors, and the physical environment. Each area, and the specific indicatorswithin that area, contributes to the health and well-being of individuals and the community overall.In this report, the Making Wisconsin the Healthiest State team examines multiple interrelated indicatorswithin the four health factor areas. We compare Wisconsin’s performance overall to that of thehealthiest and least healthy states in the nation, and to one of our neighboring states, Minnesota.We use this analysis to identify opportunities to improve Wisconsin’s health and make progress towardthe goal of becoming the healthiest state.This report is part of a series produced by the University of Wisconsin Population Health Institute.It brings attention to how Wisconsin compares with other states – and with the nation overall – onleading health indicators (https://uwphi.pophealth.wisc.edu/). In addition to this report, the healthof subgroups within the state’s population, defined by race, gender, geography, and education, aswell as overall disparities in health outcomes in Wisconsin, is available in the “Health of WisconsinReport Card.” To see Wisconsin’s health trends over the past ten years on 20 leading health indicators,the “Wisconsin Health Trends: Progress Report” is available. For information regarding programsand policies that have been used to address key health indicators, see “What Works? Policies andPrograms to Improve Wisconsin’s Health” and www.whatworksforhealth.wisc.edu.1
Opportunities to Make Wisconsin the Healthiest StateOverview of ReportIn this report, the most current data available is presented for selected indicators in the four healthfactor areas: health behaviors, clinical care, social and economic factors, and the physical environment.Data is reported on between seven and eighteen indicators within each health factor area. Each indicatoris presented in a consistent format that places the best values on the right, comparing the results for: Wisconsin The United States The best and worst states, and Minnesota, our healthier neighboring state Here is an example graphic depicting one of the rcent of children (0-17) in povertyThe ongoing stress and challenges associated with poverty can lead to cumulative negative effects onhealth, both physical and mental. The state with the lowest percentage of children living in poverty isclassified as the “best.” New Hampshire has the lowest percentage of children in poverty at 11%, whileMississippi has the highest percentage of children in poverty at 34%, making Mississippi the “worst”state for this indicator. With 18% of children living in poverty, Wisconsin performs better than theUnited States as a whole. Across the United States, 22% of children live in poverty. However, Wisconsindoes not perform as well as Minnesota, where 14% of children live in poverty.One important caveat is that the results presented in this report focus on Wisconsin overall; theydo not indicate the extent of differences in health determinants between population subgroups(e.g., subgroups defined by race/ethnicity, gender, education, income, geographic location, or age).Consideration of such differences is important. Several of these differences are highlighted in the“Health of Wisconsin Report Card” or in the additional Wisconsin Health Trends: Progress Reportmaterials online.Wisconsin’s performance on important health indicators as compared to the nation and to Minnesotaserves as a useful guide when examining opportunities to improve Wisconsin’s health. Wisconsin’sgreatest opportunities may be where Wisconsin’s current results fall below the US average, or whereWisconsin performs better than the US average but worse than Minnesota. To identify ways toimprove Wisconsin’s health and reduce health disparities, the “What Works? Policies and Programsto Improve Wisconsin’s Health” report and online database highlight what we know about theeffectiveness of many policies and programs that affect health.2
Opportunities to Make Wisconsin the Healthiest StateKey FindingsWisconsin’s strengths include high school completion among young adults, a low percentage of costburdened renters, a small percentage of individuals living in overcrowded housing, a high score foroverall quality of health care, and a comparatively low number of children without health insurance.However, Wisconsin clearly has room to improve in many other areas, such as problematic alcohol use,deaths from falls, and access to exercise opportunities. Because no state is the best in all factors, eventhe healthiest can still get healthier. Even being among the best performing states (better than the USand Minnesota) may not be “good enough.” For example, Wisconsin ranks 6th among all states for thepercentage of adults meeting physical activity guidelines, yet a large number of Wisconsin adults (43%)do not meet recommended levels of physical activity.The table below summarizes Wisconsin’s strengths and challenges across the four health factor areas: One indicator Better than MinnesotaHealth Factor AreaFactors (# of indicators)Number of WIIndicators betterthan USNumber of WI Indicatorsworse than USHealth BehaviorsTobacco Use (2) Diet and Exercise (10) Alcohol and Drug Use (2)Clinical CareSocial and Economic FactorsPhysical Environment Sexual Activity (4) Access to Care (9) Quality of Care (3) Education (5) Employment (1) Income (3) Family and Social Support (3) Community Safety (5) Air and Water Quality (2) Housing and Transit (5) 3
Opportunities to Make Wisconsin the Healthiest StateHealth BehaviorsIndividual health behaviors – such as smoking, diet and nutrition, physical activity, and alcohol anddrug use – are important determinants of health. Nearly half of all preventable deaths in Wisconsineach year can be attributed to a handful of health-compromising behaviors.Tobacco UseSmoking is a frequentcause of preventabledeath. Its negativeimpact is not only wellestablished for thosewho smoke, but also forthose who breathe insecondhand smoke.WorstBestWVUTUS WI MN30%25%20%15%10%5%Percent of adults who currently smokeBestWorstKYWI US65%70%75%MN80%UT85%90%95%Percent of homes with a smoking ban(two-parent household in which both parents reported a ban or a single-parent householdin which the parent reported a ban)Diet and ExerciseA nutrient poor diet,excess consumptionof calories, and lowlevels of physicalactivity are major causesof obesity, a range ofchronic health conditions,and premature death.Healthy behaviors areespecially important earlyin life, as they influencelater health outcomes. Forexample, breastfeedingprovides infants withessential nutrients, hasbeen shown to reducechildhood obesity, andimproves the health ofmothers.Additionally, measuressuch as access to healthyfoods and participationin physical activity showthe relationship betweencommunity conditionsand individuals’ likelihoodto eat well and engagein leisure time 80%85%CA90%95%Percent of children who are ent of children (10-17) who are obese or overweightWorstBestAR75%70%WIUS65%MNHI60%Percent of adults who are obese or overweight55%
Opportunities to Make Wisconsin the Healthiest StateHealth Behaviors (continued)Diet and Exercise(continued)BestWorstMS50%US60%WI MN70%NJ80%90%100%Percent of population with adequate accessto locations for physical activity(Living less than ½ mile from a park, less than 1 mile from a recreational facility in urban areas,or less than 3 miles from a recreational facility in rural areas)WorstBestMSUS60%65%70%WI MNCO75%80%85%Percent of adults who participated in anyphysical activity in the past nt of adults meeting recommendedlevels of physical activity(150 minutes or more of moderate to vigorous physical activity weekly)WorstBestMS25%US20%15%WIMNND10%5%Percent of population that is food insecure5
Opportunities to Make Wisconsin the Healthiest StateHealth Behaviors (continued)Diet and Exercise(continued)BestWorstMN USNM14%12%10%8%WINY6%4%2%Percent of population with limited access to healthy foods(Percent of population that is low-income and lives farther than1 mile from a grocery store in urban areas or 10 miles in rural areas)WorstBestLAWI65%MN US71%OR77%83%Percent of adults eating vegetablesone or more times per dayWorstBestUS MN WIAR45%50%55%60%CA65%70%75%Percent of adults eating fruits one or more times per dayAlcoholand Drug UseHeavy consumptionof alcohol and illegalsubstances can lead toviolence, injury, liverdisease, cancer, andpremature death.WorstBestUSWI MNRI13%12%11%10%9%8%7%AL6%5%Percent of adolescents (12-17) who use illicit drugsBestWorstND25%WI MN23%21%US19%17%TN15%13%11%Percent of adults that are excessive drinkers64%9%
Opportunities to Make Wisconsin the Healthiest StateHealth Behaviors (continued)Sexual ActivityHigh risk sexual practices(e.g., without the useof condoms) leadto increased risk fortransmission of a numberof sexually transmitteddiseases (STDs). STDs canaffect the health of men,women, and unbornchildren.Risky sexual behaviorcan also lead tounwanted pregnancies.Births to teens are ofparticular concernbecause the impacts arelong lasting. Fewer than4 in 10 teen mothers geta high school diplomaby age 22. And, childrenborn to teen mothersscore significantly loweron school readinesstests including mathand reading. This canaffect future educationalattainment andeconomic well-being,as well as future en birth rate (per 1,000 15-19 year olds)WorstBestLA200US180160140120WI MN10080NH6040200Gonorrhea rate (per 100,000 philis rate (per 100,000 population)WorstBestAK850US WI750650550450MN350NH250150Chlamydia rate (per 100,000 population)7
Opportunities to Make Wisconsin the Healthiest StateClinical CareHealth care can both save lives and improve quality of life. Governmental public health also plays animportant role in promoting, protecting, and restoring health.Access to CareHaving adequate coveragefor preventive, acute, andchronic care has beendemonstrated to increasethe likelihood that healthcare services will be accessedtimely, and in most costeffective and appropriatesettings. In addition totracking health insurancecoverage, it is also importantto assess the overall affordability of health care, as wellas access to services whereaccess barriers continue toexist even for those withhealth insurance coverage,including dental servicesand mental health services.BestWorstUSNV18%16%14%12%10%MN WI8%6%MA4%2%0%Percent of children (0-17) without health cent of adults (18-64) without health insuranceWorstBestUSAR55%60%65%WI MN70%RI75%80%85%Percent of children (19-35 months) who receivedrecommended %9%7%5%Percent of adults not receiving care in the last year due to cost8
Opportunities to Make Wisconsin the Healthiest StateClinical Care (continued)Access to Care(continued)WorstBestARNote: For measures markedwith a *, evidence suggeststhat the highest and lowestvalues for these indicatorsmay not necessarilyrepresent the “best” and“worst” values for states.50%US55%60%WI65%MN MA70%75%80%Percent of adults who had a dental visit in the last yearBestWorst40455055MAUS MNWINV60657075808590*Dentists per 100,000 populationBestWorstALWI70120US MN170MA220270320370420470*Mental health providers per 100,000 populationBestWorstIDMNUS WI80100120140MA160180200*Primary care physicians per 100,000 populationBestWorstMO WI MN01020HIUS30405060708090100110120130140150State level public health spending per person9
Opportunities to Make Wisconsin the Healthiest StateClinical Care (continued)Quality of CareHaving access to healthcare will only improvehealth if the careprovided is safe, effective,patient-centered, andtimely.BestWorstOK30354045WI NHMNUS5055606570Agency for Healthcare Research and Quality MeterScore for Overall Quality of CareBestWorstOKUS55%MN60%WI65%MA70%75%Percent of female Medicare enrollees (67-69)who receive mammography ventable hospitalizations per 1,000 Medicare enrollees10
Opportunities to Make Wisconsin the Healthiest StateSocial and Economic FactorsResearch regarding the many ways in which social and economic factors influence the health ofindividuals and at the community level continues to grow. Although the precise magnitude of theseeffects is unknown, these factors have greater influences on health than any other single category.Social and economic factors have a bidirectional relationship with health. For example, healthierindividuals are able to work, and working individuals generally have better health outcomes dueto increased income and access to health insurance.EducationThere is a well-knownrelationship betweenincreased education andpositive health outcomes.This occurs throughseveral mechanisms, suchas higher income, greaterknowledge regardinghealth behaviors, higherhealth literacy, andincreased access tohealth care.BestWorstNVUS MNWI30%35%40%45%CT50%55%60%65%Percent of children ages 3 and 4 enrolled in preschoolBestWorstMSMNUS WI20%25%30%35%MA40%45%50%Percent of fourth graders who are proficient readersWorstBestLA78%MN WIUS80%82%84%86%HI88%90%92%Percent of adults (18-24) with a high school 96%Percent of adults (25 and older) with a high school cent of adults (25 and older) with a college degree11
Opportunities to Make Wisconsin the Healthiest StateSocial and Economic Factors (continued)EmploymentEmployment affectshealth through income,health benefits, pensionplans, and other pathwaysto financial security.Higher levels of health areassociated with increasedjob control and security,less stress, and safer workenvironments (e.g., lowerexposures to danger ortoxins).IncomeIncome and healthhave a well-establishedreciprocal relationship;higher income leads tobetter health and betterhealth leads to higherincome. Children whogrow up in poverty aremore likely to sufferfrom injuries, physicalinactivity, and chronicdiseases such as asthma.BestWorstNV, MSUS8%7%WI6%MN5%ND4%3%2%Percent of workforce that is cent of children (0-17) in %1%Percent of children (0-17) living in low-incomehouseholds where no adult worked in the past yearWorstBestMS 35,000WI US 45,000 55,000MNMD 65,000Median household income12 75,000
Opportunities to Make Wisconsin the Healthiest StateSocial and Economic Factors (continued)Family and SocialSupportResearch shows thatpeople who have greatersocial support, lessisolation, and greaterinterpersonal trust livelonger and healthierlives. Those who havegreater social supportexperience lower levelsof anxiety and depressionand show reducedtendencies toward stressrelated behaviors, such asovereating and smoking.BestWorstND WI MN US35%UT30%25%20%15%Percent of total population living aloneBestWorstMTWI2523211917US MN15NJ1311975Suicide rate (per 100,000 population)BestWorstLAUS15%20%WI MN25%30%UT35%40%45%Percent of population (age 16 and older)that volunteered last yearCommunity SafetyViolence and abuse notonly have a physicaleffect on health (withthe injuries and fatalitiesthat they cause), but theyalso have a significantpsychological effect onvictims and residents ofhigh crime areas. “Deathsfrom falls” primarilymeasures injury rates inolder adults, a leadingcause of death. Othermeasures of safety areknown to influence healthoutcomes. For example,motor vehicle accidentsare a leading cause ofinjury and death, andseatbelt use is known toreduce fatality ent crime rate (per 100,000 population)BestWorstLA14US12108WI MN NH6420Homicide rate (per 100,000 population)BestWorstVT17.5WI MN15.0US12.510.0AL7.55.02.5Deaths from falls per 100,000 population13
Opportunities to Make Wisconsin the Healthiest StateSocial and Economic Factors (continued)Community MN MA0.80.60.4Traffic fatalities per 100 million miles t of total population that uses seatbelts14OR100%
Opportunities to Make Wisconsin the Healthiest StatePhysical EnvironmentWhere we live is important to our health throughout our lives. Many aspects of the physicalenvironment can act as facilitators or as barriers to health. For example, affordable housing can makeit possible to spend income on health insurance, healthy food, or education. Additionally, health canbe seriously negatively affected when known toxins – such as lead, bacteria, and ozone – exceedrecommended levels in individuals’ homes, and air and water supplies.Air and Water QualityAir and water pollutionare the two most commonenvironmental factorsthat can impair health.They have been linkedto increased respiratorydisease, gastrointestinaldisorders, and other formsof illness.BestWorstCA16US WI1412MN10AK864Air quality(number of days per year above PM2.5 limit)BestWorstNY30%USMN CTWI25%20%15%10%5%0%Water quality(percent of population exposed over health-based limits)Housing and TransitA community’s availablehousing options and transitsystems affect where welive and how we get fromhome to work, stores,or locations for exercise.Unsafe and costly housingnegatively affects healthby exposing residents torisks such as lead paint, andby creating an economicburden for the household,making it more difficultto afford other thingsthat positively influencehealth such as healthyfood or health insurance.Conversely, communitiesthat have walkable andbikeable infrastructurescan confer health benefitsthrough exercise andreduced sedentary time.BestWorstAL90%WI MN US85%80%NY75%70%65%60%55%50%Percent of workers (16 and older) who drive to work aloneBestWorstWINY60%50%MN US40%NV30%20%10%0%Homes built before 1960BestWorstHI3.5%3.0%US2.5%2.0%1.5%1.0%MN WI WV0.5%0.0%Percent of total population living in overcrowded housing( 1.5 occupants/room)15
Opportunities to Make Wisconsin the Healthiest StatePhysical Environment (continued)Housing and Transit(continued)BestWorstCAUS55%MN WI50%SD45%40%35%Cost-burdened renters(rent costs and utilities exceed 30% of ed homeowners(housing costs exceed 30% of income)16ND20%15%
Opportunities to Make Wisconsin the Healthiest StateData Sources and ReferencesMeasureYearSourceAHRQ Meter Score of Overall Quality of Care2013Agency for Healthcare Research and QualityAir quality - number of days per year about PM2.5 limit2014America's Health RankingsChlamydia rate (per 100,000 population)2013STD Surveillance, CDCCost-burdened homeowners (housing costs more than 30% of income)2013American Community SurveyCost-burdened renters (rent costs more than 30% of income)2013American Community SurveyDeaths from falls per 100,000 population2013CDC WonderDentists per 100,000 population2014America's Health RankingsGonorrhea rate (per 100,000 population)2013STD Surveillance, CDCHomes built before 19602013American Community SurveyHomicide rate (per 100,000 population)2013CDC WONDERMedian household income2013American Community SurveyMental health providers per 100,000 population2014National Provider Identification FilePercent of adolescents (12-17) who use illicit drugs2013Kids Count Data Center, Annie E. Casey FoundationPercent of adults (18-24) with a high school diploma2013American Community SurveyPercent of adults (18-64) without health insurance2013Kaiser Family FoundationPercent of adults (25 and older ) with a college degree2013American Community SurveyPercent of adults (25 and older) with a high school diploma2013American Community SurveyPercent of adults eating fruits one or more times per day2013Behavioral Risk Factor Surveillance SystemPercent of adults eating vegetables one or more times per day2013Behavioral Risk Factor Surveillance SystemPercent of adults meeting recommended levels of physical activity2014Division of Nutrition, Physical Activity and Obesity, CDCPercent of adults not receiving care in the last year due to cost2013Behavioral Risk Factor Surveillance SystemPercent of adults who are heavy drinkers2013Behavioral Risk Factor Surveillance SystemPercent of adults who are obese or overweight2013Behavioral Risk Factor Surveillance SystemPercent of adults who currently smoke2013Behavioral Risk Factor Surveillance SystemPercent of adults who had a dental visit in the last year2014America's Health RankingsPercent of adults who participated in any physical activity in the past month2013Behavioral Risk Factor Surveillance SystemPercent of children (0-17) in povertyPercent of children (0-17) living in low-income households where no adultworked in the past yearPercent of children (0-17) without health insurance2013Small Area Income and Poverty Estimates2013Kids Count Data Center, Annie E. Casey Foundation2012County Health RankingsPercent of children 19-35 months receiving recommended vaccines2014America's Health RankingsPercent of children ages 3 and 4 enrolled in preschool2013"Education Counts." Editorial Projects in Education. Edcounts.orgPercent of children who are breastfed2014CDC: Division of Nutrition, Physical Activity and ObesityPercent of children who are obese or overweightPercent of female Medicare enrollees (67-69) that receive mammographyscreeningPercent of fourth graders who are proficient readers2011-2012National Survey of Children's Health2012Dartmouth Atlas of Health Care2013Kids Count Data Center, Annie E. Casey FoundationPercent of homes with a smoking ban2009-2010Preventing Chronic Disease, CDCPercent of population (age 16 and older) that volunteered last year2013Corporation for National and Community ServicePercent of population that are food insecure2012County Health RankingsPercent of population with adequate access to locations for physical activity2015County Health RankingsPercent of the population with limited access to healthy foods2010USDA Food AtlasPercent of total population living alone2013American Community SurveyPercent of total population living in overcrowded housing2013American Community SurveyPercent of total population that uses seatbelts2013NHTSA's National Center for Statistics and AnalysisPercent of workers (16 and older) who drive to alone to work2013American Community SurveyPercent of workforce that is unemployed2014Bureau of Labor StatisticsPreventable Hospitalizations per 1,000 medicare enrollees2013America's Health RankingsPrimary care physicians per 100,000 population2014America's Health RankingsState level public health spending per person2012-2013Trust for America's HealthSuicide rate (per 100,000)2013CDC WonderSyphilis rate (per 100,000 population)2013STD Surveillance, CDCTeen birth rate (per 1,000 15-19 year olds)2013Kaiser Family FoundationTraffic fatalities per 100,000 miles2013Insurance Institute for Highway Safety: Highway Loss Data InstituteViolent crime rate (per 100,000 population)2013The Federal Bureau of InvestigationWater quality - percent of population exposed over health-based limits2013-2014County Health Rankings17
healthiest and least healthy states in the nation, and to one of our neighboring states, Minnesota. We use this analysis to identify opportunities to improve Wisconsin's health and make progress toward the goal of becoming the healthiest state. This report is part of a series produced by the University of Wisconsin Population Health Institute.