Transcription
Oracle Essbase Aggregate StorageOption Benchmark on Oracle SunEnterprise M5000 ServerAn Oracle White PaperApril 2010
Oracle Essbase Aggregate Storage Option Benchmarkon Oracle Sun Enterprise M5000 ServerExecutive Summary . 3Introduction . 3Benchmark Objectives . 3Product Overview . 4Benchmark Scenario Overview . 5Key Benchmark Metrics . 6Benchmark Details . 6Benchmark Infrastructure Profile. 6Storage Configuration . 7Test Application Characteristics and Configuration. 8Essbase Aggregate Storage Database Configuration . 9Test Methodology . 10Workload Specification . 10Benchmark Results Summary . 12Conclusion . 19APPENDIX . 20Oracle Essbase Aggregate Storage BenchmarkPage 2
Oracle Essbase Aggregate Storage Option Benchmarkon Oracle Sun Enterprise M5000 ServerEXECUTIVE SUMMARYOracle Essbase is the industry-leadingIntroductionOLAP (online analytical processing) server.Business Intelligence (BI) systems are becoming more and more pervasive asstakeholders across organizations demand better transparency and visibility. Tosucceed in today’s fast-paced, extremely competitive business environment,organizations have to constantly re-invent themselves. Success in today dependson an organization's ability to convert the vast amounts of data in variousoperational systems, data marts, and data warehouses into information and thenderive intelligence from it. The key to addressing these business challenges isestablishing a business intelligence infrastructure that delivers valuable informationto employees, shareholders, customers and suppliers for timely, informed decisionmaking.Oracle Essbase provides an environmentfor rapidly developing custom analytic andenterprise performance managementapplications. With a rapid applicationdevelopment environment that is managedby the business, Oracle Essbase enablesthe business to quickly model complexbusiness scenarios.Oracle Essbase delivers key foundational technology to the business intelligenceinfrastructure for today’s dynamic fast paced organizations. Oracle Essbase is theleading online analytical processing (OLAP) server available today. Oracle Essbaseprovides an environment tailored for business users to rapidly develop customanalytic and enterprise performance management (EPM) applications. Engineeredfor scalability, security, and rapid-response, Oracle Essbase brings analytics to thebusiness user and enables the business to quickly model complex businessscenarios. Through an intuitive interface, business users can manipulate large datasets to model complex scenarios, forecast outcomes, and perform what-if analysesto identify trends and optimize business results. Together with other modules ofOracle’s EPM system, Oracle Essbase offers broad support for demandingbusiness intelligence analytics requirements.Benchmark ObjectivesThe objective of the benchmark is to showcase the ability for Oracle Essbase toscale in terms of user population and data volume for large enterprisedeployments. Typical administrative and end-user operations for OLAPapplications were simulated on Sun Server and Storage products to producebenchmark results.These benchmark test results demonstrate the following:Oracle Essbase Aggregate Storage BenchmarkPage 3
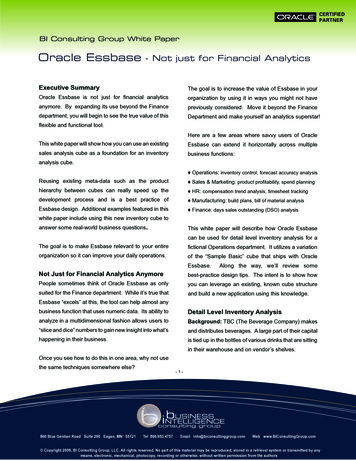
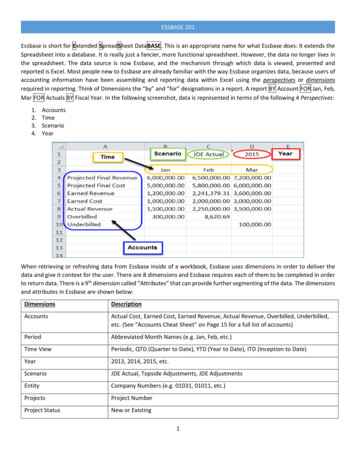
Oracle Essbase can support a named user population of 200,000 userswith the benchmark configuration. This assumes a 10 percentconcurrency rate for the 20,000 active concurrent users in the benchmark. Oracle Essbase running as a 64-bit application deployed onUltraSPARC64 VII powered Oracle Sun SPARC Enterprise M5000 serverrunning Oracle Solaris 10 can handle a large scale enterprise sales analyticsapplication with a database containing upwards of 1 billion records, 15dimensions and dimensions with millions of members. Oracle Essbase can easily scale to meet the needs of any demandingbusiness enterprise as demonstrated by the sub second query responsetime with 20,000 concurrent users and a large enterprise size Essbaseapplication.Product OverviewOracle Essbase is a multi-threaded OLAP database server that takes advantage ofsymmetric multiprocessing hardware platforms. All Essbase applicationcomponents, including database outlines and calculation scripts, applicationcontrol, and multidimensional database information, reside on a server. OracleEssbase provides two storage kernels for multidimensional databases, AggregateStorage Option (ASO) and Block Storage Option (BSO). Aggregate Storagedatabases typically address read-only, “rack and stack” applications that have largedimensionality. Using Aggregate Storage, Essbase serves a wide range of analyticneeds—financial analysis, planning, budgeting, sales analysis, marketing analysis,supply-chain analysis, and profitability analytics— all from a single analyticinfrastructure. Block storage databases provide robust support for write-back andcomplex calculation operations and are well suited for modeling and forecastingapplications. Essbase partitioning capabilities allow customers to take advantageof both storage technologies in a single application.Oracle Essbase products incorporate powerful architectural features to handle awide range of analytic applications across large multi-user environments. Figure 1provides a high-level view of the information flow between the three tiers of theEssbase architecture. The client tier includes Essbase Server clients, such as OracleHyperion Smart View for Office, Fusion Edition, Administration Services Consoleand Oracle Business Intelligence Enterprise Edition Plus. The middle tier includesservices, such as Oracle Hyperion Provider Services and Oracle EssbaseAdministration Services. Communication between the client and middle tiers isthrough HTTP and communication between the client and database tiers can beeither through TCP/IP or HTTP. Figure 1 High-level Information Flow betweenProduct ComponentsOracle Essbase Aggregate Storage BenchmarkPage 4
.Benchmark Scenario OverviewThe goal of this benchmark is to highlight how Oracle Essbase can supportpervasive deployments in large enterprises on Oracle Sun servers and storage, bysimulating an organization that needs to support a large Essbase Aggregate Storagedatabase with over one billion data items, large dimension with 14 millionmembers and 20,000 active concurrent users, each operating in mixed mode: adhoc reporting and report viewing. The Oracle Essbase Aggregate Storageapplication employed for this benchmark was designed to model a scaled outversion of a real customer financial business intelligence application.The benchmark simulated typical administrative and end-user operations in anOLAP application environment. Administrative operations include: dimensionbuild, data load, and database aggregation. Administrative operations weresimulated using scripts through administrative interfaces available with OracleEssbase. End-user testing modeled a total user population of 200,000 with 10percent of the users actively retrieving data from Essbase. Scripts were used tosimulate end-user reporting tasks. Think-time and time between iterations werebuilt into end-user simulations.The tests were performed on a single Sun SPARC Enterprise M5000 serverrunning Oracle Solaris 10 Operating system and Oracle's Open Storage array.These tests demonstrate scalability of Essbase and also provide a framework toenable customers to help reduce the risk, time, and complexity in deploying anOLAP solution.Oracle Essbase Aggregate Storage BenchmarkPage 5
Key Benchmark MetricsOracle Essbase supports extremely fastquery response times for vast numbers ofusers, for large data sets, and for complexbusiness models. The Oracle EssbaseAggregate Storage option demonstratessub-second response times for a simulatedThis section summarizes the key metrics captured during this benchmark exerciseon the Essbase Aggregate Storage database.Test NameTest DescriptionTest ResultsData Retrieval –20000 Activeconcurrent usersIn this test, user retrieval issimulated with MDX queryscripts against a tuned EssbasedatabaseAverage query responsetime: 1 secondDimension Build Loading 13 millionmembers to the“Customer”dimensionIn this test, dimensions andmembers are loaded to anEssbase database outline byusing a data source text filesand rules file.Total time to performDimension Build: 41MinutesData Load into - 1Billion Data Linesusing 6 LoadBuffers and 4 DataLoad Threads.In this test, data values areloaded to an Essbase databasefrom a text files based datasource and using rules file inparallel. Parallel data load wasachieved with the help ofmultiple load buffers.Overall Load Time: 269MinutesDatabasecalculation throughaggregation basedon tracked queriesIn this test, the data retrievalqueries are tracked andresulting set of proposedaggregate views arematerialized.Elapsed time toperform the databaseaggregation based ontracked queries 115Minutesenvironment with 20000 active concurrentusers reporting against a financialbusiness intelligence application.BENCHMARK DETAILSThe following sections describe the test infrastructure, test methodologies, anddetailed results for the benchmarking exercise.Benchmark Infrastructure ProfileThis section outlines the infrastructure profile employed in the benchmark tests.Oracle Essbase Aggregate Storage BenchmarkPage 6
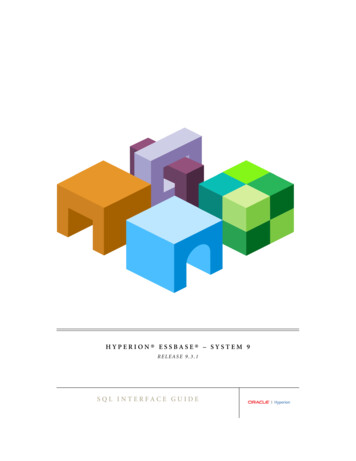
ComponentServer specificationOracle Essbase Server Oracle Sun SPARC Enterprise M5000 Server 4 X UltraSPARC64 VII , 2.53GHz (Quad Core)Oracle Essbase 2 threads/coreAdministration Server Solaris 10 10/09 (Update 8) 64 GB 4x 1Gb Ethernet ports Each core with own FPU 4 X Local SAS drives with 10000 and 15000 RPMLoad Generation –Windows Client - 8 server sLoadRunner Servers8 CPU24 GB MemoryEssbase StorageOracle Sun Storage F5100 – Flash Array Total 1 TB of disk storage – 40 Flash Modules Sun SPARC Enterprise M5000 server attached tothe Flash Array via SAS HBA with 2 SASchannels Oracle Solaris ZFS Data Storage Scheme Striped – RAID 0 2 Oracle Solaris ZFS file systems created from asingle Zpool of 1 TBThe storage employed for this benchmark is the Sun Storage F5100 Flash Array,the world's fastest solid-state Flash Array. It provides unprecedented performance& eco-efficiency as well as delivers the most efficient way to accelerate databaseapplications that doesn't require expensive tuning, power or space. It alsodecreases the latency and improves I/O response times for greater productivityand operational efficiencyThe table below shows the product versions used in benchmark tests.Product / Component NameVersionOracle EssbaseOracle Essbase AdministrationServicesOracle WebLogic11.1.1.3 – 64 bit11.1.1.3 - 64 bitHP LoadRunner 9.2 Maintenance Pack64 bit JVM 1.5 update199.5Storage ConfigurationSun Storage F5100 – Flash ArraySun Storage F5100 Flash Array is attached directly to Sun SPARC M5000 serverthrough SAS HBA. For this benchmark, 40 flash modules were employed witheach flash module having a capacity of 22 GB and using these flash modules asingle Zpool was created. Two ZFileystems were created from a single Zpool.Oracle Essbase Aggregate Storage BenchmarkPage 7
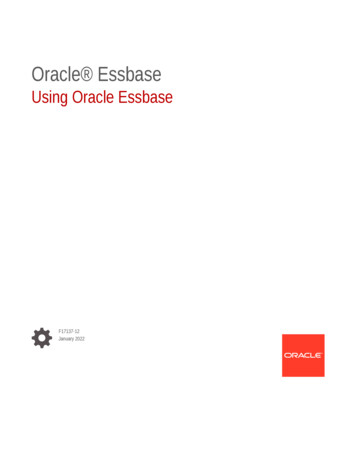
Sun Fire M5000Flash F5100LoadRunner client machinesTest Application Characteristics and ConfigurationThe Oracle Essbase Aggregate Storage application employed for this benchmarkwas based on a real customer application in financial industry with 13 Millionmembers in the customer dimension.This test application uses storage and dynamic hierarchy with up to 4-5 levels. Alldimensions were structured as stored hierarchy with the exception of “measures”dimension which is structured as dynamic hierarchy and “Account” dimension istagged as “compression” dimension.Application details and outline:Oracle Essbase Aggregate Storage BenchmarkPage 8
The Oracle Essbase Aggregate Storage database was loaded with one billion linesof data from 40 different load files using different rule files to load into differentintersections. The size of each load file was 1.2 Gigabytes containing 10 milliondata lines.Essbase Aggregate Storage Database ConfigurationThis section outlines the different configurations applied to the Essbaseenvironment in this benchmark exercise. Aggregate Storage CacheoAggregate Storage cache facilitates memory usage during dataloads, aggregations, and retrievalsoSet to 32 GB – (half the total available memory on the EssbaseServer) CALCPARALLEL set to 8, to enable parallel processing during viewmaterialization. MAXLOGINS was set to 25000, to allow more than 20000 user sessionsallowed to connect to the Essbase Server at any one time. Location of Tablespace and Source Files:o“Default” tablespace: “Default” tablespace was placed onZFilesystem “DefaultTS” which use the Zpool – “ASODB”o“Temp” tablespace: “Temp” tablespace was placed onZFilesystem “TempTS” which use the Zpool – “ASODB”oSource Files: Source files were placed on the M5000 internaldrives (SAS drives with 10K rpm, striped with a stripe length of128K).Oracle Essbase Aggregate Storage BenchmarkPage 9
Test MethodologyThis section describes the test methodology employed to perform benchmark testson the Essbase Aggregate Storage database. The Essbase Aggregate Storagedatabase administrative functions were tested using custom developed MaxLscripts. Data sources for “Dimension Build” and “Data load” were flat files. TheData retrieval tests were performed using industry standard load test tool HPLoadRunner. In this test, proprietary test harness was used to submit queriesdirectly to Essbase via the Essbase API.Workload SpecificationThis section describes the workload employed in this benchmark testing exercise.Aggregate Storage Database – Administrative Functions:Dimension build:This test involves, loading 13 Million members to the “customer” dimension usinga flat files as a data source and rule file.Data load:Data was loaded into the Oracle Essbase Aggregate Storage database from 40different load files using multiple rule files. The size of each of the load file was 1.2Gigabytes containing 10 million data lines. This test was performed using a customMaxL (Data Definition langrage for Essbase) script.Database calculation:Database is calculated by aggregating and storing the values.Two options for aggregation were tested: Default Aggregation: Typically when retrieval request is submitted,Essbase calculates the data values by consolidating the values loaded intolevel 0 members these calculated values are not stored. In this test, thedata values are pre-calculated and stored in the database by theaggregation process. Usage Based Aggregation: Fine tuning retrieval performance wasperformed with “usage based aggregation”. In this test, the proposedaggregate views which are created as a result of tracked retrieval querieswere materialized.Oracle Essbase Aggregate Storage BenchmarkPage 10
Aggregate Storage Database – User functions – Data Retrieval:This section outlines the query profile employed for the “Data Retrieval” tests.User requests were simulated using both Report Writer and MDX scripts.Report Writer is a text-based script language that you can use to report on data inmultidimensional databases. Following is the Report Writer request used in enduser testing.{WIDTH 12} {OUTALTNAMES} PAGE (Measures, Customer, Shipper)QtyShipped pARAM1 Param2 COLUMN (Shipment Date) ICHILD Param 3 ROW (Product) ICHILD Param4 !MDX is a language to develop scripts for applications to query and report againstdata and metadata in Essbase databases. Following are MDX queries used intesting.Query 2: MDX Query 1:SELECT {[ Param 1 ].children, [ Param 1 ]} on axis(0), {[psp 04].children}on rows, .[OrderLineDiscount]) ONAXIS(2),{[Shipment term].levels(1).members} on axis(3) from appname . dbname where ([QtyShipped],[ Param 2 ],[ Param 3 ])Query 3: MDX Query 2:SELECT {[ param 1].children, [param 1]} on axis(0), {[psp 04].children} onrows, {[psp 07].children} on Measures].[OrderLineDiscount]) ONAXIS(3),{[Shipment term].levels(1).members} on axis(4) from mill13m.mill13mwhere ([QtyShipped],[ param 3 ],[ param 4 ])Query 3 is executed once every ten iterations.The different parameter values for the queries were supplied via data files andrandomized during the test.Data Retrieval test - step by step instructions:1.2.3.4.5.6.7.8.9.User logs in to EssbaseUser selects the applicationThink time 1 secondUser submits Report writer requestThink time 1 secondUser submits MDX query 1Think time 1 secondUser submits MDX query 2LogoutSteps 4 to 6 (both inclusive) were performed in a loop for the test duration of 1hour.Oracle Essbase Aggregate Storage BenchmarkPage 11
Load Runner configuration: Random think time – 50 to 150% Pacing – Random - 60 to 90 seconds after each iterationBenchmark Results SummaryThis section describes the results of the benchmark tests performed with variousconfigurationsTest 1 – Custom Dimension LoadIn this test 13 million members were loaded into custom dimension in theAggregate Storage database outline using rule files. This test was executed using acustom developed MaxL script.Loading custom Dimensions involves building dimensions and performing arestructure. The elapsed time taken for these activities are showActivityTotal Elapsed Time ( inMinutes)Building dimensions37 MinutesRestructure of theoutline4.2 MinutesTest 2 – Data Load using RulesIn this test, 1 billion lines of data were loaded from 40 different load files usingrules. Each load file was of size 1.2 Gigabytes containing 10 million data lines. Foroptimal performance, data values were loaded to a temporary data load buffer, andthen written to storage after all data sources has been read.The data load tasks involve the sub-tasks parsing of load file, loading the contentsof load file to data load buffer and committing the contents of buffer to thedatabase. In this test, the Sun Storage F5100 Flash Array was employed.The data load performance can be influenced by the following factors:Number of Data Load Threads:This configuration (DLTHREADSPREPARE) is typically set at the server levelfor all or specific Databases/application on the server. This setting enables parallelprocessing of data load files during the data load preparation stage which mayimprove data load performance. As a part of “Data Load” test, various executionswere performed with different “DLTHREADSPREPARE” values.Oracle Essbase Aggregate Storage BenchmarkPage 12
Number of Load Buffers:The data load performance can be improved by loading values to a temporarybuffer load buffer, followed by a final write to storage after all the data load filesare read. As a part of this “Data Load” test, various executions were performedwith different number of data load buffers. The overall data load performance maybe improved by having multiple load buffers and loading data into those buffers inparallel.Aggregate Storage Cache:Aggregate Storage Cache aids in data load and other Aggregate Storage Databasetasks. In this benchmark test, cache 32 GB was used to determine the impact onperformance.Location of Data load files, Default and Temp Tablespace:Tablespaces in Aggregate Storage Database help to optimize the data and work filestorage and retrieval. Configuring the location of database (default tablespace) andwork (temp tablespace) files on different physical drives helps to improve theperformance. The data load files should also be placed on different drives toimprove performance however it doesn’t matter if it’s on the same location as“default” tablespace.Impact of Data Load Threads and Load Buffers on Data Load PerformanceThe impact of data load threads (DLTHREADSPREPARE) and the number ofLoad Buffers on data load performance were accessed by scheduling various testexecutions with different number of data load threads and Load buffers.Storage Technology - location of tablespace & Data load file:Sun Storage F5100 Flash Array – ZPool: “Default” Tablespace: placed on the ZFS Filessytem “DefaultTS” whichuses a single Zpool “ASODB” of 1 TB. “Temp” Tablespace: placed on the ZFS Filessytem - “TempTS” whichuses a single Zpool “ASODB” of 1 TB. Data Load Files – Internal Drives of the Essbase Server running on theSun SPARC Enterprise M5000 serverThe metrics below demonstrates optimum data load performance can be achievedwith 4 Data Load Threads and 6 Load Buffers. Please note: This optimum numberof Data load threads and Load buffers depends on factors such as amount ofphysical memory and number of cores on the Essbase Server.Oracle Essbase Aggregate Storage BenchmarkPage 13
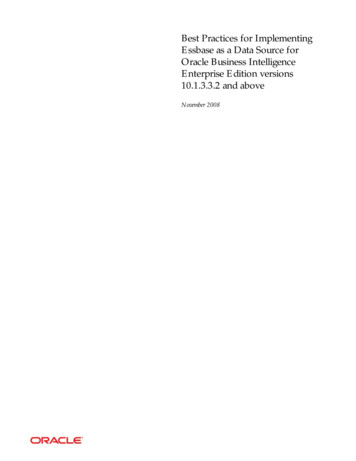
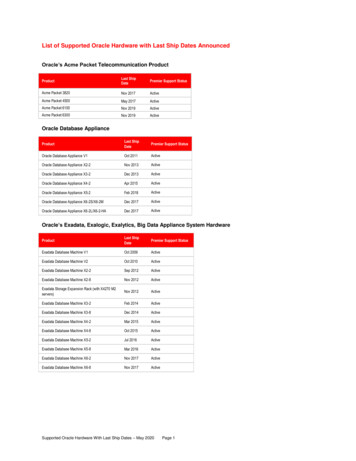
Number of Load Buffers andData Load ThreadsData Load – Elapsed Time ( in minutes)# Load Buffers: 8 # Data LoadThreads: 4Overall Load Time: 282.3 MinutesTime to parse and write the contents of load fileto buffer:128.77 MinutesTime to write the contents of buffer to Database:153.60 Minutes# Load Buffers: 6 # Data LoadThreads: 4Overall Load Time: 266.3 MinutesTime to parse and write the contents of load fileto buffer : 141.72 MinutesTime to write the contents of buffer to Database:124.65 MinutesResource Utilisation: Processor and IO UtilisationThe figures below show the processor and IO utilisation during data load test.Execution 1: # Load Buffers: 6 # Data Load Threads: 4Figure 1: Processor UtilisationFigure 2: IO Utilisation – Over all system activity (in seconds)Execution 2: # Load Buffers: 8 # Data Load Threads: 4Figure 3: Processor utilisationOracle Essbase Aggregate Storage BenchmarkPage 14
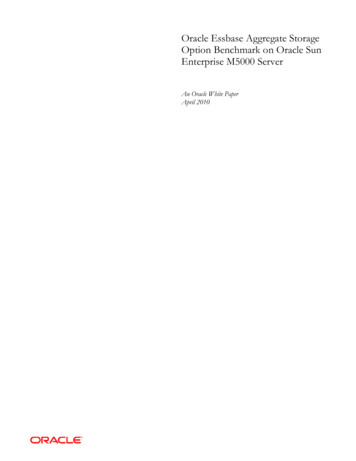
Figure 2: IO Utilisation – Over all system activity (in seconds)Test 3 – Default AggregationIn this test Aggregate Storage database is calculated by aggregating and storingvalues in the database. Aggregations are consolidations based on outline hierarchyand has two phases Aggregate view selection Calculation and storage of values for the selected aggregate views.The factors influencing aggregation materialization performance are “AggregateStorage Cache” and “Number of Threads” for parallel view materialization(CALCPARALLEL).In this test for optimal performance, 8 threads for parallel calculation and 32 GBof Aggregate Storage cache were used. Note: The number of threads for parallel calculationand amount of Aggregate Storage cache depends on the available hardware resources.Storage ConfigurationDefault Aggregation( Elapsed Time) inMinutesSun Storage F5100 Flash Array526 MinutesDefault” Tablespace placed on the ZFS Filesystem “DefaultTS” which( Total of 20 aggregate viewsuses a single Zpool “ASODB” of 1 TB.built)“Temp” Tablespace placed on the ZFS Filesystem “TempTS” which usesa single Zpool “ASODB” of 1 TBResource Utilization: Processor and IOThe figures below show the processor utilisation of Essbase Server and IO.Oracle Essbase Aggregate Storage BenchmarkPage 15
Figure1: Processor UtilizationFigure 2: This figure shows the over all IO activityTest 4 – Usage Based AggregationIn this test, the aggregate views proposed as a result of tracked retrieval querieswere materialized, to gain better performance for some retrieval requests.Storage ConfigurationUsage BasedAggregation( Elapsed Time) inminutesSun Storage F5100 Flash Array115 MinutesDefault” Tablespace placed on the ZFS Filesystem“DefaultTS” which uses a single Zpool “ASODB” of 1 TB.“Temp” Tablespace placed on the ZFS Filesystem “TempTS” which uses a single Zpool “ASODB” of 1 TB( Total of 6 aggregateviews built)Resource Utilization – Processor and IOThe sections below show the resource utilisation – Processor and IO. The figurebelow shows the processor utilisation of Essbase server during the test.Figure 1: Essbase Server – Processor UtilisationOracle Essbase Aggregate Storage BenchmarkPage 16
Figure 2: This figure show the overall IO activity during the test.Test 5 – Multiuser- Data Retrieval TestsIn this test, concurrent users submitted MDX (language-based data analysismechanism to Essbase databases) queries to Essbase VIA API calls. In order toachieve concurrency industry standard load test tool HP LoadRunner wasemployed. In this test scenario, test executions before and after usage basedaggregation was performed.Impact of usage based aggregation on retrieval performanceThe metrics below clearly shows the performance improvements in data retrievaltransactions after usage based aggregation. The queries submitted to Essbase weretracked using the “Query Tracking” option and the proposed aggregate views werematerialized (usage based aggregation) for better retrieval performance.Table 1 – Table below shows the transaction response time for Data Retrieval testexecuted before usage based aggregation with “Query Tracking” enabled. In thistest, 3.38 queries per second and 3 reports per second were served during this 500user retrieval in toEssbaseMDXQuery 1ReportWriterMDXQuery 2MinAverageMaxSD( in(inseconds)( inseconds)(inseconds)seconds)90PercentNumber ofTransactions( in 184.56341.599113.6252,421Oracle Essbase Aggregate Storage BenchmarkPage 17
Table 2 – Table below shows the transaction response time for Data Retrieval testexecuted after usage based aggregation. In this test, 4.9 queries per second and 4.43reports per second were served during this 500 user retrieval inMDXQuery 1ReportWriterMDXQuery 2Min(inseconds)Average( inseconds)Max( inseconds)SD( inseconds)90Percent( inseconds)Number 0920.193554The rows marked bold are the response time for the queries submitted to Essbase.Further data retrieval tests with 20000 concurrent users after usage basedaggregation also showed similar performance with no signs of degradation in querytimings. Table 3 shows the response time of the transactions with 20000concurrent ginMDXQuery 1ReportWriterMDXQuery 2Min( inseconds)Average( inseconds)Max( ercentNumber 20.1732,932,253Oracle Essbase Aggregate Storage BenchmarkPage 18
CONCLUSIONThe Oracle Essbase Aggregate Storage benchmark demonstrates the ability ofOracle Essbase to support business intelligence applications with requirements forlarge data volumes and enterprise-scale user populations. The combination ofEssbase, Sun SPARC Enterprise M-series servers and Sun Storage F5100 FlashArray offer industry- leading -performance for end-user and administrativeoperations in OLAP applications.Oracle Essbase Aggregate Storage BenchmarkPage 19
APPENDIXEssbase - Aggregate Storage Database - StatisticsThe section shows the Aggregate Storage statistics gathered at various stages ofbenchmark tests.Essbase Database Statistics – after Data LoadEssbase StatisticsValueNumber of Input Cells8041568592Input level data size (GB)54514176Current Cache Size(GB)32 GBDisk space used by data (GB)52 GBEssbase Database Statistics – after Default AggregationEssbase StatisticsValueNumber of Input Cells8041568592Input level data size (GB)54514176Current Cache Size(GB)32 GBDisk space used by data (GB)104 GBNumber of aggregate views20Number of aggregate cells7146049384Aggregate data size (KB)53871424Essbase Database Statistics – after Usage based AggregationEssbase StatisticsValueNumber of Input Cells8041568592Input level data size (KB)54514176Current Cache Size(GB)32 GBDisk space used by data (GB)105.5 GBNumber of aggregate views20Number of aggregate cells7146049384Aggregate data size (KB)56059968Oracle Essbase Aggregate Storage BenchmarkPage 20
Essbase ASO BenchmarkApril 2010Oracle CorporationWorld Headquarters500 Oracle ParkwayRedwood Shores, CA 94065U.S.A.Worldwide Inquiries:Phone: 1.650.506.7000Fax: 1.650.506.7200oracle.comCopyright 2010, Oracle. All rights reserved.This document is provided for information purposes only and thecontents hereof are subject to change without notice.This document is not warranted to be error-free, nor subject to anyother warranties or conditions, whether expressed orally or impliedin law, including implied warranties and conditions of merchantabilityor fitness for a particular purpose. We specifically disclaim anyliability with respect to this document and no contractual obligationsare formed either directly or indirectly by this document. This documentmay not be reproduced or transmitted in any form or by any
Oracle Essbase can easily scale to meet the needs of any demanding business enterprise as demonstrated by the sub second query response time with 20,000 concurrent users and a large enterprise size Essbase application. Product Overview Oracle Essbase is a multi-threaded OLAP database server that takes advantage of