Transcription
GEOLOGICAL SURVEY CIRCULAR 368FEATURES SHOWN ONTOPOGRAPHIC MAPS
UNITED STATES DEPARTMENT OF THE INTERIORDouglas McKay, SecretaryGEOLOGICAL SURVEYW. E. Wrather, DirectorGEOLOGICAL SURVEY CIRCULAR 368FEATURES SHOWN ON TOPOGRAPHIC MAPSBy John B. RowlandWashington, D. C., 1955Free on application to the Geological Survey, Washington 25, D. C.
GEOLOGICAL SURVEYTOPOGRAPHIC INSTRUCTIONSChapter 1 B 3FEATURES SHOWN ON TOPOGRAPHIC MAPSContentsPageAbstract . . . . . . . . . . . . . . .Principles of map representation1. Definition of a n1ap a. Topographic map . . . . . . . . .b. Planimetric map . . . . .2. Elements of map construction .a. Colors and classes of features . .b. Lines and symbols . .c. Letters and numbers . . . .d. Map scale . . . . . . . . . . .3. Problem of selecting features .4. Selecting map features for a purpose5. Other factors in selecting mapfeatures. . . . . . . .a. Legibility . . . . . .b. Cost of production. . . . .c. Obsolescence . . . . . . . .d. Concept of a landmarkMap delineation of topographic relief6. Methods and objectivesa. Measurement . . . . . . . . .b. Interpretation . . . . . . .7. Selection in mapping relief features .a. Choosing a contour intervalb. Generalization . . . . . . .8. Topographic expression9. Kinds of relief featuresa. Erosional features . . .b. Residual features . . .c. Depositional features . .10. Symbols and patterns used to showrelief . . . . . . . .a. Hachures . . . .b. Area patterns . .c. Relief shading. . . .Map representation of water features .11. Periodic changes in water features .a. Classification of water features .b. "Normal" water level . . . . . . 16PageMap representation of water features--Continued12. Kinds of water features and mapsymbols . . . . . . . . . .16a. Linear watercourses . . . . .16b. Area water features. . . . . . .17c. Glaciers and permanent snow17fields . . . . .17d. Springs and wells .17e. Coastal features . 18Manmade map features . . 13. Coordinate systems, subdivisions,18and boundaries . . . . . .a. Coordinate systems 18b. Public-land subdivisions1819c. Boundaries . . . . . . .1914. Travel and transportation routes .19a. Roads and trails . .19b. Railroads . . . . . .19c. Other route features1915. Buildings and cities . .19a. B11ildings . . . .20b. Building groups . .20c. Towns and cities2016. Names, notes, and numbers 20a. Map names . . .20b. Geodetic control marks .21c. Spot elevations . . . .21Information on map margins . .17. Identification, orientation, andexplanation . . . . . .2121a. Identification . . . . . .b. Responsibility, methods, and21dates . . . c. Scale, contour interval, and21other data . . Map references . . . . . .2218. Special selected list .2219. Other reference maps233
IllustrationsFigure1. Pictographic map symbols2. Comparison of map scales3. Contours. . . . . . .4. Two maps of identical areas in southeast New York State . . . .5. Contoured slopes . . .6. Drumlins in northern New York . .7. Cedar Creek alluvial fan in Montana .8. Depression contours and hachures . . .9. Hydrographic features. . . 10. Information shown in center of lower margin.Topographic map symbols . . . . . . . . . . . . . . . . .4Page67911131415161722facing page 22
Chapter 1 B 3 1FEATURES SHOWN ON TOPOGRAPHIC MAPSABSTRACTTopographic maps represent features on the earth's surface bymeans of symbols and labels; separate colors distinguish the main classesof map features. The amount of information shown on a topographic mapdepends on the map scale, the purpose of the map, and the cost of obtaining the information. This chapter describes the three main categories ofmap information and the methods by which they are shown. Referencelists of published maps and a chart illustrating standard map symbols areincluded.PRINCIPLES OF MAP REPRESENTATION1. Definition of a mapA map is a graphical representation, at anestablished scale, of a part of the earth's surface, showing important natural and manmadefeatures in their correct positions relative to acoordinate reference system and to each other.a. Topographic map. --A topographic map,as distinguished from other kinds, portrays bysome means the shape and elevation of the terrain. Geological Survey topographic maps usually represent elevations and laNdforms--theshapes into which the earth's surface is sculptured by natural forces--by contour lines. Otherfeatures are shown by a variety of conventionalsigns, symbols, lines, and patterns, which areprinted in appropriate colors and identified bynames, labels, and numbers. The chart facingpage 22 shows the standard symbols used on thetopographic maps of the Survey.b. Planimetric map. --A planimetric mapis similar to a topographic map, except that itdoes not portray relief in a measurable form.The Survey publishes some planimetric maps foruse until they can be replaced by topographic maps.2. Elements of map constructionA topographic quadrangle map is the product of both engineering and the graphic arts.Surveys made on the ground and from photographsare organized in a coherent form and reproducedgraphically according to a plan. To be usefulthe map must present information legibly. Thegraphic accuracy must be consistent with theaccuracy of the source surveys and with the publication scale. The map must include the information essential to its purpose and must excludenonessentials. The main -elements of quadranglemap construction have been formulated to attainthese objectives.a. Colors and classes of features. --Theinformation shown on the quadrangle map isdivided into three general classes, each printedin a different color. Information about the shapeof the land surface--hypsographic or topographicinformation--is printe'd in brown. Water features--hydrographic information--are shown inblue. Cultural features--manmade objects·-are shown in black. The system of division isnot precise. Some manmade features--for example, levees and earth dams--are also topographic features and are printed in brown, ·notblack.1The number 1 B 3 signifies Book 1, Part B, Chapter 3 of theGeological Survey looseleaf manual of Topographic Instructions. For atable of contents, see Chapter 1 A 2 (Circular 92).5
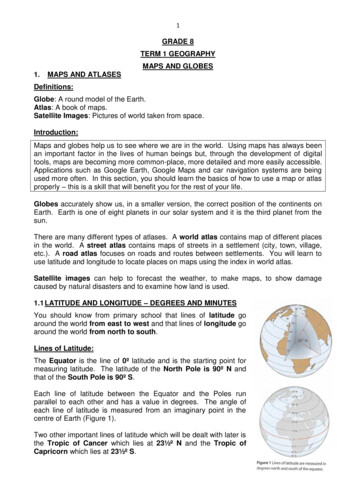
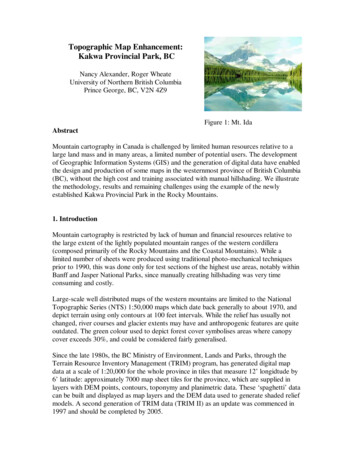
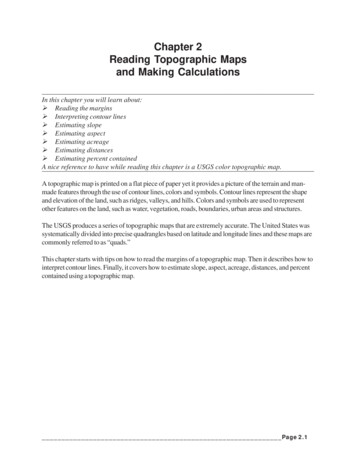
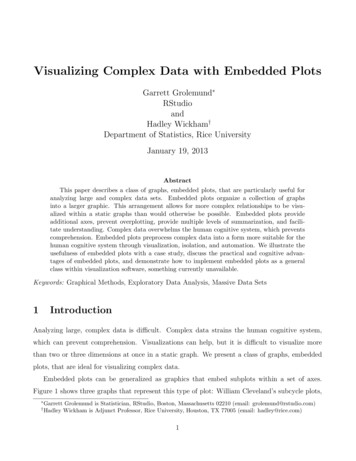
6 (Ch. 1 B 3)TOPOGRAPIDC INSTRUCTIONSBesides the colors used for the three mainclasses of features, green is used to show woodland--timber, brush, vineyards, and orchards-and red is used to show public-land subdivisions(cultural features) and the classification of themore important roads.b. Lines and symbols. --Linear featuresare represented by lines of various weights andstyles (solid, dashed, dotted, or some combinations). Structures, or individual features, areportrayed by a system of pictographs or symbols.The symbols originated as plan views of the objects they represent, and they retain somethingof this character although they are now formalized. The building symbol, for example, is asolid or open square. The railroad symbol is aline with evenly spaced cross ties. The dam andlevee symbols look approximately like dams orlevees as seen from the air. (See fig. 1. )jD (BUILDINGS3. Problem of selecting featuresThe amount of information that can be depicted legibly on a map is limited by the scaleof the map. The effect of scale on map contentis emphasized if the scale is considered as aratio of areas rather than a ratio of distances.Figure 2 illustrates the actual paper areas representing 1 square mile at 2 standard scalesfor topographic mapping.DAM,,,,'' '. "''"''',,,,,,,,,,,,,' ,RAILROADd. Map scale. --Map scale is the relationship of the size of the map to the size of theground area it represents. The relationshipmay be expressed as a linear equivalent, suchas 1 inch equals 1 mile--meaning that 1 inchmeasured on the map represents 1 mile on theground--or it may be expressed in many otherways. The scale of Survey maps is given in theform of a ratio or fraction, without dimensions;the numerator is the distance on the map, andthe denominator is the corresponding distance onthe ground. For example, 1:24,000 means thatone unit of length on the map represents 24,000similar units on the ground./ / / / I I\\\'\.'\II/topographic features the information portrayedby contour lines must be supplemented by elevation figures. Letters and numbers are essential to map interpretation, but they tend to obscure other map information. Therefore, theymust be selected and positioned carefully on themap so that interference with other detail iskept to a minimum.LEVEEFigure 1. --Pictographic map symbols.c. Letters and numbers. --Because linesand symbols cannot represent map informationcompletely, they must be supplemented by thenames of places and objects. Notes must beadded to explain some features that cannot bedepicted clearly by symbols alone. In mappingThe major problem in map compilation isto make the best use of the available map space.The space cannot be crowded with lines andsymbols beyond a definite limit without makingthe map unreadable, yet the amount of information that might be useful or desirable is almostunlimited. The cartographer must select thefeatures that are the most valuable to the mapuser. The smaller the map scale, the morecritical and difficult the problem of selectionbecomes.4. Selecting map features for a purposeTopographic maps are often made for aparticular purpose. For example, a map made
FEATURES SHOWN ON TOPOGRAPHIC MAPSI sq mi at 1 24 000(Ch. 1 B 3) 7I sq mi at 1 62 500Figure 2. --Comparison of map scales.for the purpose of designing a new highway wouldshow the type of woodland cover and the classification of soil and rock along the route. Information about drainage, property lines, and buildingswould be shown in detail as required. The mapwould be in the shape of a strip and would covera relatively small ground area. This type of mapis called a special-purpose map because it haslimited value for other uses.Unlike special-purpose maps, the quadrangle maps produced by the Geological Surveyhave been designed to be used for many purposes.Scales, contour intervals, accuracy specifications, and features that are shown on the mapshave been developed gradually over a period ofyears to satisfy the requirements of governmental agencies, industry, and the general public.Because these maps serve a wide variety ofuses--scientific, engineering, military, and administrative--they are called general-purposemaps.Changes in symbolization and in featuresto be shown are adopted only after careful consideration of their effect on the various mapusers, as well as the operational problems andcosts involved in making the changes. Changesin symbolization usually are submitted to a governmental interagency Committee on Map Symbols for review and approval.5. Other factors in selecting map featuresThe functions the map is intended to servedetermine the features that it is desirable tomap, but other factors must be taken into account before it is decided what features actuallycan be shown. Among the most important considerations are legibility, the cost of compilingthe information, and the permanence of the mapped features.a. Legibility. --The requirement that mapinformation be legible and easily read meansthat small map features must be representedby symbols larger than·the true scale size ofthe features. Roads, for example, are shown90 feet wide on 1:62, 500-scale maps despite thefact that most roads are not actually this wide.Buildings and other structures also are shownby minimum-size symbols that may be largerthan the actual scale size of the buildings. Onaerial photographs at the same scale as the map,which show all features at true scale size, smallfeatures sometimes are not visible without magnification.
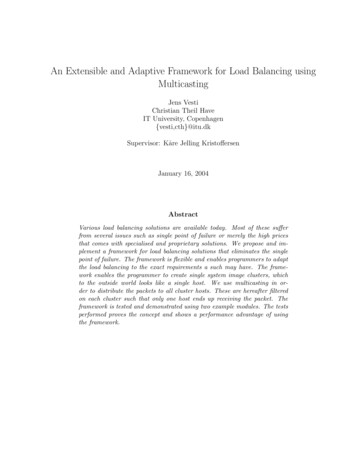
8 (Ch. 1 B 3)TOPOGRAPHIC INSTRUCTIONSSymbols larger than scale size take upextra map space; therefore, where small featuresare close together, all of them cannot be shown.Generally, the less important features are omitted in congested areas.b. Cost of production. --The extent to whichsome kinds of map features are shown is determined partly by the cost of compiling the information. Aerial photographs are the source of mostmap information, but features that cannot beidentified on mapping photographs must be obtained by field methods, a procedure that is relatively more expensive. As an example, not all section corners are mapped; they are too small to beseen on aerial photographs, and the cost of mapping all of them by field surveys would be excessive.c. Obsolescence. --Not only the originalcost but also the cost of keeping the map up todate is considered in deciding what features tomap. Generally, the more features depicted, themore quickly the map becomes out of date. Cultural features are especially subject to change.If the maps are to have a reasonably long usefullife, the features portrayed must be restricted,to some extent, to relatively permanent.objects.MAP DELINEATION OF TOPOGRAPHICRELIEF6. Methods and objectivesContour lines are the principal means usedto show the shape and elevation of the land surface. Other means are spot elevations andhachures and pattern symbols for special kindsof relief features that are not suited to contouring. Relief information is printed in brown ontopographic maps.Contours are lines connecting points ofequal elevation. They always are continuouslines, and, if the map is large enough, they return to the points of beginning to form closedloops. A contour may be variously defined as-An imaginary line on the ground, every pointof which is at the same elevation abovea specified datum surface (mean sealevel for topographic maps of the Survey).A level or grade line.A line of constant elevation.A coastline or shoreline of level water.d. Concept of a landmark. --Many kinds offeatures are shown on some maps, althoughomitted from others, because of the landmarkcharacter of the features. In this sense, a landmark is an object of sufficient interest in relationto its surroundings to make it outstanding. Forexample, buildings may be considered landmarkswhen they are used as schools or churches orwhen they have some other public function. Theymay be landmarks also because of their outstanding size, height, or design; or they may be landmarks because of their history, such as old fortsor the birthplaces of famous men.The same principle is applied to featuresother than buildings, but the adjacent area alwaysis considered in relation to the object. Wheremap features are few, objects that would not beshown in more congested districts may be mapped as landmarks.An assumed shoreline resulting from theassumed rising of a body of level water.However it is defined, a contour is theline traced by the intersection of a level surfacewith the ground. A series of contours is tracedby a series of level surfaces, a different contourfor each elevation. Contours are illustrated infigure 3. Each contour line on the map represents a definite ground elevation measured frommean sea level, and the contour interval is thedifference in elevation between adjacent contours.The contour interval, together with the spacingof the contour lines on the .map, indicates theslope of the ground. On steep slopes the linesare more closely spaced than on gentle slopes.
FEATURES SHOWN ON TOPOGRAPHIC MAPS(Ch. 1 B 3) 9To make maps more readable, contoursare classified and the classes distinguished bydifferent weights and styles of lines. Index contours--every fourth or fifth contour, dependingon the basic interval- -are accentuated by makingthe line wider than the other contours. Supplementary contours, used on the flatter areas ofsome maps, are shown as dashed or dotted lines.Elevation figures are shown on the contour linesat frequent intervals to facilitate their identification, as well as to assist in determining the valuesof adjacent contours.The two main reasons for showing reliefinformation on maps are to furnish coordinateddata for engineering calculations or other scientific mensuration and to present a graphic pictureof the ground surface. The two objectives arerelated but distinct, and sometimes they may beconflicting.a. Measurement. --For engineers or scientists who are interested in exact measurement,topographic maps furnish dimensional informationabout elevations, areas, grades, and volumes.The approximate elevation of any point can beread directly or interpolated from contours. Aseries of elevations on a line determines the gradeor profile of the line, and areas and volumes canbe computed by combining line profiles in variousways. The relief information shown by contoursis sufficient for calculating the storage capacityof a reservoir, the area of a watershed, or thevolume of earth to be moved in a large road cutor fill.b. Interpretation. --On the other hand, manypersons who use maps are not concerned withexact ground elevations but are more interestedin the general appearance and shape of the land.For them, contours are the graphic means of visualizing the terrain and an aid in locating positionson the map.7. Selection in mapping relief featuresThe amount of relief information that can beshown on a map depends largely upon the scale ofthe map and the contour interval used to portraythe relief. If a great amount of relief detail is required, the scale must be enlarged and the contourinterval made smaller; but regardless of the scaleFigure 3. --Contours.and contour interval all information concerningthe ground surface cannot be shown on maps.The mapmaker must always make a judiciousselection of the features that it is desirable toportray.a. Choosing a contour interval. 2 --A satis factory contour interval is one that shows the important topographic features adequately, yet doesnot result in closely spaced contour lines that ar difficult to read. For a given scale and contourinterval, the slope of the ground determines thespacing of contours on the map. Therefore, themost appropriate contour interval is selected according to the scale and the average ground slopein the quadrangle. Most quadrangles in continental United States are mapped with intervals of 5,10, 20, 40, or 80 feet.2See Chapter 1 B 2, Contour intervals.
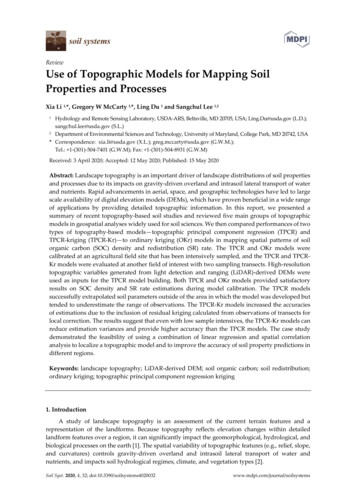
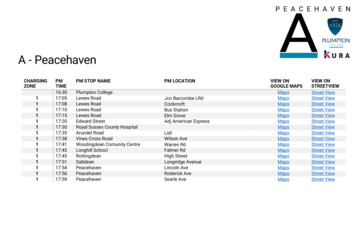
10 (Ch. 1 B 31TOPOGRAPHIC INSTRUCTIONSVvhere slopes vary considerably within aquadrangle, the interval chosen may not giveenough information in flatter areas because thecontours are too far apart. Where this occurs,supplementary contours--at one-half or onefourth of the basic interval--are added in the flatareas. If the interval based on average slopecauses too much congestion of contours in thesteeper areas, intermediate contours may bedropped for short distances to avoid coalescencein printing. This treatment in drafting or scribing is called ''feathering.''The contour interval used determines notonly the amount of relief information that can beshown but also the allowable tolerances in thevertical accuracy of the map. The two are directly related. 3b. Generalization. --Small irregularitiesof the ground surface are omitted from the mapby drawing the contours as smooth lines throughthese areas. The technique of ignoring the verysmall features and drawing the contour lines sothat the larger features are emphasized is calledgeneralization.contours could be drawn to meet accuracy specifications and yet have such poor topographic expression that the map might give a misleadingpicture of the landscape. Good topographic expression makes the map easier to interpret-that is, the relief features are easily identified.For example, the contours depicting asmooth, rolling hill, without abrupt breaks orsharp ridges, are drawn as a series of gentlycurved lines, with no acute angles. On the otherhand, the contours portraying a rugged, kniferidged hill, with many cliffs, are jagged andbent sharply to indicate these characteristics.The amount of generalization and the accuracymay be the same for both features; the differenceis in the detailed delineation of the contours.The contrast in contour treatment for twodifferent kinds of terrain can be seen by comparing the smooth hills of New York in theTiconderoga quadrangle with the rough, brokenmountains of Wyoming in the Maverick Springsquadrangle. Both are ?!-minute maps at thescale of 1:24, 000, with 20-foot contour intervals.9. Kinds of relief featuresGeneralization is used to some extent incontouring at any map scale, because it is obviously impossible, even at the largest scale,to show every irregularity of the ground surface.The amount of detail omitted varies inverselywith the map scale; some of the relief detailmapped at the scale of 1:24,000 may be omittedat the scale of 1:62, 500. Figure 4 illustratesan area contoured at the scales of 1:24,000 and1:62, 500; the greater amount of detail shown atthe larger scale is plainly evident.8. Topographic expressionThe drawing of contour lines on a map isboth an art and a science. It is a science in thesense that the lines must be positioned withincertain limitations of accuracy; it is an art inthat within this limitation the mapmaker has alimited choice in the way the lines are drawn.When the contour lines are drawn so that theyrepresent the typical characteristics of theground surface, the map is said to have goodtopographic expression. On the other hand, the3mapping.See Chapter 1 B 4, Accuracy specifications for topographicTo illustrate the contoured appearance ofdifferent kinds of topographic features, examplesfrom three general classes have been selected.a. Erosional features. --These featuresare formed by the erosive action of wind, waves,glaciers, and streams. Features formed bystream courses are the most common and include valleys, gullies, washes, and gorges.The typical contour characteristic of streamcourses is the shape of the contour reentrant,the part of the contour. that curves or bendstoward and away from the drainage channel. Ina series of contours outlining a hill, reentrantsshow the courses of streams too small to beshown on the map with blue lines. The spacingbetween the reentrants along a stream showsthe grade or slope of the watercourse. Theshape of the reentrants sometimes suggests thesteepness of the banks of the drain, or the kindof soil or rock formation through which thewater flows. In flat areas the width of a streamchannel often must be exaggerated to avoidrunning the contour lines together.
FEATURES SHOWN ON TOPOGRAPHIC MAPS(Ch. 1B3) 11Figure 4. --Two maps of identical areas in southeast New York State. Each mapcovers 4 square miles. The upper one (1945) is at the scale of 1:24,000,with a contour interval of 10 feet; the lower one (1902) is at the scale of1:62,500, with a contour interval of 20 feet,
12 (Ch. 1 B 3)TOPOGRAPIDC INSTRUCTIONSb. Residual features. --Features of thiskind are the parts of the earth' s· crust that haveresisted erosion effectively and have remainedsomewhat in their original state. Plateaus,benches, mesas, escarpments, cliffs, and terraces are typical residual features. Importantcharacteristics of this class of features shownby contours are the slope and the breaks orchanges in the slope.Alluvial fans develop in valleys at the baseof block mountains, being formed from rock andgravel washed out of canyon mouths. They maybe almost any size from a few feet to severalmiles in diameter. Usually, they slope evenlyfrom the center to the outer edge, and theircontoured appearance is that of a fan--hencethe name. Figure 7 illustrates a typical alluvialfan in Montana.A slope may be uniform, concave, or convex. A uniform slope is indicated by even spacing of contours. On a concave slope, the contoursare closely spaced near the top, gradually widening toward the bottom. On a convex slope, thearrangement is reversed; the contours are closely spaced near the bottom, and the spacing increases toward the top. Land slopes are seldomof a single type and may be found in all possiblecombinations.10. Symbols and patterns used to show reliefRock escarpments, which usually borderhigh flat plateaus, are characterized by closelyspaced contours near the top, which bend sharplyat the crest and meander across the plateau. Theslope below the crest is usually concave, withthe spacing between contours gradually increasing toward the base of the hill. Figure 5 illustrates contoured slopes; the Juanita Arch, Colo.,7!-minute quadrangle is a good example of contoured cliffs, escarpments, mesas, and otherresidual features.c. Depositional features. --As the classname indicates, these features are deposits ofsoil, rock, and other material built up by suchcarrying agents as glaciers, streams, winds,and volcanoes.Drumlins, illustrated in figure 6, areelliptical hills of unstratified glacial debris,larger and steeper at the north end and taperingtoward the south. Their contoured shape is typical and recognizable. Groups of drumlins occurin Wisconsin, New York, and Massachusetts.Eskers are another form of glacial debris,deposited in long, narrow bands by streams beneath glaciers. They vary in length from a fewhundred yards to several miles; within an areathey frequently occur in series.Although contours are the best method ofshowing most topographic features, symbolsmust be used to represent features that cannotbe shown clearly or economically by contours.Hachures and patterns are frequently used to depict relief in areas having a predominance ofdistinctive ground features that are either toointricate or too small to be individually or accurately shown at the scale or contour intervalselected for the map.a. Hachures. --Hachures, short linesdrawn in the direction of the ground slope, areused to show gravel or borrow pits too small tocontour; piles of waste material, such as minedumps (see fig. 8); small banks or escarpmentsthat are prominent but not high enough to beshown by the selected contour interval; and similar relief features.A slightly different form of hachures isused to depict small earth dams, small levees,spoil banks, and cuts and fills along roads orrailroads. Contoured depressions are distinguished from hills by short ticks at right anglesto the contours, pointing toward the center ofthe depression.b. Area patterns. --Intricate surface areastoo irregular to contour except in a very generalized manner, such as lava beds, sand dunes, andopen strip mines, are shown by a variety of symbo1 patterns. The patterns are made up of dots,hachures, or form lines that indicate the typicalappearance of the area. Where symbol patternsare used, no attempt is made to represent thetopography in detail. The Medicine Lake, Calif.,15-minute quadrangle shows a volcanic area withmany craters and lava beds. The lava beds arerepresented by a surface pattern and generalizedcontours.
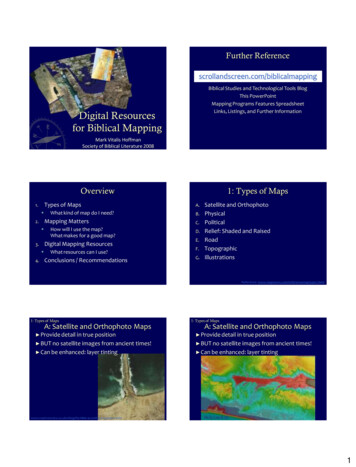
FEATURES SHOWN ON TOPOGRAPHIC MAPS(Ch. 1 B 3) 13Figure 5. --Contou.red slopes . A flat - topped mesa in Wyoming mapped at the scaleof 1:24, OCO, with a 20 -foot contour interval. The steep mesa rim is portrayed by closely spaced contours, which come together in places wherethere are vertical cliffs. Toward the foot of the hill the contour spacingis wider, indicating a generally concave slope. The outlined squares arepublic - land subdivisions 1 mile, more or less, between corners . Part ofthe North Butte , Wyo. , 7!- minute quadrangle.
14 (Ch. 1 B 3)TOPOGRAPHIC INSTRUCTIONSFigure 6. --Drumlins in northern New York. The elliptical hills are orientedgenerally in the direction of glacial movement. Usually they aresteeper at the north end. The map scale here is 1:24, 000; the contour interval is 10 feet. Part of the Sodus , N. Y., 7i - minute quadrangle.
FEATURES SHOWN ON TOPOGRAPHIC MAPS(Ch. 1B3) 15Figure 7. --Cedar Creek alluvial fan in Montana. A deposit of sand and gravelwashed out of Cedar Creek canyon in the mountains at the right. Itforms a semicircular cone with a radius of almost 4 miles and with aheight at the center of over 800 feet . The contoured slope is exceptionally uniform. The map scale here \S 1:62, 500; the contour interval is40 feet . Part of the Ennis, Mont. , 15 - minute quadrangle.c . Relief shading. - -The pictorial effect ofsome maps is emphasized by relief shading, ahalf-tone overprint that simulates the appear ance of sunlight and shadows on the terrain andprovides the illusion of solid, three - dimensionaltopography. Relief shading copy is preparedafter the rest of the map has been produced inthe conventional way. Of the maps listed inarticle 18, the Delaware, Mich., the Ironton,Mo . , the Waldron, Ark. , and the Ennis, Mont. ,15- minute quadrangles are published in shadedrelief editions .MAP REPRESENTATION OF WATERFEATURES11. Periodic changes in water featuresUnlike other natural features , most ofwhich are reasonably stable, water features- -
16 (Ch. 1 B 3)TOPOGRAPHIC INSTRUCTIONSFigure 8. --Depression contours and hachures. Iron mines in the Mesabi districtof Minnesota mapped at the scale of 1:24,000, with a 10-foot contour interval. Hachures show the piles of ore and waste material. Depressioncontours, with short right-angle ticks, show the open-pit mines. Manyof the worked-out miries contain water. Part of the Virginia, Minn. ,7 -minute quadrangle.shown in blue on the map--change from time totime. The levels of rivers, lakes, and reservoirs fluctuate during the year, according to theamount of rainfall and runoff. Smaller streamsand springs may be entirely dry for a part of theyear . Daily or even hourly variations in streamflow and water level occur in areas where melt ing snowfields or glaciers feed the streams orwhere streams are controlled for irrigation, orindustrial purposes .water usually undergo seasonal changes. Asfar as practical, the level shown on the maprepresents the so -called "normal" stage, defined as the one prevailing during the greaterpart of the year. Usually it corresponds to theline of permanent vegetation on the banks orshores. Strictly s
by symbols larger than·the true scale size of the features. Roads, for example, are shown 90 feet wide on 1:62, 500-scale maps despite the fact that most roads are not actually this wide. Buildings and other structures also are shown by minimum-size symbols that may be larger than the actual scale size of the buildings. On