Transcription
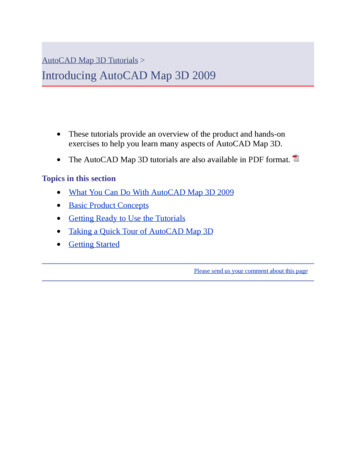
Topographic Map Enhancement:Kakwa Provincial Park, BCNancy Alexander, Roger WheateUniversity of Northern British ColumbiaPrince George, BC, V2N 4Z9Figure 1: Mt. IdaAbstractMountain cartography in Canada is challenged by limited human resources relative to alarge land mass and in many areas, a limited number of potential users. The developmentof Geographic Information Systems (GIS) and the generation of digital data have enabledthe design and production of some maps in the westernmost province of British Columbia(BC), without the high cost and training associated with manual hillshading. We illustratethe methodology, results and remaining challenges using the example of the newlyestablished Kakwa Provincial Park in the Rocky Mountains.1. IntroductionMountain cartography is restricted by lack of human and financial resources relative tothe large extent of the lightly populated mountain ranges of the western cordillera(composed primarily of the Rocky Mountains and the Coastal Mountains). While alimited number of sheets were produced using traditional photo-mechanical techniquesprior to 1990, this was done only for test sections of the highest use areas, notably withinBanff and Jasper National Parks, since manually creating hillshading was very timeconsuming and costly.Large-scale well distributed maps of the western mountains are limited to the NationalTopographic Series (NTS) 1:50,000 maps which date back generally to about 1970, anddepict terrain using only contours at 100 feet intervals. While the relief has usually notchanged, river courses and glacier extents may have and anthropogenic features are quiteoutdated. The green colour used to depict forest cover symbolises areas where canopycover exceeds 30%, and could be considered fairly generalised.Since the late 1980s, the BC Ministry of Environment, Lands and Parks, through theTerrain Resource Inventory Management (TRIM) program, has generated digital mapdata at a scale of 1:20,000 for the whole province in tiles that measure 12’ longidtude by6’ latitude: approximately 7000 map sheet tiles for the province, which are supplied inlayers with DEM points, contours, toponymy and planimetric data. These ‘spaghetti’ datacan be built and displayed as map layers and the DEM data used to generate shaded reliefmodels. A second generation of TRIM data (TRIM II) as an update was commenced in1997 and should be completed by 2005.
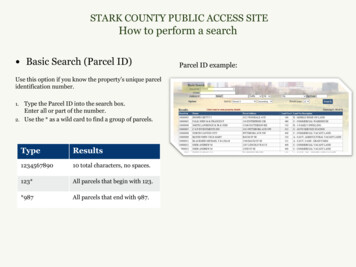
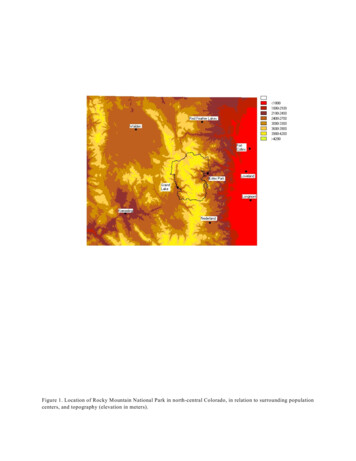
2. Study areaKakwa Provincial Park is located in the extreme eastern part of British Columbiaadjacent to the border with Alberta and covers an area of 1710 square kilometres(‘Kakwa’ means porcupine in the Cree language). It was designated a park in 2000 andforms part of the Rocky Mountain chain of mostly undeveloped wilderness extendingnorthwest into northern BC beyond the Banff and Jasper National Parks to the southeast.However access to the park is via loosely maintained gravel roads which end before thepark and require further travel foot (12 km from the BC side) by bicycle, horse orsnowmobile (in winter). These gravel roads extend either along 80 km from the southfrom highway 16 connecting Prince George and Jasper, or to the northeast to GrandPrairie. As a result, users are limited to approximately 150 in summer and anunmonitored estimate of 300 in winter (unofficial estimates; Jean-Guy Bergeron).The park contains typical Rocky Mountain scenery with numerous glaciers, lakes, alpinemeadows and forested valleys (elevation down to 800m). The two main peaks are Mt. SirAlexander (3274m) and Mt. Ida (3180m), the latter a classic pyramidal peak similar toMatterhorn and Assiniboine but seen by very few visitors other than from a remotedistance. As a new park, local users and residents are concerned as to any futuredevelopment plans. An introductory guide and description of the park was the subject ofa UNBC Masters project (Bergeron, 2001).Figure 2: Location in British ColumbiaFigure 3: Landsat Image of Kakwa20 Km
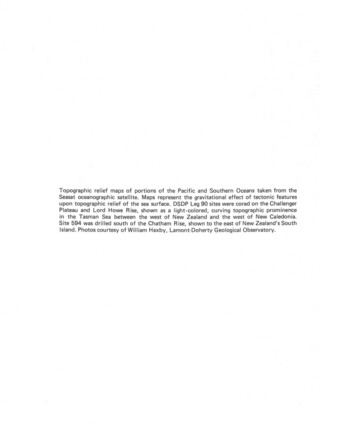
3. Data sourcesExisting maps of the area are limited to portions of six 1:50,000 NTS map sheets in two1:250,000 areas (93H and 93I); these were compiled from aerial photography between1961-75. BC TRIM data are available at 1:20,000 for these layers, with different types offeatures separable by an ‘fcode’ attribute.a. Planimetric layers depicting: hydrography (lakes, rivers, marshes, glacier outlines andpoint feature locations such as waterfalls and rapids), roads (gravel only in this area),treeline, and cultural point and line features such as cabins, powerlines etc. which arelimited in this area.b. Toponymy: place names are incomplete since many names are undecided in this areac. contour lines (20 metre interval)d. DEM points, sampled approximately at 70 metres spacingWhen TRIM II data arrived, DEMs could also be acquired as 25 metre raster gridsinterpolated from the points. Planimetric data have been separated into feature layers(roads, rivers etc.).Figure 4: TRIM HydrographyFigure 5: Feature Codes
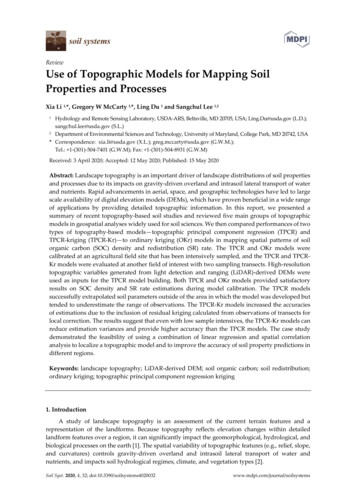
4. Data processinga. Cleaning lineworkVector lines were cleaned and built to create lakes and marshes as polygons and to reducethe number of arc segments for rivers and contour lines. The cases of glaciers and forest(versus non-forest) represent further challenges as the latter are captured only as linevectors, and hence it is unclear for any polygon whether each side is forested orunforested. The same is true of more complex glaciers involving interior bare rock; inaddition TRIM outlines have been observed to be less than reliable since early summerphotography results in significant remnant snow patches that conceal glacier edges.b. Generating vectors from satellite imageryThese two challenges were met using image processing of a cloud-free Landsat 5Thematic Mapper image dataset from September 1994. Band ratios were employed toenhance both glacier edges and vegetation changes: a 4/5 ratio and a 4/3 ratiorespectively, which enabled us to generate new vectors, and could be built into polygonsfor glaciers and forested areas respectively. We are continuing to refine this process andto work with later Landsat imagery to monitor changes due to glacier retreat andavalanches. These satellite images are also useful for providing 3D perspectives forlandscape visualization.Figure 6: Non-forested/Forested ImageFigure 7: Treeline overlain on Landsat
c. Additional (new) vectorsTRIM did not include the park boundary which was established only in 2000; howeverthose for all BC Parks are available from the BC Parks website for download in exportformat. Trails and routes are mostly unmapped and in fact unmarked due to theundeveloped nature of the park. These were added by digitizing from topographicmemory (Bergeron, 2001) with intent to map them more accurately by GPS in comingsummers.d. Integration of hillshading and thematic layersHillshading was generated from the DEM; some artefacts are apparent on some glacierareas, as a result of inadequate point capture due to reflectance saturation from the brightsurface (Sidjak and Wheate, 1999). We hope to be able to incorporate data from othersensors such as ASTER to compensate for these. Since experiments with photomechanical combination of hillshading and forest cover in the 1970s, it has becomecommonplace to use GIS software to perform this in research mapping, even if not inmass production. In this case, we integrated both glaciers and forest cover with thehillshading, rather than overlaying or printing these layers separately.Figure 8: Gray Scale HillshadingFigure 9: Hillshading merged with forestcover and glaciers.e. LabellingAs a starting point, we incorporated in some cases an auto-labelling function utilising aname attribute associated with each label point. However in other cases, we needed toadd lettering for new and in some cases unnamed peaks and passes. Labelling of contoursposed further challenges in this regard as the software default labelled each arc segmentwith the elevation value. This was qualified to restrict labelling first to index contours,
and second to only segments exceeding a selected threshold length, to minimiserepetition along the same contour but at the same time retain labels on smaller ‘island’contours.Figure 10: Map SampleFigure 11: Kakwa Lake Area5. Summary and ConclusionsSpecialised mountain cartography is limited in western Canada to a small number of mapproducers and mapping resources. However the province of British Columbia whichincludes the majority of the western cordillera, is well covered by digital data, which canbe cleaned and augmented with linework derived from recent satellite imagery wherenecessary. The known advantages of shaded relief can be incorporated into mountainmap design without the traditional problems of cost and need for scarce practitioners. Thequality of GIS derived maps however may not yet match the best traditional cartographythat was achieved previously (Henoch and Croziet, 1976): this remains our lofty goal.6. Future workThe Kakwa map is in process of completion but still awaits route verification by GPS. Itwill be a prototype for examples of mountain cartography in northern British Columbia.The entire length of the Rocky Mountain Range northwest of Jasper National Park arecovered only by National Topographic map sheets which are more than 25 years out ofdate. The Northern Rockies (Muskwa-Kechika) alone is 1.5 times the size of Switzerland.
Figure 12: Kakwa Lake and Babette LakeAcknowledgements:Thanks to Jean-Guy Bergeron for the expert local information on the Kakwa area and toGeographic Data British Columbia (GDBC) for providing the TRIM data for this project.ReferencesBergeron, Jean-Guy, 2001. “Kakwa Park: a guide and management design.” Unpublishedmasters project, Faculty of Natural Resources and Environmental Studies, UNBC.Henoch, W.E.S. and Croizet, J.L. 1976, The Peyto Glacier Map : A three-dimensionaldepiction of mountain relief, The Canadian Cartographer, 13 No.1, June 1976, 69-86.Sidjak, R.W. and Wheate, R.D., 1999. "Glacier mapping of the Illecillewaet Icefield,British Columbia, Canada, using Landsat TM and digital elevation data”, InternationalJournal of Remote Sensing, Vol 20, No.2, 273-284Kakwa Provincial Park:wlapwww.gov.bc.ca/bcparks/parkpgs/kakwa.htm
The Kakwa map is in process of completion but still awaits route verification by GPS. It will be a prototype for examples of mountain cartography in northern British Columbia. The entire length of the Rocky Mountain Range northwest of Jasper National Park are covered only by National Topographic map