Transcription
ReviewUse of Topographic Models for Mapping SoilProperties and ProcessesXia Li 1,*, Gregory W McCarty 1,*, Ling Du 1 and Sangchul Lee 1,2Hydrology and Remote Sensing Laboratory, USDA-ARS, Beltsville, MD 20705, USA; Ling.Du@usda.gov (L.D.);sangchul.lee@usda.gov (S.L.)2 Department of Environmental Sciences and Technology, University of Maryland, College Park, MD 20742, USA* Correspondence: xia.li@usda.gov (X.L.); greg.mccarty@usda.gov (G.W.M.);Tel.: 1-(301)-504-7401 (G.W.M); Fax: 1-(301)-504-8931 (G.W.M)1Received: 3 April 2020; Accepted: 12 May 2020; Published: 15 May 2020Abstract: Landscape topography is an important driver of landscape distributions of soil propertiesand processes due to its impacts on gravity-driven overland and intrasoil lateral transport of waterand nutrients. Rapid advancements in aerial, space, and geographic technologies have led to largescale availability of digital elevation models (DEMs), which have proven beneficial in a wide rangeof applications by providing detailed topographic information. In this report, we presented asummary of recent topography-based soil studies and reviewed five main groups of topographicmodels in geospatial analyses widely used for soil sciences. We then compared performances of twotypes of topography-based models—topographic principal component regression (TPCR) andTPCR-kriging (TPCR-Kr)—to ordinary kriging (OKr) models in mapping spatial patterns of soilorganic carbon (SOC) density and redistribution (SR) rate. The TPCR and OKr models werecalibrated at an agricultural field site that has been intensively sampled, and the TPCR and TPCRKr models were evaluated at another field of interest with two sampling transects. High-resolutiontopographic variables generated from light detection and ranging (LiDAR)-derived DEMs wereused as inputs for the TPCR model building. Both TPCR and OKr models provided satisfactoryresults on SOC density and SR rate estimations during model calibration. The TPCR modelssuccessfully extrapolated soil parameters outside of the area in which the model was developed buttended to underestimate the range of observations. The TPCR-Kr models increased the accuraciesof estimations due to the inclusion of residual kriging calculated from observations of transects forlocal correction. The results suggest that even with low sample intensives, the TPCR-Kr models canreduce estimation variances and provide higher accuracy than the TPCR models. The case studydemonstrated the feasibility of using a combination of linear regression and spatial correlationanalysis to localize a topographic model and to improve the accuracy of soil property predictions indifferent regions.Keywords: landscape topography; LiDAR-derived DEM; soil organic carbon; soil redistribution;ordinary kriging; topographic principal component regression kriging1. IntroductionA study of landscape topography is an assessment of the current terrain features and arepresentation of the landforms. Because topography reflects elevation changes within detailedlandform features over a region, it can significantly impact the geomorphological, hydrological, andbiological processes on the earth [1]. The spatial variability of topographic features (e.g., relief, slope,and curvatures) controls gravity-driven overland and intrasoil lateral transport of water andnutrients, and impacts soil hydrological regimes, climate, and vegetation types [2].Soil Syst. 2020, 4, 32; /soilsystems
Soil Syst. 2020, 4, 322 of 19Topography has been widely used in soil science, with topographic information being derivedfrom multiple sources. Before the 1990s, the main source was geographic maps [1]. Usinggeomorphometric techniques, the topographic metrics, such as slope gradient and curvatures, wereproduced manually and applied to investigate spatial variability in soil properties and to producesoil maps [3–5]. With the development of computer and geophysical technologies, more and morescientists have used digital elevation models (DEMs) derived from photogrammetry to calculatetopographic metrics. A series of topographic metrics were developed due to the improvement ofmathematical theory and physical understanding of topographic surface features.The objective of this study is to provide an overview of topographic models for predictions ofsoil properties and processes. The prerequisites for developing an effective topography-based soilproperty model are that (1) the impacts of topography on soil properties can be investigated througha small set of samplings over a small scale, and (2) strong statistical correlations exist betweentopography and soil properties. Therefore, this review begins with an introduction of topographybased soil studies, following investigations of topographic metrics that are important for soil modelsand five main groups of topographic models. The last section presents a case study to assess theefficiency of high-resolution topography-based models for mapping soil organic carbon (SOC) andredistribution.2. Topographic Metrics for Soil StudiesVarious studies have demonstrated the utility of including topographic metrics in soil modelsto better simulate spatial patterns of soil properties and processes [6–15]. Topographic metricsquantify characteristics of the topographic features. According to the calculation methods,topographic metrics can be divided into primary and secondary (combined) metrics [16]. Primarymetrics are directly calculated from elevation, such as slope, aspect, and curvatures. The metrics arefurther grouped into local and nonlocal because of the spatial scope [1]. Local metrics describe thesurface geometry at a given point, whereas nonlocal metrics consider relative positions of a selectedlocation. Secondary or combined metrics combine primary metrics and usually describe spatialvariability in specific processes such as water content distribution and soil erosion potential. Table 1lists definitions of topographic metrics that were reported to impact soil movement and properties.Table 1. Definitions of selected topographic metrics.CategoryVariableAltitude, H (m)Slope gradient, ocaltopographicmetricsProfile curvature,P Cur (m 1)Plan curvature,Pl Cur (m 1)Catchment area, CA(m2)Upslope slope, UpSl(radian)Downslope index,DI (radian)Flow path length,FPL (m)Flow accumulation,FA (m2)DefinitionElevationAn angular measure of the relationbetween a tangent plane and ahorizontal planeSlope change rates in the verticalplaneCurvature in a horizontal planeUpslope area contributing runoff to agiven point on the land surfaceMean slope of upslope areaHead differences along a flow pathMaximum distance of water flow to alocation in the catchmentLand area that contributes surfacewater to an area in which wateraccumulates
Soil Syst. 2020, 4, 323 of 19Topographic relief,TR (m)SecondarymetricsTopographicopenness, TO(radian)Topographicwetness index, TWIStream power index,SPILength–slope factor,LSElevation difference between thehighest point in an area and a givenpointAngular measure describing therelationship between surface reliefand horizontal distanceFrequencies and duration ofsaturated conditionsErosive power of overland flowFactor that considers slope lengthand steepness effects on erosion2.1. Primary Metrics2.1.1. Local Topographic MetricsSlope gradient (G), profile curvature (P Cur), and plan curvature (Pl Cur) can control gravitydriven overland and intrasoil lateral transport of water and nutrients. G suggests the steepness of alocation, which can directly influence water infiltration and soil erosion [17,18]. Compared torelatively flat areas, steeper areas tend to have less infiltration and higher erosion possibilities,decreasing soil moisture and transporting fine soil particles with high SOC content from the areas[2,7]. Furthermore, most of the soil-forming processes (e.g., carbonate dynamics, clay illuviation, andso on) are more efficient on more gently-sloping land surfaces [19,20]. P Cur is parallel to thedirection of maximum slope, and therefore affects soil redistribution and SOC distribution patternsthrough influencing flow acceleration and deceleration [21–23]. Pl Cur is perpendicular to thedirection of maximum slope, which determines flow divergence and convergence [1,24,25].Altitude (H) impacts soil properties by affecting climate and insolation. Changes in H causevariations in climate. Generally, decreased temperature and increased precipitation occurs in areaswith elevated altitude. Temperature and precipitation changes affect vegetation composition andproductivity, which in turn influence soil properties and water content [26].2.1.2. Nonlocal Topographic MetricsMultiple nonlocal topographic metrics can significantly impact the gravity-driven processes,including upslope slope (UpSl), downslope index (DI), and topographic relief (TR). UpSl reflects thesteepness of the upslope contributing areas, which is positively related to overland flow velocities[16,25,27]. DI is also a slope gradient associated metric, but it considers the water balance betweenthe water from a specific upslope contributing area and a downslope area [28]. Therefore, this metricis highly correlated with groundwater gradients and soil water content [28,29]. High values of TRreflect large differences between the highest and the target locations, and thus high overland flowvelocities are usually observed with potentials for large downslope soil transport [7,8,30].Catchment area (CA), flow path length (FPL), flow accumulation (FA), and topographicopenness (TO) affect soil properties through influencing soil hydrological regimes, causingvariability in soil C decomposition, denitrification, and nitrification processes. Increased CAenhances the chance for sediment deposition, changing the soil C stocks [31]. Longer FPL decreasesoverland flow velocity and increases soil infiltration and erosion [32–34]. This metric is widely usedin soil erosion models because it reflects soil loss under flow divergence and convergence conditions[35,36]. FA impacts water conditions in the soil, which is positively related to flow volume and soilwater content [37,38]. TO exhibits convex (high positive TO and low negative TO values) and concave(low positive TO and high negative TO values) landforms [39]. Therefore, soil water contents arelikely high in locations with low positive TO values, providing suitable anaerobic environments fordenitrification but impeding aerobic C decomposition [7,8].
Soil Syst. 2020, 4, 324 of 192.2. Secondary MetricsCommonly used secondary topographic metrics generally address aspects of the physics ofwater movement on landscapes. Topographic wetness index (TWI) is calculated as 𝑇𝑊𝐼 ln.This index is widely used to reflect the spatial distribution of wetness conditions [7,40–42]. Locationswith high values of TWI have high possibilities to be wet locations. TWI has proved to be an effectiveindex for understanding spatial patterns of soil hydrological and geochemical properties and issignificantly correlated with soil C and N content [7,8].Stream power index (SPI) considers specific contributing area (CAs), Pl Cur (PlCur), and G withtan(𝐺). The metric is useful for investigating potential erosivethe equation as 𝑆𝑃𝐼 𝐶𝐴 𝑃𝑙powers of water flow [43]. The increased G and CA lead to increased water flow velocity and wateramount, and consequently enhancing water erosive power [44].Length-slope factor (LS) is a combination of slope length and slope gradient. There are threemajor methods for LS calculation, including models developed by Moore and Nieber [45], Desmetand Gover [46], and Wischmeier and Smith [47]. Increased slope length usually increases the soil lossper unit area because of a greater runoff accumulation on a longer slope length, whereas slopesteepness increases also stimulate soil loss.Large collinearities often exist between these topographic metrics (Table 1) for a given landscape,with two main causes for the correlations—one being these metrics quantify the properties of a selforganized landscape whose properties would be expected to be correlated, and another being thatvarious metrics are derived from mathematical equations containing common elements that inducecorrelations between the resulting metrics. Principal component analysis (PCA) is a commonapproach to generate sets of orthogonal factors from correlated metrics and thereby reduce thedimension of parameters. These PCA factors, in turn, can be used as a set of orthogonal parametersin prediction models. This is the approach that Li et al. [6–9] used in developing more robusttopographic models using information contained within 15 topographic metrics with reduceddimensionality. Interestingly, the resulting PCA factors were combinations of local, nonlocal, andsecondary metrics reflecting the connectedness of landscape network processes and informationflow.3. Soil-Landscape Models for Soil Property MappingAlong with the development in computer, aerial, space, and geographic techniques, increasingattention has been paid to soil-landscape modeling to predict spatial patterns of soil morphological,chemical, and physical properties. Recently, detailed large-scale topographic information can bederived due to the increased availability of high-resolution DEMs, providing a possibility forregional-scale soil property predictions based on topography-based models. There are five maingroups of models with strong application in landscape modeling.3.1. Geostatistical ModelsGeostatistical models deal mainly with spatial data and explain spatial autocorrelation usinginterpolator. Kriging is a representative geostatistical model with a form of weighted averagesgenerating an estimate from a scattered set of measured values. One limitation of kriging is that it isan interpolation technique, and thus predictions are only valid for regions that have multiplemeasured values. Estimation in a finite domain can provide too much weight to points, leading tobiased estimations [48,49]. In 1980, Burgess and Webster first introduced ordinary kriging (OKr) tomap soil textures [50]. Since then, a large body of literature has formed that is based on applicationof OKr to interpolate soil properties, such as fertility [9], salinity [51], soil water content [52], andinfiltration rates [49]. However, OKr fails to consider the knowledge of soil materials and landscape.The efficiency of the prediction usually depends on large samplings at the field scale [49].To overcome the above OKr limitations, several methods, such as regression kriging (RKr),cokriging (CKr), and kriging with external drift (KED), have been developed to incorporate ancillarydata into the OKr model. Combining OKr with multiple linear regression (MLR), RKr spatially
Soil Syst. 2020, 4, 325 of 19interpolates the residuals from a MLR model using kriging and adds the interpolation to theprediction to improve the performance of the MLR model. In soil science applications, various studieshave used this method for analyzing spatial patterns of soil horizon thickness [13,14], soil structures[13,14], soil water availability [53], cation exchange capacity [15,54], soil C content [55,56], andhydraulic properties [57,58]. The CKr model takes advantage of correlations between the investigatedvariable and other easily estimated variables. KED uses external ancillary variables to represent thetrend of soil properties. CKr and KED models have also been employed in investigating soil physicaland chemical characteristics [12–15]. Several studies have reported that performances of topographybased CKr and KED models are better than OKr models in soil property estimation in areas that arestrongly impacted by landscape [49,59].3.2. Logic ModelsFuzzy Logic (FL) is a widely used logical method with soil mapping applications. It is anextension of Boolean logic to express the degree of similarity to a classification type usingmembership values ranging from 0 (non-membership value) to 1 (membership value) [60]. Becausesoils are continuums in both geographic and attribute spaces, allowing partial truth of independentvariables is especially useful and provides sufficient information about soil properties whencompared with the traditional setting of 0 or 1 [61,62]. Topography-based FL has been applied in soilmapping to improve soil taxonomic classification [63–67]. Several studies also used the model tostudy spatial patterns of soil horizonation [64,68,69], predict soil texture [68,70], and classify soilvulnerability [71].3.3. Decision Tree AnalysisAs a divisive supervised classification, decision tree analysis (DTA) successively partitions adataset into increasingly homogenous subsets. Rules applied to split the data area can be eithercategorical, such as geographical unit number and soil unit, or continuous, such as elevation andslope [72,73]. A useful rule can decrease impurity of the dataset. Therefore, by developing a set ofrules from training data, the DTA can be applied to regions with the same inputs to predict the targetvariable. This method is useful for capturing nonadditive and nonlinear relationships, and is easierto interpret than standard statistical approaches because the output is based on a set of nominaland/or continuous rules [74].In accordance with different splitting methods, DTA can be divided into two classes: (1)homogeneous decision tree and (2) hybrid decision tree. The homogeneous decision tree uses a singlealgorithm in each partition [75]. One representative homogeneous decision tree is the classificationand regression trees (CART) algorithm. A topography-based CART can be applied to derive efficientcategorical information, such as soil taxonomic classes and soil drainage classification [76–79].Researchers have also successfully used topography-based CART for quantitatively predicting soilproperties such as soil cation exchange and water retention [15,80]. The hybrid decision tree may usedifferent splitting algorithms at different points. Friedl and Brodley [75] found that this methoddemonstrated the highest accuracy in classification when comparing different DTA methods.3.4. Standard Statistical MethodsStatistical methods, including multiple linear regression (MLR) and discriminant analysis (DA),are widely used to quantify impacts of the landscape on soil properties and to generate soil maps.MLR uses two or more independent variables to simulate a target soil property or process throughfitting to a linear equation. The topography-based MLR models do demonstrate, in a quantitativemanner, the fact that terrain analysis can be applied to predict spatial patterns of soil physical andchemical properties over large spatial scales [6–12]. MLR has also combined with other methods toimprove the efficiency of prediction. For example, Li et al. [7] developed topography-based modelsbased on a principal component regression (PCR) combining principal component analysis and MLR
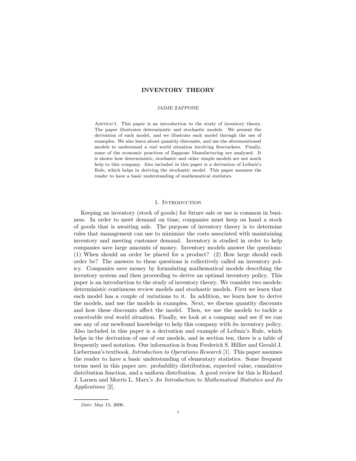
Soil Syst. 2020, 4, 326 of 19to predict soil redistribution processes and SOC content. Results suggested that the PCRoutperformed regular MLR with a more robust prediction over different spatial scales.DA is a type of supervised classification using categorical criteria to assign an independentvariable to the most likely group. The main idea of DA is to develop a set of decision rules on thebasis of the measured data using a certain category variable of interest and several auxiliary variables.With establishment of rules, the variable of interest in areas where the auxiliary variables areavailable can be predicted. This method has been proposed to generate soil texture maps usingtopographic metrics and other ancillary variables [81,82]. Several studies also demonstrated thefeasibility of using the DA to predict soil drainage classes due to its high correlations with topographyand soil electrical conductivity [83,84].3.5. Advanced Statistical MethodsMachine learning (ML) is a rapidly developing approach to data analysis that is based on ideasthat computers can learn from data, identify trends, and make decisions with limited humanintervention. Successful ML methods have several common advantages. ML methods only need alimited number of user-defined parameters. They are able to deal with nonlinear relationships,predict quantitative and category variables, reduce overfitting, and remain robust regardless ofoutliers [85]. Due to advances in computing power and data availability, increasingly researchershave applied ML in soil mapping applications. Three widely used ML methods on soil propertypredictions are artificial neural networks (ANNs), deep learning (DL), and random forest (RF) (Figure1).Figure 1. Different machine learning architectures: (a) artificial neural networks, (b) deep learning,and (c) random forest.ANNs consist of one input layer, one output layer, and one layer of hidden interconnected units(neurons) connecting input and output layers (Figure 1a). With this method, the outputs are related
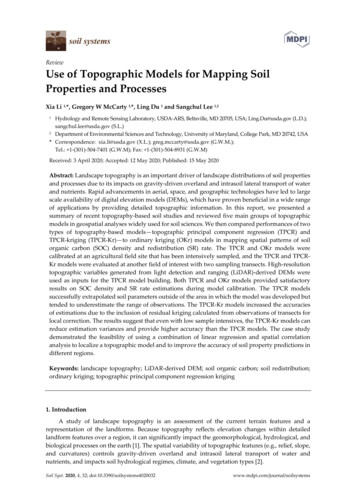
Soil Syst. 2020, 4, 327 of 19to the input variables, developing linked algorithms of the ANNs model. All links between the inputand hidden layers compose the input weight matrix, and links between hidden and output layers arethe output weight matrix. The weights can be adjusted iteratively on the basis of the training dataset.Including topographic information and other environmental variables, this method has beensuccessfully applied to identify categorical characters, such as soil taxonomic classes and drainageclassification [79,86–89], and to predict quantitative variables including soil chemical andhydrological properties [90–92].Advances in computing ability, such as innovative graphics processing units (GPUs), haveenabled the use of deep neural networks. DL is considered as an advanced ANN, which includesmulti-hidden layers instead of the single hidden layer structure in ANNs (Figure 1b). Learningthrough multi-layer nonlinear transformations, DL can be used to define edges within images andperform automatic feature extraction [93]. Two major architectures of DL are convolutional neuralnetworks (CNNs) and recurrent neural networks (RNNs). CNNs are based on a layer of convolvingwindow moving along a data array to detect features [94]. Padarian et al. [94] have appliedtopography-based CNNs to predict SOC at multiple depths and found that CNNs had a lower errorthan the predictions by the conventional Cubist model. Unlike CNNs, RNNs provide numbers offeedback loops, which allow inputs to be sent to any direction from and to all the layers [95]. As aresult, this model has potential advantage for tasks involving sequential information. One study hasdemonstrated use of RNNs to predict collapse potential of soil (ratio of change in soil height afterloading to its initial height) and obtained high accuracy [96].RF is an ensemble of classification and regression trees. The output of RF can be categoryestimated by majority voting of the trees or quantitative calculated through the average of the trees(Figure 1c). In the model, each tree randomly selected a subset of features with a random set oftraining data to increase the diversity of the forest and decrease the correlation of individual trees.Several studies have demonstrated the superiority of RF relative to traditional mathematic methodsin soil property predictions due to its high efficiency and low errors [97–100]. Using topographicinformation as covariates, RF has been successfully applied to predict spatial patterns of soil organicmatters and soil texture [99–103] and update soil survey and soil class maps [104–106].4. Case StudyThis study used Walnut Creek Watershed (WCW) (41 55’–2 00’N; 93 32’–93 45’W), Iowa, as apilot region to investigate efficiencies of topographic models on predicting soil properties andprocesses. The studied watershed is in a humid continental climatic zone with a mean annualtemperature of 8 C and mean annual precipitation of 818 mm. The topography of this watershed isrelatively flat, with a mean slope of 1.78 . The soils are classified as poor-drained Nicollet (mesicAquic Hapludolls) soils in the lowlands and well-drained Clarion (mesic Typic Hapludolls) in theuplands [107]. Agriculture is the dominant land-use type. More than 86% of the WCW is croplands.Primary tillage practices are chisel plowing and disking.Three types of models, including two topography-based models—topographic principalcomponent regression (TPCR) and TPCR kriging (TPCR-Kr) and one geostatistical model of ordinarykriging (OKr), were selected to simulate SOC density and soil redistribution (SR) rate patterns. Onthe basis of previous reports, we hypothesized that (1) OKr models provide the highest model fitduring calibrations; (2) TPCR models provide reasonable regional estimations and can capture spatialpatterns of soil parameters outside the area in which the model was developed; and (3) TPCR-Krmodels localize TPCR model prediction, which reduces estimation variances caused by modelextrapolation.4.1. Methods4.1.1. SamplingTo test the hypotheses, we collected soil samples from two agricultural field sites in WCW(Figure 2). One (field site 1) is an intensively sampled site in the middle west of the WCW (Figure 2b).
Soil Syst. 2020, 4, 328 of 19A 25 25 m grid was created, and 230 soil samples were collected at grid nodes for SOC density andSR rate estimation. Another site (field site 2) is about 4 km east from the field site 1 (Figure 2c). Thesite includes two 300 m transects with observational SOC density and SR rate. At each location, threesamples were collected from 0 to 30 cm soil layer within a 1 1 m quadrat using a push probe (3.2 cmdiameter). The fields contain both Typic and Aquic soils. Nicollet soils are poorly drained and arelocated in lower areas and depressions, and Clarion soils are well drained and located in hilltops[107]. Detailed data collection and laboratory analysis can be found in Li et al. [7,25] and Ritchie et al.[22]. A summary of the used data is shown in Table 2. Generally, both sites had negative mean SRrates, suggesting that soils were exported from these two sites within the period of 1960 to early 2000.Figure 2. Locations of study fields: (a) Walnut Creek Watershed (WCW), (b) the intensive sampledfield site 1, and (c) the transect field site 2.Table 2. Mean and standard deviation (SD) of soil organic carbon (SOC) density and soilredistribution rate (SR) at two field sites.Field Site 1Field Site 2SOC (kg m 2)Mean SD9.013.057.923.20SR (Mg ha 1 year 1)MeanSD 5.921.6 4.3530.84.1.2. Terrain AnalysisLight detection and ranging (LiDAR)-derived DEMs were used to generate topographic metricsof the two sites. The LiDAR data were acquired during the period 2007 to 2010 and are available viathe Iowa Geodata website. By use of inverse distance weighted interpolation, raw LiDAR data wereconverted to DEMs with 3 m spatial resolution.Fourteen metrics that were listed in Section 2 were generated on the basis of the 3 m DEM. Themetrics include altitude (A), slope gradient (G), profile curvature (P Cur), plan curvature (Pl Cur),catchment area (CA), upslope slope (UpSl), downslope index (DI), flow path length (FPL), flowaccumulation (FA), topographic relief component 1 (TRPC1), topographic relief component 2(TRPC2), positive topographic openness (PTO), topographic wetness index (TWI), and stream powerindex (SPI). The length—slope factor introduced in Section 2 was excluded due to its high correlationwith slope (r 0.97) [7]. We used modules in SAGA to derive slope, P Cur, Pl Cur, CA, FA, PTO, DI,FPL, TWI, SPI, and UpSl [6]. Topographic relief was generated on the basis of a maximum elevationmap within a specific area and a filtered 3 m DEM [40]. To reduce possible errors caused by anarbitrary selection of a radius for a maximum elevation map, a series of radiuses were selectedincluding 7.5 (relief7.5m), 15 (relief15m), 30 (relief30m), 45 (relief45m), 60 (relief60m), 75 (relief75m), and 90 m(relief90m). Principal component analysis (PCA) was applied to convert the relief maps into twoindependent relief components (TRPC1 and TRPC2).
Soil Syst. 2020, 4, 329 of 194.1.3. Statistical Analysis and Model CalibrationWe used Spearman’s rank analysis to analyze topographic impacts on spatial patterns of SOCdensity and SR rate. Then, we tested performances of OKr, TPCR, and TPCR-Kr models in predictingthe above two variables. OKr predicts unsampled locations by weighted averaging of nearbysampled data, and the weights were derived on the basis of semivariogram analysis of the sampleddata. For the TPCR models, we first used PCR to analyze topographic metrics of all croplands withinthe watershed. Components with loadings that explained more than 90% of the variance of all metricswere used to construct topographic principal components (TPCs) used for TPCR models. TPCR-Krmodels combine the regression of the dependent variables with the kriging of the regressionresiduals. Therefore, two steps were included for the TPCR-Kr model implementation: (1) analyzingresiduals of TPCR using semivariogram and OKr, and (2) summing the regression prediction andkriging prediction of the residual.Specifically, OKr and stepwise TPCR models were developed on the basis of SOC and SRobservations at the field site 1. The SOC density was log-transformed to meet the residual normalityassumption in linear regression. We used the Akaike information criterion (AIC) to select dependentvariables in stepwise models. We evaluated the model performances by comparing predictions withobservations in the transects. Residuals of the predictions over the transects were calculated and usedfor developing TPCR-Kr models over field site 2.Model efficiency was assessed on the basis of three criteria: the coefficient of determination (R2),Nash—Sutcliffe efficiency (NSE), and the ratio of the root mean square error to the standard d
a small set of samplings over a small scale, and (2) strong statistical correlations exist between topography and soil properties. Therefore, this review begins with an introduction of topography-based soil studies, following investigations of to pographic metrics that are important for soil models and five main groups of topographic models.