Transcription
Text Analytics usingTableauThe following tutorial will show you how to perform text analysis in Tableau 8.2. To get started, you willneed the following: Tableau version 8.2 Data: Political Speeches.xlsxPart 1: Loading the DatasetFirst, load the dataset into Tableau. Connect to Data In a file Microsoft Excel Select the Political Speeches.xlsxYou may see the dialogue window that says “Errors occurred while reloading the data source.” Ifso, click OK. Then, click Go to Worksheet. This should bring up the Tableau a new worksheet. Wecan now begin.Part 2: Learning about the Data: Word Length and Phrase LengthFirst, let’s learn a little bit about the data. The data is text from speeches by the four major presidentialcandidates (Hillary Clinton, John McCain, Barack Obama, and Mitt Romney) in 2008. The data hascolumn names as follows: I.Candidate: The candidateParty: Republican or DemocratPhrase: These are two word phrases in the speechPosition: This shows where the phrases and words occur in the speech. For example, for JohnMcCain, the first phrase is “thank you,” which occurs at position 1, or the beginning of thespeech.Word: These are the actual single words in the speech (not two word phrases)Phrase length: This is how long the phrases are measured by characters. For example, thephrase “thank you” is 9 characters longWord length: this is how long the corresponding words are measured by characters. Forexample, the word “thank” is 5 characters long.Word Length and Word Length FilterLet’s begin by working with the data and displaying the words in the speech by candidate, andfiltering the speech by word length.a. First Drag Position from Measures to Dimensionsb. Drag Position into Rowsc. Drag Candidate into ColumnsNote: the tutorial data came from the example posted here - election08stump-speeches
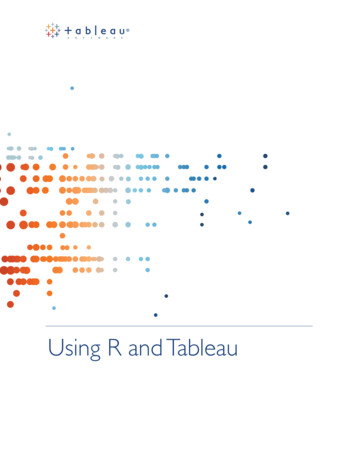
d. Drag Word into the text buttone. Drag Word Length into Filters Select Maximum Select ‘Range of Values’ Apply Click OK. This will allow you to filter the data by the length of the word.f. Now let’s add a Quick Filter.i. Go to Analysis Quick Filter select Max Word Length. A Max(Word Length)filter should appear on the right side. Click and Drag this under the Marks Card.ii. Slide the filter to only show words with 5 or more characters:iii. Notice now that you can quickly filter the words in each speech by word length.iv. Save this Worksheet as “Speech Word Filter by Candidate”v. Your worksheet should look like this:
II.Phrase Length and Phrase Length FilterLet’s continue by working with the data and displaying the phrases in the speech by candidate, andfiltering the speech by phrase length.a.b.c.d.e.f.Right click on the “Speech Word Filter by Candidate” worksheet. Click “Duplicate Sheet”Rename this sheet to “Speech Phrase Filter by Candidate”Remove the Word from the Marks Card.Remove Max(Word Length) from the Filters.Drag Phrase into the Text button on the Marks CardDrag Phrase Length into Filters.i. Set it up just like last time, as a range, and add it as a Quick Filter.ii. Drag the Max(Phrase Length) Quick Filterunder the Marks Cardg. Filter the Max(Phrase Length) so only show phrasesfrom 12 to 27 characters in length.h. Please notice now that you can now filter the two word phrases in the speeches by theirlength in characters.i. Your Report should look like this:Note: the tutorial data came from the example posted here - election08stump-speeches
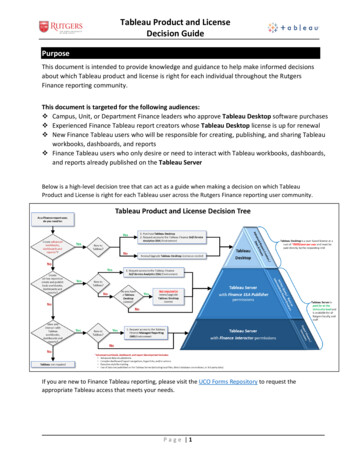
Part 3: Top Phrases (Bar Chart)I.Top Phrases by PartyII.Now that we have an understanding of the data we are working with, let’s do someanalytics on the text. Let’s begin with the top phrases by political party.Drag Phrase into Rowsa. Select Filter and then Add all members.Drag Phrase into Columns. Click on the down arrowthat appears when you hover over Phrase (still inColumns) and change the Measure of Phrase to Count.Change the graph to order the phrases from most to least. (Hover over the worksheet dataand a little icon appears. Click it and this will rearrange the data.)Drag Phrase into Label.Notice that the most popular phrase is “of the” followed by “in the” “to the,” etc. Thisdoesn’t really help much. Remember, SO WHAT? Let’s filter this to show some moremeaningful phrases.Drag Party into Filters. Check Democrat. Click Apply.Drag Phrase Length into Filters.i. Set it up just like last time, as a range, and add it as a Quick Filter.ii. Drag the Max(Phrase Length) Quick Filter under the Marks CardChange the phrase length to show only those that are 12 to 26 characters long.Now, we get some more meaningful phrases, and we can tell a better story. Notice that wecan see the most used two word phrase by Democrats is “the American”, followed by“American people” and “new leadership.”Save this chart as “Top Phrases by Party”Your worksheet should look like this:a.b.c.d.e.f.g.h.i.j.k.
II. Top Phrases in All SpeechesLet’s get a high-level look at the top phrases in all speeches.a.b.c.d.e.f.Right Click on the Top Phrases by Party worksheet, click Duplicate SheetRename this worksheet to “Top Phrases in All Speeches”Remove the Party field from FiltersRemove Phrase from the Marks CardDrag Candidate into ColorWe can now see a quick look at the top phrases used by Clinton, McCain, Obama, andRomneyg. Your worksheet should look like this:III. Top Phrases by CandidateLet’s go into some top phrases by specific candidates.a.b.c.d.Right Click on the “Top Phrases in All Speeches” worksheetClick Duplicate WorksheetName this worksheet as “Top Phrases: Obama (Bar)”Drag Candidate into Filtersa. Filter only by Obama. Click Apply and Ok.e. Remove Candidate from the Color in the Marks Cardf. Add Phrase to the Labelsg. We can now see a quick look at the top phrases used by Obamah. Your worksheet should now look like this:Note: the tutorial data came from the example posted here - election08stump-speeches
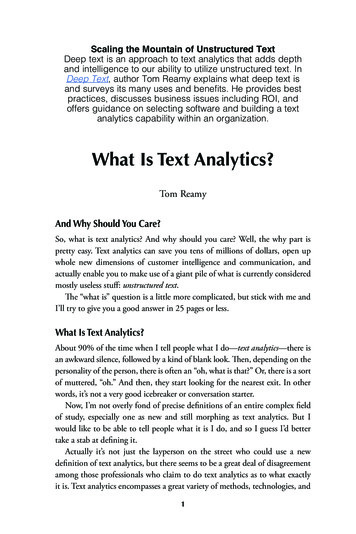
Part 4: Top Phrases (Word Cloud)I.Top Phrases: Obama (Text)Now let’s create a word cloud using the top phrases by President Obama.a. Drag Position into Rowsi. Change the measure of Position toAverage so it looks likeAVG(Position).ii. Also add a quick table calculation to AVG(Position). Specifically, add the ‘percentof total’ quick table calculation.b. Drag Word Length into Columns. Change the measure toAverage.c. In the drop-down menu of the Marks Card, change it tosay “Text”d. Drag Phrase into the Text buttone. Drag Phrase Length into Color. Change itto AVG(Phrase Length).i. Change the Color to OrangeWhite-Blue Diverging. Also click“Reversed” Click Apply and clickOK.f. Now the graph looks a little cluttered.Let’s filter some things.g. Drag Candidate into Filters. Filter it by Obama.h. Drag Phrase Length into Filters.i. Set it up just like last time, as a range, and add it as a Quick Filter.ii. Drag the Max(Phrase Length) Quick Filter under the Marks Cardiii. Filter everything so that it shows the phrase lengths from 14 to 26.
i.j.k.l.m.n.o.p.Now we still have a lot of phrases showing. Let’s filter it down by a certain condition.Let’s assume that the most emphasized and meaningful phrases are those said morethan once. So, let’s filter the data to show only the phrases said more than one time.i. Drag Phrase into Filters.ii. Double click Phrase.iii. Under the General tab, go down tothe Summary area. You should seea field that says Condition: None.Click on the word None. This willbring up a Filter window.iv. In the Filter window, select By field:v. Using the drop-down arrow, selectPhrase. Select Count.vi. Select the greater than symbol andput a 1 in the text box.vii. Click Apply and Click OK.viii. You should now see the phrasessaid more than once.Let’s make the sizes of the words bigger.i. Drag Phrase Length into the SizeButton.ii. Change the measure to Average.iii. Now use the Size button to Resize the words.We now have a quasi-world cloud for the top phrases. Let’sformat the cloud so it looks cleaner.Right click on one axis. De-select “Show Header”. Do the samefor the other axis.Let’s remove the Grid Lines.i. Right click on the graph. Select Format.ii. Click on the tiny paintbrush icon under the Formatwindow.iii. Next to Grid Lines, change the drop down to say None.Success!Rename your worksheet “Top Phrases: Obama (Text)”Your worksheet should look something like this:Note: the tutorial data came from the example posted here - election08stump-speeches
II.Top Phrases: All other CandidatesNow that you have the skills to make a word cloud for Obama, make three additional ones for theremaining candidates (Romney, Clinton, and McCain). Save these as “Top Phrases:CANDIDATE NAME (Text)”Part 5: Dashboard & Write-Up (On Your Own)1. Using what we have just learned, create an interactive dashboard using the worksheets we justmade. Save the Dashboard as “Text Analysis Candidate Speeches”. Please include at least threegraphs. Please incorporate the filters and actions as well.2. Write-up a one page, double-spaced document about the scenario bellow:You are a newly hired analyst for a political consulting firm. Your boss knows that you learned some textanalytics in college. So, your boss wants you to write him a one-page document that describes what textanalytics is and what it can be used for. You decide to use the Text Analysis Candidate Speechesdashboard that you created to show your boss an example of text analytics. In the report, pleasedescribe text analytics, and how your dashboard could help gain insights into future presidentialspeeches for potential presidential candidates. Basically, why would you even bother with textanalytics? What could it do in the realm of political speeches? How could knowing the most usedkeywords, etc. help future candidates?Save your file as Text Analysis Write Up.docx.Please upload everything to the course website.
Tableau The following tutorial will show you how to perform text analysis in Tableau 8.2. To get started, you will need the following: Tableau version 8.2 Data: Political Speeches.xlsx Part 1: Loading the Dataset First, load the dataset into Tableau. Connect to Data In a file Microsoft Excel Select the Political Speeches.xlsx