Transcription
Welcome
#TC18Building Data Science Applications withTabPy and RNathan MannheimerProduct ManagerAdvanced Analytics
Who Am I? Product Manager for AdvancedAnalytics Lecturer in Data Science andHCDE at University ofWashington Former high school teacher inJapan and NCAA swimmer
Hiding within those mounds of data isknowledge that could change the lifeof a patient, or change the world.Atul ButteStanford
Session GoalsIntroduce Tableau’s external analytics integrationsExplore real data science use casesLearn how to adapt analysis scripts for TableauBuild self-service interactive dashboards to share insights
Who is this Session For?Data Scientist/AnalystWhere does Tableau fit into a data science and advanced analytics workflow and how can we mosteffectively share findings with business partners?Business Data ExplorersHow can we increase our cooperation and knowledge share with advanced analytics teams and putdata insights into action?
AgendaConnecting to External Services1. Sharing Interactive Exploratory Analysis2. Self-Service Time Series Forecasting3. Building and Deploying a Credit Classification Application
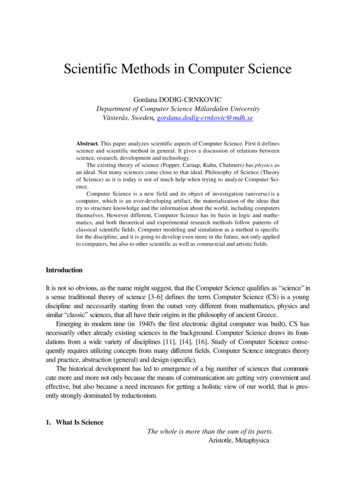
External Services Workflow
Connecting to R or Python
Connecting to an External Service Supported Connections Rserve TabPy/MATLAB Connection Information: Specify Service Type (New!) Choose Host and Port Security: Authenticate with Username/Password Set up encryption with SSL Cert (New!)
Connecting to an External Service
Sharing InteractiveExploratory Analysis
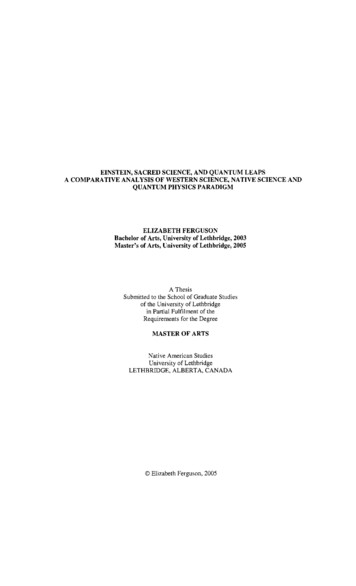
User Story – Dynamic Customer Analysis Question: What customers have similarattributes across dozens orhundreds of categories? Who stands out from thegroup? Answer: Decompose data into a twodimensional visualization. Explore dynamically usingparameters and filters.
Answer - Presenting Exploratory Analysis Visualizing PCA: Converting a python script forTableau Handling data and aggregation Building an interactive dashboard Further Exploration: Using parameters Using filters
Directly From Python
import pandas as pdfrom sklearn.decomposition import PCAfrom sklearn.preprocessing import StandardScalerdf pd.read csv(‘cars.csv’)scale StandardScaler()dat scale.fit transform(df)pca PCA(n components len(df.columns))comps pca.fit transform(dat)df pd.DataFrame(comps, columns ["comp 1","comp 2","comp 3"])df.plot(x "comp 1",y "comp 2", kind 'scatter', c cars['City MPG'], colormap 'viridis', legend False, colorbar True,title 'First and Second Principal Components Colored by City MPG')plt.show()
Tableau Calculation
Fully Adapted Code
SCRIPT REAL( "import pandas as pdfrom sklearn.decomposition import PCAfrom sklearn.preprocessing import StandardScalerpd.DataFrame({'mpg': arg1,'Cyl': arg2,'Cost': arg3,'EngSize': arg4,'HP': arg5,'Len': arg6,'Width': arg7})df pd.read csv(‘cars.csv’)scale StandardScaler()dat scale.fit transform(df)n comp len(df.columns)pca PCA(n components n comp)comps pca.fit transform(dat)df.plot(x "comp1",y "comp 2", kind 'scatter', c cars['City MPG'], colormap 'viridis', legend False,return list(comps[:, arg8[0]])",colorbar True, title 'First and Second Principal Components Colored by City MPG')SUM([City MPG]), SUM([Cyl]), SUM([Dealer Cost]), SUM([Engine Size]), SUM([HP]), SUM([Len]), SUM([Width]),[Selected PCA Component 1])
SCRIPT REAL("import pandas as pdfrom sklearn.decomposition import PCAfrom sklearn.preprocessing import StandardScalerdf pd.DataFrame({'mpg': arg1,'Cyl': arg2,'Cost': arg3,'EngSize': arg4,'HP': arg5,'Len': arg6,'Width': arg7})scale StandardScaler()dat scale.fit transform(df)n comp len(df.columns)pca PCA(n components n comp)comps pca.fit transform(dat)return list(comps[:, arg8[0]])",SUM([City MPG]), SUM([Cyl]), SUM([Dealer Cost]), SUM([Engine Size]), SUM([HP]), SUM([Len]), SUM([Width]),[Selected PCA Component 1])
R PCA Code
SCRIPT .arg5,.arg6,.arg7), cor TRUE) score[,.arg8[1]]",SUM([City MPG]),SUM([Cyl]),SUM([Dealer Cost]),SUM([Engine Size]),SUM([HP]),SUM([Len]),SUM([Width]),[Selected PCA Component 1])
Let’s Take a Look!
Tech Tip - Setting the Correct Table Calculation
Tech Tip - Setting the Correct Table Calculation
Tech Tip - Setting the Correct Table Calculation
Self-Service Time SeriesForecast Application
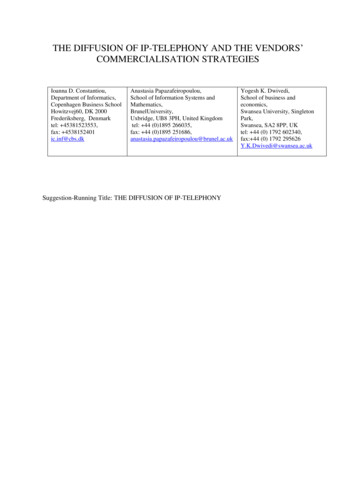
User Story – Dynamic Forecasting atQuestion: Visually exploring forecastresults during model evaluation. Sharing product utilizationforecasts with businessmanagers with current data.Answer: Adapting custom model script foruse in Tableau. Sharing results in interactivedashboard in Tableau Server.
Creating a Self-Service Forecast ApplicationConverting a Script: Understanding how to pass data Returning correct results.Enabling Self-Service: Building an interactive forecastdashboard. Deploying a Dashboard toTableau Server for self-serviceexploration.
Directly From Python
import pandas as pdimport numpy as npfrom fbprophet import Prophetdf pd.read csv(‘login history.csv’)periods to fcast 50m Prophet()m.fit(df);future m.make future dataframe(periods periods to fcast)forecast m.predict(future)m.plot(forecast)
Tableau Calculation
Fully Adapted Code
SCRIPT REAL(“ import pandas as pdimport numpy as npfrom fbprophet import Prophetperiod arg3[0] 1df pd.DataFrame({'ds': arg1, 'y': arg2 })m Prophet()df df[:-period]m.fit(df)future m.make future dataframe(periods period)forecast m.predict(future)return forecast['yhat'].tolist()",ATTR([Date]), SUM([Logins]), [Periods to Forecast])
R Forecast Code
SCRIPT REAL("library(prophet)period .arg3[1] 1df data.frame('ds' .arg1, 'y' .arg2)divide nrow(df)-perioddf df[1:divide,]m prophet(df)future make future dataframe(m, periods period)forecast predict(m, ns]),[Periods to Forecast])
Let’s Take a Look!
Tech Tip - Custom Forecasting in Tableau
Custom Forecasting in Tableau
Custom Forecasting in Tableau
Custom Forecasting in Tableau
Custom Forecasting in Tableau
Building and Deploying aCredit ClassificationApplication
User Story – Self-Service Model DeploymentQuestion: Teams have models they wantto deploy into production. Business users want to exploreand iterate on models in realtime.Answer: Deploy model in TabPy. Make model accessible andinteractive in a dashboardapplication.
Building a Loan Scoring ApplicationBuilding a Model: Training and evaluating Adapting for TableauModel Simulation: Inputting data Visualizing resultsDeploying at Scale: Self-service applications Tableau Server
Let’s Take a Look!
Tech Tip – Creating a Model in Jupyter
Tech Tip – Deploying a Function in TabPy
Let’s Take a Look!
Tech Tip – Model Simulation
ConclusionData Science: Framing business questions Building a model Adapting code and operationalizing using TableauBusiness Use Cases: Exploring complex problems visually Scaling with Tableau ServerTableau in Data Science: Exploratory data analysis Operationalization
Questions?nmannheimer@tableau.com
Please complete thesession survey from theSession Details screenin your TC18 app
R E L AT E D S E S S I O N SAdvanced analytics at scale Deployingmachine learning in the enterpriseToday 12:30 – 1:30 MCCNO - L3 - 346Embedding Tableau for self-service data scienceToday 2:15 – 3:15 MCCNO - L2 - R02
#TC18Thank you!Contact me at nmannheimer@tableau.com
Advanced Analytics #TC18. Who Am I? Product Manager for Advanced Analytics . Stanford. Session Goals Introduce Tableau’s external analytics integrations Explore real data science use cases Learn how to adapt analysis scripts for Tableau Build self-service interactive dashboards . Training and ev