Transcription
Approaches to Process PerformanceModeling: A Summary from the SEISeries of Workshops on CMMI HighMaturity Measurement and AnalysisRobert W. Stoddard IIDennis R. GoldensonJanuary 2010TECHNICAL REPORTCMU/SEI-2009-TR-021ESC-TR-2009-021Software Engineering Measurement and AnalysisUnlimited distribution subject to the copyright.http://www.sei.cmu.edu
This report was prepared for theSEI Administrative AgentESC/XPK5 Eglin StreetHanscom AFB, MA 01731-2100The ideas and findings in this report should not be construed as an official DoD position. It is publishedin the interest of scientific and technical information exchange.This work is sponsored by the U.S. Department of Defense. The Software Engineering Institute is afederally funded research and development center sponsored by the U.S. Department of Defense.Copyright 2010 Carnegie Mellon University.NO WARRANTYTHIS CARNEGIE MELLON UNIVERSITY AND SOFTWARE ENGINEERING INSTITUTE MATERIALIS FURNISHED ON AN "AS-IS" BASIS. CARNEGIE MELLON UNIVERSITY MAKES NOWARRANTIES OF ANY KIND, EITHER EXPRESSED OR IMPLIED, AS TO ANY MATTERINCLUDING, BUT NOT LIMITED TO, WARRANTY OF FITNESS FOR PURPOSE ORMERCHANTABILITY, EXCLUSIVITY, OR RESULTS OBTAINED FROM USE OF THE MATERIAL.CARNEGIE MELLON UNIVERSITY DOES NOT MAKE ANY WARRANTY OF ANY KIND WITHRESPECT TO FREEDOM FROM PATENT, TRADEMARK, OR COPYRIGHT INFRINGEMENT.Use of any trademarks in this report is not intended in any way to infringe on the rights of the trademarkholder.Internal use. Permission to reproduce this document and to prepare derivative works from this document for internal use is granted, provided the copyright and "No Warranty" statements are included withall reproductions and derivative works.External use. This document may be reproduced in its entirety, without modification, and freely distributed in written or electronic form without requesting formal permission. Permission is required for anyother external and/or commercial use. Requests for permission should be directed to the Software Engineering Institute at permission@sei.cmu.edu.This work was created in the performance of Federal Government Contract Number FA8721-05-C-0003with Carnegie Mellon University for the operation of the Software Engineering Institute, a federally funded research and development center. The Government of the United States has a royalty-free government-purpose license to use, duplicate, or disclose the work, in whole or in part and in any manner, andto have or permit others to do so, for government purposes pursuant to the copyright license under theclause at 252.227-7013.
Table of ContentsTable of 1.1 Workshops Two and Three: Goals and Participants1.2 Structure of Workshops1.3 Healthy Ingredients of Process Performance Models11332Model Presentations2.1 Discrete Event Simulation311112.2Putting Process Performance Models to Work in the Real World: An Example andRecommendationsPutting Process Performance Models to Work: A NASA ExampleA Process Performance Model Used Within Lockheed Martin MS2Monte Carlo2.3Compose Process ModelScheduling Analysis of Variability Engine (SAVE)Process Performance Models: Process, Results, and Lessons Learned with theSystem Lifecycle Analysis Model (SLAM)Evaluation of SPI Efforts in Small & Medium OrganizationsEvaluation of SPI Efforts in Small & Medium Organizations: An Update withNew ResultsOther Simulation Approaches2.4Conceptual Planning, Execution, and Operation of Combat Fire SupportEffectiveness: A Thinking Model with Practical MeasurementsGame Theory and Bayesian Belief Network to Support Quality FunctionDeployment (QFD) for Requirements DevelopmentProduct Modeling to Insure Reliability of High Maturity IndicatorsSoftware Maturity ModelingDefect DiscoveryProcess Performance Modeling With Parametric Cost ModelsProcess Performance Baseline for Northrop Grumman Mission SystemsStatistical Methods424548505359602.5CAPRE Effort Estimation and Tracking Model Using Dummy Variable LinearRegressionCustomer Satisfaction ModelTailoring Baselines and ModelsContinuous Improvement for Cost of QualityTraining Improvement Through Competence Measurement & AnalysisProgram Staff Effectiveness ModelQuality PPM Development for F-16 Operational Flight ProgramsModeling with TSP6063657274768183Uses of Monte Carlo Simulation for TSP TeamsProcess Performance Models and PSP/TSPProcess Performance Baselines and Models in PSP and TSP838487Other Workshop Sessions3.1 Special Session: Improving Estimates of Prediction Errori CMU/SEI-2009-TR-02111131619192326283137379191
3.23.3Panel Session: Process Performance Models: Issues, and ObstaclesBreak-Out SessionsUse and Outcomes of Process Performance ModelingApproaches to Process Performance ModelingThe Future: “Goal-Question-Model”Deployment and Adoption of Process Performance ModelsAnalytical Methods, Techniques, and Tools4Summary and Next StepsReferences/Bibliographyii CMU/SEI-2009-TR-021929696979899100103105
List of FiguresFigure 1:Healthy Ingredients of Process Performance ModelsFigure 2:NASA Model with IV & V Layer on IEEE 12207 Life-cycle Process15Figure 3:Drawing Release Process, Initial State17Figure 4:Drawing Release Process After Process Modeling18Figure 5:SAVE Model Interface24Figure 6:Organization Size and Investment Horizon30Figure 7:NPV Through Maturity Level 3 as a Function of Organization Size and Time Horizon32Figure 8:Process Improvement Trends33Figure 9:NPV Through Maturity Level 5 as a Function of Organization Size and Time Horizon34Figure 10:NPV as a Function of ROI and Expenditures per Engineer35Figure 11:NPV as a Function of ROI, Business Risk, and CMMI Maturity Level36Figure 12:Bayesian Conceptual Way of Thinking39Figure 13:Three-Dimensional View40Figure 14:Bayesian Representation of New Product Development41Figure 15:Interpretation of Structure Matrices47Figure 16:Rayleigh Curve Using STEER II52Figure 17:Defect Discovery Phase-Based Model Using STEER Predictions53Figure 18:Parametric Cost Models as PPMs: Calibration is Critical56Figure 19:Development, Use, and Calibration of the Lockheed Martin PCMs56Figure 20:Output from COSYSMOR Showing Calculated Risk Probability perLevel of Person Hours58Figure 21:Results from the CAPRE Model62Figure 22:Subprocesses for the CAPRE Model63Figure 23:Graphs Showing Normality Test for Hours67Figure 24:Mood Median Test68Figure 25:Tests for Equal Variance68Figure 26:Interface in Rough Estimation Model69Figure 27:Interface in Regression Estimation Model70Figure 28:Crystal Ball Output of Regression Estimation Model71Figure 29:Functional Structure of Multiple Regression Model80Figure 30:TSP Quality Plan One85Figure 31:TSP Quality Plan Two85Figure 32:Quality Profiles87iii CMU/SEI-2009-TR-0216
iv CMU/SEI-2009-TR-021
List of TablesTable 1:Healthy Ingredients in PresentationsTable 2:Statistical Results from a Simulation Run of the Drawing Release Model19Table 3:Defect Prediction Model21Table 4:Cycle Time Prediction Model22Table 5:Parametric Cost Models vs. Process Performance Models54Table 6:Uncertainty / Range Size of Parameter Values57Table 7:Design Levels and Associated Systems Engineering Effort58Table 8:Award Fee Criteria and Indicators64Table 9:Factors in the Process Tailoring Model66Table 10:Factors in Program Staff Effectiveness Model77Table 11:x Factors in the Process Performance Model78v CMU/SEI-2009-TR-0218
vi CMU/SEI-2009-TR-021
AcknowledgmentsFirst of all, special thanks go to the presenters and their co-authors, without whom this report andthe workshops themselves would have been impossible. The same is true for our colleagues at theSEI who participated in and otherwise supported the workshops. Dave Zubrow was instrumentalin establishing the workshop series. He and Mike Konrad also supported the planning and conductof the two workshops that are described in this report. Gene Miluk also supported us at bothworkshops. He was joined by Alex Stall, Kevin Schaaf, and Jim Over at the second workshop. Asusual, Erin Harper’s exceptional writing and editing skills combined with her deep understandingof the content were indispensible for ensuring the quality and timeliness of this report. Mike Phillips, Kevin Schaaf, and Dave Zubrow provided valuable review comments for which we are mostappreciative. Special thanks also go to the NDIA’s Sam Campagna for his logistic efforts in arranging the workshop that was collocated with the 2008 CMMI Technology Conference and UserGroup. Our SEI colleague Caroline Graettinger provided similar support along with Linda Canonand Ruth Gregg, two of the SEI event planners with whom she worked at the 2009 SEPG NorthAmerica conference in San Jose, where the other workshop was collocated.vii CMU/SEI-2009-TR-021
viii CMU/SEI-2009-TR-021
AbstractMore and more organizations are striving for and achieving high maturity status, yet there is stillan insufficient shared understanding of how best to implement measurement and analysis practices appropriate for high maturity organizations. A series of twice-yearly workshops organized bythe Software Engineering Institute (SEI) allows organizations to share lessons learned to accelerate the adoption of best measurement and analysis practices in high maturity organizations.This report summarizes the results from the second and third high maturity measurement andanalysis workshops. The participants’ presentations described their experiences with process performance models; the goals and outcomes of the modeling; the x factors used; the data collectionmethods; and the statistical, simulation, or probabilistic modeling techniques used. Overall summaries of the experience and future plans for modeling also were provided by participants.This report also includes a summary of the “healthy ingredients” that are needed for process performance models and a table showing which healthy ingredients were visible in the models described in the presentations. By making the models that were shared in these workshops morewidely available in this report, the community as a whole can benefit from the exciting and innovative ideas for process performance models implemented by leading organizations in the field.ix CMU/SEI-2009-TR-021
x CMU/SEI-2009-TR-021
1 IntroductionMore and more organizations are striving for and achieving high maturity status, yet there is stillan insufficient shared understanding of how best to implement measurement and analysis practices that are appropriate for high maturity organizations. A series of twice-yearly workshops organized by the SEI allows organizations to share lessons learned to accelerate the adoption of bestmeasurement and analysis practices in high maturity organizations.The workshops provide a unique opportunity for candid discussions among participants fromleading organizations in the field. Participants from different units of the same large organizationswho had not known each other before have begun to work together collaboratively. People fromdifferent organizations have also begun to work together to their mutual benefit. The broader goalof the workshop series is to promote the establishment of a viable community of interest aroundhigh maturity measurement and analysis that extends well beyond the relatively small number ofworkshop participants.Three workshops were held prior to the writing of this report, focusing on the deployment, adoption, and institutionalization of process performance baselines and models. As more workshopsare held, the focus will broaden to include other analytic methods, how they have been used, theperformance and quality outcomes that have been achieved, and the organizational circumstancesunder which such models are likely to be used effectively.The workshops in this series are meant to guide ongoing research and transition activities relatedto process performance modeling and analytical practices. The participants discussed what theyfound useful for quantitative management, process performance, and product quality in their organizations, regardless of whether those practices fully satisfied CMMI high maturity appraisalcriteria. Discussions of high maturity appraisal criteria and updates to the CMMI models and theSCAMPI A Method Definition Document (MDD) remained for the most part outside the scope ofthe workshops and this document.1.1Workshops Two and Three: Goals and ParticipantsParticipation in the first workshop was limited to a small group of organizations who were earlyadopters of process performance models and baselines and was by invitation only. A summary ofthe first workshop can be found in CMMI High Maturity Measurement and Analysis WorkshopReport: March 2008 [1]. Wider solicitations for proposals were made for the second and thirdworkshops. Participants were required to submit case descriptions with empirical evidence forreview before being accepted to the workshop. The presentations needed to include thorough casestudies, with results presented in quantitative terms. The practice descriptions needed to be discussed in sufficient detail to be meaningful to the other workshop participants.Participants were asked to include the following topics in their presentations: descriptions of the process performance models, including who developed them, what initiated the development, who used them, and how often they were used business and project goals and how the goal alignment led to the identity and use of the model1 CMU/SEI-2009-TR-021
outcomes predicted by the process performance models (PPMs), the type of data output, andthe audience for each outcome and why it was important to them descriptions of the x factors used in the model to predict the outcomes data collection practices a description of all statistical, simulation, or probabilistic modeling techniques used and therationale for their selection results and benefits of using the process performance models an overall summary of the experience and future plans for modeling in the organizationThis can be and was done productively without disclosing proprietary information. Quantitativeresults occasionally were normalized for the same reason.The second workshop was held in Denver, Colorado, November 21-22, 2008. Presentations wereprepared by the following: Stephen Austin and Bob Beckley, Lockheed Martin Dan Bennett, Rushby Craig, and Kevin Tjoland; Ogden Air Logistics Center Pedro E. Colla, Instituto Universitario Aeronáutico and Universidad Tecnológica NacionalFacultad Regional Santa Fé; and Jorge Marcelo Montagna, INGAR-Instituto de Desarrollo yDiseño, Centro de Investigación y Desarrollo de Ingeniería en Sistemas de Información, Universidad Tecnológica Nacional-Facultad Regional Santa Fé Rick Hefner, Northrop Grumman Mission Systems Mark Kelley, Esterline AVISTA Shankar Mallapur, Johnson Varghese, and Gayathri Pallail; Accenture Services Pvt Ltd Neal Mackertich, Michael Campo, and Rachel Beitz; Raytheon Integrated Defense Systems Lynn Penn and Pete McLoone, Lockheed Martin Information Systems and Global Services Jim Perry, BAE Armament Systems David M. Raffo, Portland State University Kobi Vider-Picker, K.V.P. Consulting David Webb, Hill Air Force Base; David Tuma, Tuma Solutions; Jim Van Buren, Draper Laboratory; and Robert Stoddard, Software Engineering InstituteThe third workshop was held in San Jose, California, March 27-28, 2009. Presentations were prepared by the following: Yoshihiro Akiyama, Kyushu Institute, Technology and Next Process Institute Pedro E. Colla, Instituto Universitario Aeronáutico and Universidad Tecnológica NacionalFacultad Regional Santa Fé; and Jorge Marcelo Montagna, INGAR-Instituto de Desarrollo yDiseño, Centro de Investigación y Desarrollo de Ingeniería en Sistemas de Información, Universidad Tecnológica Nacional-Facultad Regional Santa Fé Brooke Eiche, Lockheed Martin Systems Integration Mike Konrad, Software Engineering Institute Angel Liu, Motorola China2 CMU/SEI-2009-TR-021
Diane Mizukami Williams, Northrop Grumman Corporation David M. Raffo, Portland State University Kathy Smith, Hewlett Packard Lynn Penn, Lockheed Martin Information Systems and Global Services Neal Mackertich and Michael Campo, Raytheon Integrated Defense Systems Raymond Kile, John Gaffney, and Joan Weszka; Lockheed Martin Corporate Engineeringand Technology Systems and Software Resource Center Kobi Vider-Picker, K.V.P. Consulting1.2Structure of WorkshopsWorkshops two and three began with presentations from the participants, with time allowed aftereach for questions and answers.The presentations were followed by breakout working sessions with teams meeting in parallel. Thegoal of the sessions was to produce recommendations related to reducing barriers to effective training and staffing, management support, alignment of modeling to business goals, and using differentanalytical forms of modeling. Workshop three also included a panel session on issues and obstaclesto effective process performance modeling.The presentations covered many different analytical approaches, including statistical or mathematical, descriptive, probabilistic, and simulation. Some used large-scale baselines while others usedsmall datasets. Still others addressed issues of coping with missing and imperfect data, as well as theuse of expert judgment to calibrate the models. Most of the presentations described the use of themodels in large organizations consisting of multiple and sometimes disparate stakeholders, butsmaller organizations also were included as were comparisons across organizations. The interim andfinal performance outcomes predicted by the models also differed considerably (e.g., defect prevention, customer satisfaction, other quality attributes, aspects of requirements management, return oninvestment, cost, schedule, efficiency of resource usage, and staff skills as a function of trainingpractices). Of course all of the various predictive factors also differed as a function of the outcomespredicted by the models that were presented.Thumbnail descriptions of the presentations can be seen in Table 1 beginning on page 8, along witha discussion of the ways in which the healthy ingredients of a CMMI process performance modelwere covered in the presentations. Fuller synopses of the presentations can be found in Section 2.They are categorized by the different analytical approaches used in the presentations.1 The paneland break-out sessions are summarized in Section 3.1.3Healthy Ingredients of Process Performance ModelsDiscussion of the “healthy ingredients” of CMMI process performance models began in 2007with SEI presentations at SEPG conferences and was amplified in the SEI course UnderstandingCMMI High Maturity Practices (UCHMP). The healthy ingredients were first elaborated dynami1An additional synopsis of a presentation that briefly discussed analytical methods aimed at “Improving Estimates of Prediction Error” also appears in Section 3.3 CMU/SEI-2009-TR-021
cally during the conduct of SEI measurement courses in 2006 and 2007 as a means of communicating what process performance models were in concrete, practical terms. The ingredients arederived from a holistic understanding of the intent of the CMMI models. The precise nature ofseveral of the ingredients also comes from training, experience, and practice within the Six Sigmaarena. The healthy ingredients of a process performance model are summarized below. The model is statistical, probabilistic, or simulation based. This particular ingredient emphasizes the logical consistency of two CMMI process areas: Quantitative Project Management(QPM) and Organizational Process Performance (OPP). QPM stresses the need for understanding statistical variation of process performance factors. Additionally, QPM reinforcesthe need to separate assignable, special cause variation from inherent common cause variationto help understand what actions to take with respect to each type of variation. This healthy ingredient emphasizes the need for process performance models to model the uncertainty of thepredictive factors and their resulting impact on the uncertainty of the behavior of the outcomefactor. For this reason, deterministic models that merely perform mathematical calculationson point estimates fall short of the superior information achievable from models that are statistical, probabilistic, or simulation in nature. The model predicts interim and/or final project outcomes. This ingredient derives more frompractical experience and management’s need for real-time cycles of learning within a givenproject or program. To maximize real-time cycles of learning within a given project or program, managers need to predict interim performance outcomes in addition to the traditionalend-of-project performance outcomes. The model uses controllable predictive factors that are directly tied to subprocesses or workactivities. This healthy ingredient focuses on the need for process performance models to beactionable. From that standpoint, if a model does not have at least one controllable predictivefactor, it does not directly promote insight for action to influence the undesirable predictedoutcome. For example, traditional project forecasting models that model only uncontrollablefactors make predictions that offer little help or insight into the actions to be taken to drive amore desirable predicted outcome. Additionally, this ingredient highlights the need for thecontrollable factors to be detailed enough to show a clear link to a specific subprocess orwork activity. This clear link enables proactive management responses. The model quantitatively characterizes and models the variation of the predictive factors anddescribes the predicted range, uncertainty, or variation of the outcome performance measures.This ingredient is a chief overlap of CMMI high maturity and Six Sigma concepts. Recognizing that variation (i.e., risk) may very well be unbalanced and significant in the real world, themodels account for this by modeling the uncertainty of the predictive factors. Numerous examples exist in industry in which analysis using only the mean or average estimate rather thanthe distributional information caused serious problems in predictions of schedule, performance, and other modeled factors. The model enables “what-if” analysis for project planning, dynamic re-planning, and problemresolution during project execution. This ingredient builds on language in the CMMI Organizational Process Performance (OPP), Quantitative Project Management (QPM), Organizational Innovation and Deployment (OID), and Causal Analysis and Resolution (CAR) processareas related to the use of process performance models to support “what-if” and sensitivityanalysis. The idea is that decision makers will be able to use process performance models to4 CMU/SEI-2009-TR-021
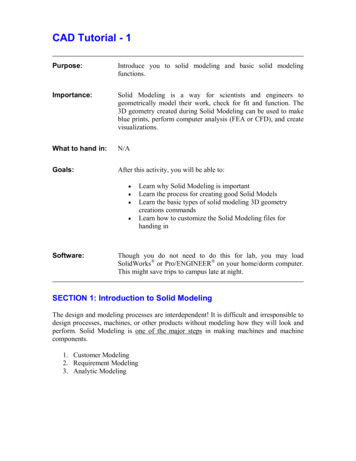
analyze alternative courses of action and alternative improvement ideas. Again, this highlights a capability intended to be exercised within a given project or program execution. The model connects upstream activity with downstream activity. This particular ingredientemphasizes the intent of process performance models to enable decision makers to observe aprediction of the consequences of decisions made earlier in the life cycle or process. Indeed,this ingredient highlights the practical use of process performance models for transitions fromphase to phase, hand-offs from one group to another, and so on. This particular ingredient enables the establishment and enforcement of interface agreements between internal groupsand/or external groups by providing models that predict the readiness and maturity of an artifact or work product to proceed to the next step. For example, many organizations employsuch models to predict defects entering system test while the code is still with the development team. Others use models to predict readiness of design or code to enter an inspection.Still other organizations use models in this fashion to determine if product and software requirements are sufficiently mature and stable to begin intense development. The model enables projects to achieve mid-course corrections to ensure project success. Thisingredient highlights a very significant aspect that may be read into the usage of process performance models in CMMI. Specifically, within the QPM process area, process performancemodels may be used to anticipate undesirable performance with enough lead time to proactively influence the situation toward a successful outcome. Industry experience with this aspect is quite strong, especially in the use of critical parameter management in the Design forSix Sigma (DFSS) community. The notion is that models of critical parameters of the productdesign foster early insight into issues in products and processes enabling management to takecorrective and preventive action. For this reason, organizations employ a collection of processperformance models to cover their needs throughout the project life cycle.Figure 1 expresses the healthy ingredients visually. The outermost box represents all models, bethey qualitative or quantitative in nature. The innermost box represents the set of models thatfaithfully meet the entire list of healthy ingredients. While they may still offer substantial businessvalue, the outer boxes moving inward describe other types of modeling that may include only oneor more of the healthy ingredients. To read the figure, focus first on the outermost box labeled“All Models (Qualitative and Quantitative)”. The “Anecdotal Biased Samples” label on the rightside of the box emphasizes that the set of all models that reside in the outermost layer may containonly anecdotal biased samples. Similarly, models represented by the first embedded box, “Quantitative Models (Deterministic, Statistical, Probabilistic),” go beyond anecdotal biased samples andare based on quantitative data; however, they may not model uncertainty or variation. Models represented by each subsequent box embedded inward add a new healthy ingredient as they continueto incorporate the sets of healthy ingredients that were missing previously.5 CMU/SEI-2009-TR-021
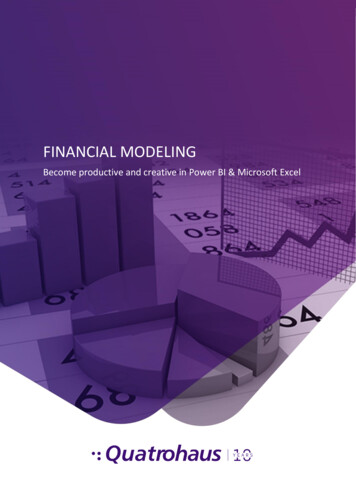
All Models (Qualitative and Quantitative)Quantitative Models (Deterministic, Statistical, Probabilistic)Statistical or Probabilistic ModelsAnecdotalBiasedsamplesInterim outcomes predictedControllable x factors involvedProcess PerformanceModel With controllable xfactors tied toProcesses and/or SubprocessesFigure 1:QQualOnly phasesor lifecyclesare modeledOnlyuncontrollablefactors aremodeledNouncertaintyor variationOnly final modeledoutcomesaremodeledHealthy Ingredients of Process Performance ModelsThe discussion of the healthy ingredients in this technical report comes from a perspective of boththe intent of the CMMI model and the practical use and benefits now apparent in industry. Thediscussion purposely excludes commentary related to the SCAMPI appraisal perspective and doesnot purport to address the criteria used by the SCAMPI method and lead appraiser community foracceptable process performance model implementation.With that said, the workshop series on CMMI high maturity measurement and analysis was designed to communicate the healthy ingredients included and the business benefits gained by theworkshop participants in using models that strive to meet the definition and purpose of processperformance models. Not all models in practice embody the entire set of healthy ingredients.However, organizations have used collections of process performance models that togetherachieve the set of healthy ingredients. This positive discussion is also meant to promote additionalinnovative thought as to how the existing models might be further enhanced with additionaltreatment of other healthy ingredients.By making the models that were shared in these two workshops more widely available in this report, we hope that the community as a whole will benefit from the exciting and innovative ideasfor process performance models implemented by leading organizations in the field.Table 1 identifies the healthy ingredients that were clearly evident to the SEI workshop hosts during the individual workshop presentations. Each presentation discussed some or all of the healthyingredients. In some cases, the presentation authors acknowledged that future work would be pursued to incorporate missing healthy ingredients. In other cases, the presentation authors did notdiscuss all of the healthy ingredients or chose, for business purposes, not to include all of them intheir models. As such, this table is not intended to grade the models, but instead to aid the readerin quickly searching for models that emphasize particular healthy ingredients in more detail.6 CMU/SEI-2009-TR-021
The healthy ingredients of the models are summarized in the table on the next page. The numbersindicate which healthy ingredients were visible in each model or models described in each presentation. The table is categorized by the analytical approaches used in the presentations, which arelisted in the same order as the fuller descriptions in Section 2.7 CMU/SEI-2009-TR-021
Table 1:Healthy Ingredients in Presentations1.2.3.4.was statistical, probabilistic, or simulation in naturepredicted interim and/or final project outcomesused controllable predictive factors directly tied to subprocesses or work activitiesquantitatively characterized and modeled the variation of the predictive factors and understood thepredicted range, uncertainty, or variation of the outcome performance measures5. enabled what-if analysis for project planning, dynamic re-planning, and problem resolution during projectexecution6. connected upstream activity with downstream activity7. enabled projects to achieve mid-course corrections to ensure project successPresentationPresenterModel Purpose1 2 3 4 5 6 7Used discrete event simulation to predict schedulevariance and quality based on a variety o
3.2 Panel Session: Process Performance Models: Issues, and Obstacles 92 3.3 Break-Out Sessions 96 Use and Outcomes of Process Performance Modeling 96 Approaches to Process Performance Modeling 97 The Future: "Goal-Question-Model" 98 Deployment and Adoption of Process Performance Models 99 Analytical Methods, Techniques, and Tools 100