Transcription
basicallylikeDigitalMediaOTT Market Update Fall 2021
Houlihan Lokey OTT Market UpdateDear Friends and Partners,With vaccinations on the rise, global markets are beginning to once again find their footing in a post pandemic world. One trend we’ve been watching closely is howconsumer behavior, having evolved drastically during the pandemic while individuals around the world sheltered in place, will impact media companies as the nucleus ofdaily activities shifts outside the home yet again. What we have found is that, good or bad, the changes to everyday life that arrived alongside the virus are shaping a newOver-the-Top (OTT) landscape that is here to stay.Over the course of the pandemic, we’ve watched as consumers transcended the boundaries of their homes by consuming more TV hours than ever before. This increasedrate of content consumption spurred new trends within the OTT industry, as consumers accrued more platform subscriptions in pursuit of content variety. As a result,newcomers to the Subscription Video-on-Demand (SVOD) market boomed, as we saw with Disney ’s spectacular catapult to the top alongside other heavyweightcompetitors. Meanwhile, emerging competition from Advertising-Based Video-on-Demand (AVOD) services garnered significant consumer buy-in—further fragmentingcompetition in a crowded market. Given the continued changes in the competitive landscape, we expect that M&A activity will continue to flourish amid substantial pressurefor OTT providers to differentiate their content portfolios as part of a mounting subscriber retention roadmap.We hope that this update serves as an asset as you evaluate the new normal within the OTT landscape. As this market continues to evolve, we would be happy to discussthese market developments and look forward to staying in touch with you.Regards,Roy KablaManaging DirectorGlobal Co-Head of TMT GroupRKabla@HL.com212.497.4193Daniel GosselsManaging DirectorDGossels@HL.com212.497.7979Ronald de GierSenior Vice PresidentRDeGier@HL.com212.497.4157Justin MundaAssociateJMunda@HL.com310.789.5740Paul y, Media, and Telecom Subverticals CoveredAdventure ToursAdvertising ServicesAudio EntertainmentB2B EventsBroadcastingCasino GamingDigital ContentDigital MarketingDigital MusicDigital PublishingDigital SignageE-GamingE-SportsFiber NetworksFixed and Mobile BroadbandHosting and Data CentersLeisure, Entertainment, and LodgingLive EntertainmentMusic B2B ServicesMusic Recording and PublishingOnline Casino TechnologyOTT VideoOut-of-Home EntertainmentOut-of-Home AdvertisingPodcastingSports BettingSports Leagues, IP, and ContentSports Franchises and VenuesSports Data and TechnologySatellite CommunicationsTalent AgenciesTheme ParksVideo Content and EntertainmentVideo GamesWholesale and B2B Telecom Services2
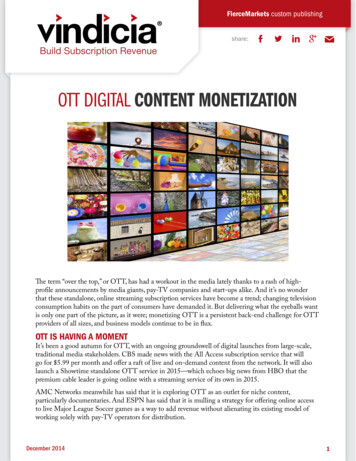
Pay TV Headwinds ContinueSignificant declines in pay TV subscribers continue, driven by a plethora of new streaming platform launches and the developingubiquity of virtual multichannel video programming distributors (vMVPDs). Decline in traditional pay TV penetration has rapidly accelerated in U.S. households since peak penetration in 2010. By 2024, only 55% of U.S. households are expected to have pay TV subscriptions. Amid an abundance of options, consumers are replacing pay TV subscriptions with a mix of SVOD, AVOD, and vMVPD services toaccess their favorite content. The vMVPD landscape continues to see strong momentum—further eroding the pay TV market—with Hulu Live and YouTube TVcapturing the lion’s share of growth in the past two years. Premium channels and sports programming may not be able to save pay TV providers from churn amid the rise of vMVPDs that allowconsumers to stream programming 24 hours a day while retaining choice channels from their cable packages.Pay TV Penetration Declines Continue(1)Cumulative vMVPD Subscribers(2)Pay TV Households as % of Total U.S. HouseholdsSubscribers in thousands79% 79%80%81%82% 82%81% 81%80%79%Sling TVYouTube TVOther77%76%75%DirecTV Now (ex-free trials)Hulu %62%59%57%5,38055%3,777(1) Wall Street research.(2) Wall Street research.916Q1 2015Q2 2015Q3 2015Q4 2015Q1 2016Q2 2016Q3 2016Q4 2016Q1 2017Q2 2017Q3 2017Q4 2017Q1 2018Q2 2018Q3 2018Q4 2018Q1 2019Q2 2019Q3 2019Q4 2019Q1 2020Q2 2020Q3 2020Q4 2020Q1 2021Q2 2021Q3 2021Q4 14201320122011201020092008200720062005184 4592,4881,4333
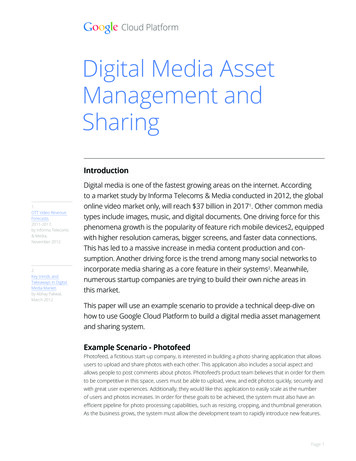
Robust Outlook for OTT The OTT market has boomed over the past year, due to the combination of worldwide shelter-in-place orders amid COVID-19 and theproliferation of high-quality OTT offerings from media and tech heavyweights, which has caused consumers to accrue more platformsubscriptions and devour more content hours than ever before. In North America, the OTT market (including subscriptions, advertising, and pay-per-view) is expected to grow an explosive 22% in 2021,with strength in both SVOD and AVOD. However, with signs of market maturation showing, many analysts expect North American growthto moderate over the next five years (to approximately 10% growth between 2021 and 2026).(1) The proliferation of SVOD services are starting to weigh on North American consumers (and their wallets), driving demand for AVODalternatives. In 2021, North American AVOD revenues are expected to grow nearly 27% vs. SVOD’s 23% and are expected to exceedSVOD growth over the next five years (19% CAGR vs. 6% CAGR for AVOD and SVOD, respectively).(1) OTT adoption (and revenue growth) in international markets has lagged the North American OTT market over the past year. Lookingahead, however, we expect to see heavyweight players set their sights on international markets for new audiences and growth. As a result,the OTT market outside of North America is projected to grow from 58 billion to 116 billion (a 15% CAGR) between 2021 and 2026.(1) On the horizon, the population of “cord-nevers” continues to expand, signifying a positive outlook for OTT growth, as many Gen Zers areentering adulthood having never held traditional cable subscriptions, with a preference for content on demand over linear TV.Cord-Cutters and Cord-Nevers Continue to Rise(2)Growing OTT Market(1)North American OTT revenue(in billions)SVODAVODOther (3)93.759.648.85.610.732.620202021ECumulative number (in thousands) of cord-cutter / cord-never .074.020202021E38,54635,0006.75.813.640.2Global OTT revenue(in billions)SVODAVOD10,0005,0002026E(1) Digital TV Research, May 2021; (2) MoffettNathanson, September 2021; (3) Other includes DTO and rental.0Q216 Q416 Q217 Q417 Q218 Q418 Q219 Q419 Q220 Q420 Q2214
OTT/Direct to Consumer Is a Top Strategic Priority for All MajorMedia and Tech CompaniesSignificant pressure to scale direct-to-consumer offerings is resulting in heavy investments in OTT platforms, both organically andthrough M&A.is first to marketwith launch of2014launches alimited rollout ofexpands OTTcapabilitiesacross launches as asoccer streamingserviceSource: Company websites.launches freeAVOD andad-supportedvMVPD servicelaunches SVODservice2019launches newSVOD serviceacquires AVODplatformfor 340Macquires free liveTV and AVODplatformacquires AVODplatformto launchSVOD platformlaunches SVODplatform2020acquires minoritystakes fromAT&Tand Comcast forfull control ofDisney launches with10M subscribersacquiresWalmart’s TVOD/AVOD offeringlaunches hybridplatform2021launches ninthstreamingplatformlaunches hybridplatformacquiresHispanic-focusedAVOD serviceand launches5
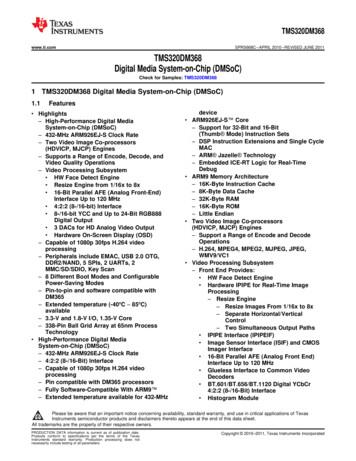
Battle for Subscribers ContinuesThe customer acquisition war is intensifying across the SVOD market, with new entrants proving that quality content wins market share. Over the past three years, the SVOD landscape has transformed from a head-to-head competition between Netflix and Amazon Primeto a multiparty battle between media and technology heavyweights—many of whom are investing heavily in their direct-to-consumer/OTT platforms in a fight to win subscribers. Netflix, once the dominant player in SVOD but now running neck and neck with Amazon Prime, is at risk of losing its top spot if currentgrowth rates persist (Netflix’s subscriber growth was only 8% YoY vs. 33% for Amazon Prime). Meanwhile, Disney has quicklyemerged as a very serious competitor, grabbing nearly 15% market share following an explosive launch and subscriber growth ofnearly 250% YoY. In addition, newer SVOD platforms such as Apple TV, Paramount , and HBO Max, while still meaningfully smaller than the big three(Netflix, Amazon Prime, and Disney ), are investing heavily in their services and are gaining momentum with soaring subscribergrowth in 2021 ( 300%, 160%, and 86%, respectively). Over the next few years, we expect the streaming wars (and the battle for subscribers) to intensify among the large players andplatforms, driving demand for premium content and IP portfolios and, in turn, the need for further industry consolidation.Growing Market Size and Market Share(1)Top Subscription Services in the World(2)Growth in subscribers (2018 vs. 2021)(2)Global subscribers in millions – YTD 2021 (annual growth rate)5.3%41.8%5.1%6.8%58.2%8.6%14.7%(1)(2)200( 33.3%)26.5%5.4%2018209( 8.4%)2.2%116( 246.3%)68( 86.0%)202125.4%MoffetNathanson.Netflix Q2 ’21 10-Q, Amazon Q1 ’21 Earnings Call, Disney Q2 ’21 10-Q, HBOMax AT&T Q1 ’21 10-Q, Apple Statista, June 2021.424340 ( 159.3%)( 20.6%)( 300.0%)17( 54.5%)6
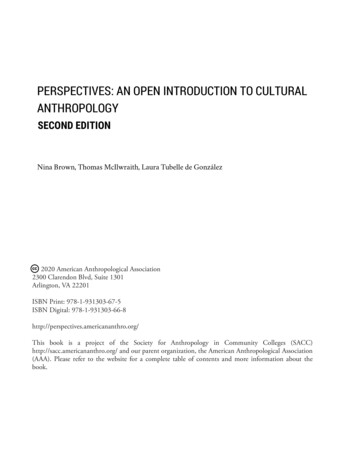
Competition Driving Content Spend to Record LevelsPremium content is the key to subscriber loyalty, pushing the boundaries of content budgets across the SVOD landscape.2022E20202024ESubscriber Churn Driven by Limited Content(1) 14.9B 13.9B 11.6BU.S. monthly churn rate, Q4 202015.6% 8.5B 7.1B 9.6B9.5%8.8%8.4%6.7% 4.0B 4.4B 4.7B5.9%5.2%4.3%2.5% 0.9B 0.7B 2.8B 2.1B 4.5B2022E 31.8BMarket leaders are investing heavily in premiumIP/content in an effort to win over subscribersand minimize churn. Platforms with the large content catalogs (suchas Netflix and Disney ) are experiencing farlower churn than newer platforms, such asAppleTV and Peacock , which launched withsmaller initial collections of premium, originalcontent and IP. 3.2BTotal Content Spend for Selected Companies2020 24.2B 2024E 37BSource: SNL Kagan.(1) MoffettNathanson; excludes involuntary churn; Hulu SVOD only; Apple TV excluding free trials; Peacock excluding free tier.Note: Figures are representative of programming amortization expense for selected companies. Additional entity spend available: Apple invested 6 billion in Apple TV in 2019;meanwhile, ViacomCBS (Paramount’s parent) spent 15 billion on content including sports rights in 2020.7
Continued M&A Activity to Expand IP, Distribution, and ScaleMarket activity among key OTT players is expected to rise in 2021 and beyond, with many media companies looking for contentengines or to establish direct-to-consumer offerings through M&A.Notable M&A TransactionsAcquirer:Target: Announced Date: May 26, 2021 Announced Date: May 17, 2021 Announced Date: June 22, 2021 Transaction Size: 8.5 Billion Transaction Size: 43 Billion Transaction Size: NA Amazon is expected to leverage MGM’sfilmmaking history and catalog of 4,000films and 17,000 TV shows to helpbolster Amazon Studios, its film and TVdivision. The deal reflects a desire to be one ofthe key players in the OTT space, goinghead-to-head against Netflix andDisney. The proposed merger of RTL Nederlandand Talpa Network assets will create astrong Dutch cross-media group acrossTV, streaming, radio, print, and digital. The partners announced that the newcompany will compete globally in thedirect-to-consumer business, bringingcontent directly to subscribers across itsportfolio, including HBO Max and therecently launched Discovery . This indicates clear ambition to expandVideoland, the leading Dutch streamingservice with one million payingsubscribers. The financial value behind this deal isthe treasure trove of IP in the catalogthat Amazon plans to develop withMGM’s team. The deal emphasizes Amazon’swillingness to spend deeply to win oversubscribers, committing billions towardlicensing content and developingoriginal programming. Amazon has long been willing to makeinvestments on video content as astrategy to buoy Prime memberships,which has surpassed 200 millionglobally.(1) FactSet, industry research. It will combine WarnerMedia’s storiedcontent library of popular and valuableIP with Discovery’s global footprint,trove of local-language content, anddeep regional expertise. The new company will be able to investin original content and enhance theprogramming options across its globallinear pay TV and broadcast channels. The combined Dutch entity is estimatedto spend more than 475 million inannual content budgets and generaterevenues north of 1 billion. The goal is to create "local languagechampions" that will produce content fortheir home markets and achieve greaterscale in the streaming wars. Value creation for both shareholdersthrough significant synergies, estimatedbetween 100 million– 120 millionannually.8
OTT Platforms Target International Markets for Growth As the SVOD market in North America matures (and competition continues to heat up), big media and technology giants areincreasingly focused on international markets to find new audiences and growth. Global SVOD subscriptions are estimated to grow rapidly over the next five years, from just over one billion in 2021 to nearly1.5 billion by 2026, while SVOD revenues outside of North America are expected to grow from 33.8 billion to 71.6 billion( 16% CAGR) vs. 6% in North America. Revenue growth will partially hinge on the ability to grow subscribers in territories with considerably lower ARPU, such as inAsia-Pacific and Latin America where ARPU in certain markets can be as low as 50% of that in the U.S. and Canada. Disney is leading the charge as international subscribers represent 67% of its subscriber base as of Q2 ’21, providing a benchmarkfor OTT heavyweights’ international focus. Netflix is expected to have a revenue mix percentage of 66% international vs. 34% North America by 2025, compared to 56% and44%, respectively, in 2020.(3) Fuels Future Growth in SVOD Revenue(2)Rapid Global SVOD Subscriber Growth (1)Global SVOD subscriptions (in millions)YOY Growth:38%24%Global SVOD revenues (in billions)44%17%8%(4)North America1,495Rest of World 126.01,057904508 74.0628 71.6 40.22018201911.2%16.2% 1) Wall Street research; (2) Digital TV Research; (3) MoffettNathanson; Disney subs include Disney and Hotstar; (4) Represents ‘21–’26 CAGR. 54.46.2%2026E9
Subscription Fatigue: How Many Subscriptions Are Too Many?Subscription fatigue is driving consumers to AVOD services in an effort to optimize access to diverse premium content while limitingmonthly recurring costs.Number of Paid Video Streaming Services Per User(1) The average consumer in 2021 has 4.5 paid streamingsubscriptions, nearly double the average in 2018.(1) As of September 2021, U.S. consumers were spending 55 permonth on video subscriptions, up 45% from the pre-COVID-19 38 average(2) and surpassing the previous U.S. consumer’swillingness-to-spend survey response of 45 for paidsubscription OTT services.(3) In response to SVOD services raising their prices to counterincreasing content acquisition and production costs, AVODoptions are becoming more popular, as showcased by the 200%increase in share of time spent from May 2020 to May 2021.SVOD Pricing LandscapeYoY % 020Change in Share of Time Spent (4)Subscription prices for base ad-free subscriptionPrevious PriceAvg. Subscriptions Per UserFrom May 2020 to May 2021Current Price 14.99 14.99-13% 12.99Linear 11.99 11.99 10.99 8.99 8.00 7.99 100% 6.99 4.99 4.99SVOD 4.99 4.99 200%(1) J.D. Power Survey, August 2021; (2) J.D. Power Survey, December 2020; (3) Strategy Analytics, 2019; (4) TVision: The CTV Advertising Report, June 2021.AVOD10
Global AVOD Market on the Rise Driven by Secular Tailwinds As pandemic-era behaviors calcify, the proliferation ofSVOD services is weighing on North American consumers(and their wallets), driving demand for compelling digitalcontent alternatives like AVOD.AVOD Market Size(2)( in billions)20.6% From 2020 to 2021, consumer adoption of AVOD servicesgrew dramatically from 34% of consumers in February2020 to 58% in February 2021.(1)202045.6%37.8%46.7%2020–2024 CAGR202457.7%66.7%28.7%38.1% 13.9 We expect to see an acceleration in AVOD adoption/growth over the next several years, with North AmericanAVOD revenues expected to grow nearly 27% in 2021(vs. 23% for SVOD). Within the U.S., AVOD is expected togrow at a whopping 38% CAGR between 2020 and 2024. 5.1 4.5 2.4 2.2 1.9 0.5 0.5 1.7 0.4 0.2 1.1 0.1 0.7 0.4 1.1OtherAVODGlobal AVOD Spend(3)( in billions)Total U.S.USAVOD2020–2026 CAGR20.8%10.4%13.0%11.0%21.1%13.8% 31.4 14.5 10.6 10.1 5.820202026U.S.2020 4.3 2.12026China(1) Marketing Dive; (2) MoffettNathanson; (3) Digital TV Research.20202026Japan 3.4 1.820202026U.K. 6.6 2.3 0.720202026India20202026Other11
The AVOD Future Is Looking BrightAVOD platforms are gaining steam and are at a critical inflection point as they look to prove their value proposition to both consumersand advertisers.Average Minutes per Day With Digital Video (1)91106145140133AVOD Is Capturing a Larger Share of Consumers’ Attention In 2021, more than 58% of U.S. households used ad-supported streaming services,up 70% from 2020.(1) Today, the average U.S. consumer watches 140 minutes of digital video per day, alarge portion of which is ad-supported video.2018201920202021E2022EConnected TV Households (in millions) (2)Connected TV Advertising Spend (in billions)108105 1499 62019110112 16113Connected TV Is Leading Transition of Advertising Dollars to OTT Platforms 18 Connected TV households surpassed 100 million in the U.S. in 2020, drivingadvertisers to allocate ad spend to OTT platforms vs. linear TV. As compared to advertising on linear TV, advertisers on OTT platforms can leveragemore sophisticated targeting strategies, resulting in a higher ROI for their marketingcampaigns. 11 820202021E2022E2023EDigital Spend Shifting Toward AVODAVOD2024E(3)Other DigitalU.S. Digital Advertising Spend Will Reach 70.0 Billion by 022E2023E2024E2025E(1) eMarketer, March 2021; (2) Wall Street research; (3) Cinedigm. AVOD is estimated to be the fastest growing segment within U.S. digital advertisingspend. Continued cord-cutting has resulted in a rise in AVOD migration, with a rapid rise inconsumption of free ad-supported content.12
Notable Recent TransactionsM&A activity remains strong across the sector as OTT platforms rely on inorganic strategies to expand features and content libraries.Notable M&A Transactions( in millions)CompanyDateAug. ’21June ’21May ’21May ’21May ’21Apr. ’21Apr. ’21Feb. ’21Jan. ’21Dec. ’20Aug. ’20Valuation---- 8,450.0 43,000 693.0-- 164.8---- 1,175.0 330.0EV e Financing Zxy Sport TrackingApr. ’21Apr. ’21Keyeast, F&F Partners,Com2us, KTB Network,KDDI Open InnovationFund, Mirae AssetVenture Investment,SL Investment,Hancom Investment,Yuanta Securities Korea,Capital OneCoatue, Accel, AndreessenHorowitz, Cobalt,Dragoneer 13.4--Apr. ’21Jan. ’21Aug. ’20Valor Equity Partners 105.0 1,000Sources: PitchBook.com, S&P Capital IQ, company press releases, and news reports.Apr. ’20June 19Undisclosed InvestorsHush Holding Co., HighlineCapital, Zweig-DimennaAssociates, Cipayo LTD,Individual InvestorsSony Corp. AmericaBertelsmann Digital MediaInvestments, CausewayMedia Partners, DCMVentures, Discovery,Fertitta Capital, WWE 25.0 22.5 43.1 400.0 47.0 275.0 306.0 1,017.3 7,632.1--13
Public Market ValuationsAfter materially outperforming the broader market for many months (benefiting from a material COVID-19 bump), pure-play public OTTplatforms’ market valuations have come down to earth due to concerns about the sustainability of growth in a increasingly competitiveand post COVID-19 world.Public OTT Platforms vs. S&P 500S&P -21Feb-21Mar-21Apr-21Source: S&P Capital IQ.Note: Stock price last updated on October 11, 2021.OTT Platforms represents the average change in price of Netflix, Roku, fuboTV, Gaia, and Chicken Soup for the Soul.May-21Jun-21Jul-21Aug-21Sep-21Oct-2114
Expertise at the Nexus of Digital Media, OTT, and EntertainmentHoulihan Lokey professionals have unparalleled experience in advising media companies across a wide range of transactions.a subsidiary ofhas been acquired byhas been acquired byhas acquiredhas been acquired byhas acquiredsupported by the successfulplacement of a senior securedcredit facilitySellside AdvisorFinancial AdvisorSellside AdvisorBuyside Advisor & Placement AgentSellside AdvisorMediabox, LLChas acquiredhas successfully completed thespin-off ofhas been acquired byhas been acquired byandValuation of a film library forcollateral lending purposes inconnection with Sound PointCapital Management’s acquisitionof Relativity Media.has sold substantially all its assetsthrough a §363 asset saleHoulihan Lokey provided financialopinions to the Board of Directors ofboth Twenty-First Century Fox andFox Corporation.Buyside AdvisorSellside AdvisorFinancial OpinionCollateral ValuationSellside AdvisorSecured Lender Advisora portfolio company ofhas been acquired by 28 million financing led byWe rendered a valuation opinion forfinancial reporting purposes toMGM regarding its intangible assetsincluding the MGM film andtelevision libraryhas been acquired byhas soldcompletedsubstantiallya financingall its assets,consistingtoofSection 363 of the U.S.pursuantBankruptcy Code, to 24,000,000Series DConvertible Preferred Stockhas been acquired byPenske Media CorporationFinancial AdvisorFinancial OpinionTombstones included herein represent transactions closed from 2016 forward.Sellside AdvisorSellside AdvisorCompanyPlacementAdvisorAgentSellside Advisor15
How Houlihan Lokey Can HelpOur firm is extremely well equipped to help our clients navigate critical milestones of the corporate lifecycle. We respond quickly tochallenging situations and are constantly helping clients to analyze, structure, negotiate, and execute the best possible solutions fromboth a strategic and a financial perspective.What We OfferCorporate Finance1Mergers and Acquisitions2Capital MarketsPrivate Funds AdvisoryBoard Advisory ServicesFinancial RestructuringCompany AdvisoryFinancial RestructuringDistressed M&ALiability ManagementCreditor AdvisoryFinancial and Valuation AdvisoryPortfolio Valuation and Fund AdvisoryTransaction OpinionsCorporate Valuation Advisory ServicesTransaction Advisory ServicesReal Estate Valuation and AdvisoryWhy We’re DifferentMergers and AcquisitionsWe are widely recognized as aleading M&A advisor to themiddle market in general and theTMT sector in particular. Ourdeep expertise across the sector,knowledge of the strategiclandscape, and long-standingrelationships with all relevantstrategic and financial buyersmake us the M&A advisor ofchoice for strategic transactions inthe digital media industry.Equity FinancingWe have a market-leading privatecapital markets platform focusedon the placement of solutionoriented capital for a wide rangeof financing needs. We havedifferentiated investorrelationships and access to thekey decision-makers, allowing usto run a bespoke, high-touch,confidential, and efficient process. Deep Digital Media Industry Expertise Strong Relationships With the Most RelevantBuyers Solution-Oriented Capital Markets Platform Dominant in Special Situations and Restructuring Senior-Level Commitment and Dedication Superior Work Product/Technical Abilities Creativity, Imagination, Tenacity, and PositivityDispute Resolution Consulting16
Houlihan Lokey is the trusted advisor to more top decision-makersthan any other independent global investment bank 1,500 Employees 1 Billion of Revenue 23 Locations Globally 6 Billion Market Cap2020 TMT Investment Bank of the YearCorporate Finance2020 Global Distressed Debt & BankruptcyRestructuring Rankings2020 M&A Advisory RankingsAll U.S. TransactionsAdvisorFinancial and Valuation AdvisoryFinancial RestructuringDealsAdvisor2001 to 2020 U.S. M&A Fairness AdvisoryRankingsDealsAdvisorDealsHoulihan Lokey869AdvisorDealsHoulihan Lokey1332Goldman Sachs & Co1233Raymond James Financial Inc1104953Morgan Stanley1104465JP Morgan108Houlihan Lokey2101Houlihan Lokey1062Goldman Sachs & Co1722PJT Partners Inc632Duff & Phelps6963JP Morgan1323Lazard503JP Morgan6254Evercore Partners1264Rothschild & Co464Piper Sandler & Co5Morgan Stanley1235Moelis & Co395StoutNo. 1 U.S. M&A AdvisorTop 5 Global M&A AdvisorLeading Capital MarketsAdvisorSource: Refinitiv (formerly known as Thomson Reuters)No. 1 Global RestructuringAdvisor1,400 Transactions CompletedValued at More Than 3.0Trillion CollectivelyRefinitiv (formerly known as Thomson Reuters). Announcedor completed transactions.No. 1 Global M&A FairnessOpinion Advisor Over the Past20 Years1,000 Annual ValuationEngagements2018 to 2020 M&A Advisory RankingsU.S. Technology, Media, Entertainment &Telecom Transactions Under 5 Billion*111Source: Refinitiv (formerly known as Thomson Reuters)TMT(1)Source: Refinitiv (formerly known as Thomson Reuters)*Includes acquired firm transactions.No. 1 U.S. TMT Practice43 Completed Transactions in202017
Disclaimer 2021 Houlihan Lokey. All rights reserved. This material may not be reproduced in any format by any means or redistributed without theprior written consent of Houlihan Lokey.Houlihan Lokey gathers its data from sources it considers reliable; however, it does not guarantee the accuracy or completeness of theinformation provided within this presentation. The material presented reflects information known to the authors at the time this presentationwas written, and this information is subject to change. Houlihan Lokey makes no representations or warranties, expressed or implied,regarding the accuracy of this material. The views expressed in this material accurately reflect the personal views of the authors regardingthe subject securities and issuers and do not necessarily coincide with those of Houlihan Lokey. Officers, directors, and partners in theHoulihan Lokey group of companies may have positions in the securities of the companies discussed. This presentation does not constituteadvice or a recommendation, offer, or solicitation with respect to the securities of any company discussed herein, is not intended to provideinformation upon which to base an investment decision, and should not be construed as such. Houlihan Lokey or its affiliates may from timeto time provide investment banking or related services to these companies. Like all Houlihan Lokey employees, the authors of thispresentation receive compensation that is affected by overall firm profitability.Houlihan Lokey is a trade name for Houlihan Lokey, Inc., and its subsidiaries and affiliates, which include those in (i) the United States:Houlihan Lokey Capital, Inc., an SEC-registered broker-dealer and member of FINRA (www.finra.org) and SIPC (www.sipc.org) (investmentbanking services); Houlihan Lokey Financial Advisors, Inc. (financial advisory services); HL Finance, LLC (syndicated leveraged financeplatform); and Houlihan Lokey Real Estate Group, Inc. (real estate advisory services); (ii) Europe: Houlihan Lokey EMEA, LLP, andHoulihan Lokey (Corporate Finance) Limited, authorized and regulated by the U.K. Financial Conduct Authority; Houlihan Lokey (Europe)GmbH, authorized and regulated by the German Federal Financial Supervisory Authority (Bundesanstalt für Finanzdienstleistungsaufsicht);Houlihan Lokey GmbH; Houlihan Lokey S.p.A.; Houlihan Lokey (Netherlands) B.V.; Houlihan Lokey (España), S.A.; and Houlihan Lokey(Corporate Finance), S.A.; (iii) the United Arab Emirates, Dubai International Financial Centre (Dubai): Houlihan Lokey (MEA FinancialAdvisory) Limited, regulated by the Dubai Financial Services Authority for the provision of advising on financial products, arranging deals ininvestments, and arranging credit and advising on credit to professional clients only; (iv) Singapore: Houlihan Lokey (Singapore) PrivateLimited, an “exempt corporate finance adviser” able to provide exempt corporate finance advisory services to accredited investors only; (v)Hong Kong SAR: Houlihan Lokey (China) Limited, licensed in Hong Kong by the Securities and Futures Commission to conduct Type 1, 4,and 6 regulated activities to professional investors only; (vi) China: Houlihan Lokey Howard & Zukin Investment Consulting (Beijing) Co.,Limited (financial advisory services); (vii) Japan: Houlihan Lokey K.K. (financial advisory services); and (viii) Australia: Houlihan Lokey(Australia) Pty Limited (ABN 74 601 825 227), a company incorporated in Australia and licensed by the Australian Securities andInvestments Commission (AFSL number 474953) in respect of financial services provided to wholesale clients only. In the EuropeanEconomic Area (EEA), Dubai, Singapore, Hong Kong, and Australia, this communication is directed to intended recipients, including actualor potential professional clients (EEA and Dubai), accredited investors (Singapore), professional investors (Hong Kong), and wholesaleclients (Australia), respectively. Other persons, such as retail clients, are NOT the intended recipients of our communications or servicesand should not act upon this communication.18
CORPORATE FINANCEFINANCIAL RESTRUCTURINGFINANCIAL AND VALUATION ADVISORY
B2B Events Broadcasting Casino Gaming Digital Content Digital Marketing . rate of content consumption spurred new trends within the OTT industry, as consumers accrued more platform subscriptions in pursuit of content variety. . Q1 2015 Q2 2015 Q3 2015 Q4 2015 Q1 2016 Q2 2016 Q3 2016 Q4 2016 Q1 2017 Q2 2017 Q3 2017 Q4 2017 Q1 2018 Q2 2018 Q3 .