Transcription
Predicting Fatigue Life with ANSYSWorkbenchHow To Design Products That Meet Their Intended DesignLife RequirementsRaymond L. Browell, P. E.Product Manager New TechnologiesANSYS, Inc.Al HancqDevelopment EngineerANSYS, Inc. 2006 ANSYS, Inc.ANSYS, Inc. Proprietary
Fatigue Agenda General Fatigue ReviewFatigue Analysis in WorkbenchWorking with Legacy ModelsOptimization with FatigueFatigue Within Workbench Fits IntoEveryone’s Process! Questions and Answers 2006 ANSYS, Inc.ANSYS, Inc. Proprietary
General Fatigue Review Why Fatigue Analysis?– While many parts may work well initially,they often fail in service due to fatiguefailure caused by repeated cyclic loading– In practice, loads significantly below staticlimits can cause failure if the load isrepeated sufficient times– Characterizing the capability of a materialto survive the many cycles a componentmay experience during its lifetime is theaim of fatigue analysis 2006 ANSYS, Inc.ANSYS, Inc. Proprietary
General Fatigue Review Common Decisionsfor Fatigue Analysis– Fatigue AnalysisType– Loading Type– Mean Stress Effects– Multiaxial StressCorrection– Fatigue ModificationFactorFatigue Analysis TypeLoading TypeMean Stress EffectsMultiaxial StressCorrectionFatigue Modifications 2006 ANSYS, Inc.ANSYS, Inc. Proprietary
General Fatigue Review Fatigue Analysis Types– Strain Life(Available in ANSYS Fatigue Module)– Stress Life(Available in ANSYS Fatigue Module)– Fracture Mechanics 2006 ANSYS, Inc.ANSYS, Inc. Proprietary
General Fatigue Review Strain Life– Strain can be directly measured and has been shown tobe an excellent quantity for characterizing low-cyclefatigue– Strain Life is typically concerned with crack initiation– In terms of cycles, Strain Life typically deals with arelatively low number of cycles and therefore addressesLow Cycle Fatigue (LCF), but works with high numbersof cycles as well– Low Cycle Fatigue usually refers tofewer than 105 (100,000) cycles– The Strain Life approach is widely usedat present 2006 ANSYS, Inc.ANSYS, Inc. Proprietary
General Fatigue Review Strain LifeThe Strain Life Relation equationis shown below:Δε σ (2N ) ε (2N )2EThe two cyclic stress-strain parametersare part of the equation below:'bffΔε2ΔσEN'Δεcff Total Strain Amplitudeσ 2 x the Stress AmplitudeB Modulus of ElasticityεfΔσE 21/ n ' Fatigue Strength Coefficient Fatigue Strength Exponent(Basquin’s Exponent)'f Fatigue Ductility Coefficient Number of Cycles to FailurefC2N' Δσ ' Kf Number of Reversals to FailureKn 2006 ANSYS, Inc. Fatigue Ductility Exponent' Cyclic Strength Coefficient' Cyclic Strain Hardening ExponentANSYS, Inc. Proprietary
General Fatigue Review Strain Life– For Strain Life, the total strain (elastic plastic) is the required input– But, running an FE analysis to determinethe total response can be very expensiveand wasteful, especially if the nominalresponse of the structure is elastic– So, an accepted approach is to assume anominally elastic response and then makeuse of Neuber’s equation to relate localstress/strain to nominal stress/strain at astress concentration location 2006 ANSYS, Inc.ANSYS, Inc. Proprietary
General Fatigue Review Strain LifeTo relate strain to stress we use Neuber’s Rule, which is shown below:εσ2K eStε Local (Total) Strainσ Local StressK 2006 ANSYS, Inc. t Elastic Stress Concentration Factore Nominal Elastic StrainS Nominal Elastic StressANSYS, Inc. Proprietary
General Fatigue Review Strain Life– Simultaneously solving Neuber’s equation alongwith cyclic strain equation, we can calculate thelocal stress/strains (including plastic response)given only elastic input– Note that this calculation is nonlinear and is solvedvia iterative methods– ANSYS fatigue uses a value of 1 for Kt, assumingthat the mesh is refined enough to capture anystress concentration effects 2006 ANSYS, Inc. Note: This Kt is not be confused with the StressReduction Factor option which is typically used in Stresslife analysis to account for things such as reliability andsize effectsANSYS, Inc. Proprietary
General Fatigue Review Stress Life 2006 ANSYS, Inc.– Stress Life is based on S-N curves (Stress – Cyclecurves)– Stress Life is concerned with total life and does notdistinguish between initiation and propagation– In terms of cycles, Stress Life typically deals with arelatively High number of cycles– High number of cycles is usually refers to more than105 (100,000) cycles– Stress Life traditionally deals withrelatively high numbers of cycles andtherefore addresses High Cycle Fatigue(HCF), greater than 105 cycles inclusiveof infinite lifeANSYS, Inc. Proprietary
General Fatigue Review Fracture Mechanics– Fracture Mechanics starts with an assumed flaw of knownsize and determines the crack’s growth– Facture Mechanics is therefore sometimes referred to as“Crack Life”– Facture Mechanics is widely used to determine inspectionintervals. For a given inspection technique, the smallestdetectable flaw size is known. From this detectable flaw sizewe can calculate the time required for the crack to grow to acritical size. We can then determine our inspection intervalto be less than the crack growth time.– Sometimes, Strain Life methods are used to determine crackinitiation with Fracture Mechanics used to determine thecrack life therefore:Crack Initiation Crack Life Total Life 2006 ANSYS, Inc.ANSYS, Inc. Proprietary
Fatigue Analysis in Workbench ANSYS Fatigue Module– Integrated into the ANSYS Workbench Environment– ANSYS Fatigue Module is able to further leverageadvances that the ANSYS Workbench offers such as: 2006 ANSYS, Inc.CAD support including Bi-Directional ParametersSolid ModelingVirtual TopologyRobust MeshingHex-Dominant MeshingAutomatic Contact DetectionOptimizationDesign for Six SigmaRobust Design that the ANSYS Workbench offersANSYS, Inc. Proprietary
Fatigue Analysis in Workbench Strain Life Decisionsfor Fatigue Analysis– Loading Type– Mean Stress Effects– Multiaxial StressCorrection– Fatigue ModificationFactor 2006 ANSYS, Inc.ANSYS, Inc. Proprietary
Fatigue Analysis in Workbench Stress LifeDecisions forFatigue Analysis– Loading Type– Mean Stress Effects– Multiaxial StressCorrection– Fatigue ModificationFactor 2006 ANSYS, Inc.ANSYS, Inc. Proprietary
Fatigue Analysis in Workbench Loading Types– Constant amplitude, proportional loading– Constant amplitude, non-proportionalloading– Non-constant amplitude, proportionalloading– Non-constant amplitude, non-proportionalloading 2006 ANSYS, Inc.ANSYS, Inc. Proprietary
Fatigue Analysis in Workbench Constant amplitude, proportional loading– Loading is of constant amplitude because onlyone set of FE stress results along with aloading ratio is required to calculate thealternating and mean values 2006 ANSYS, Inc.ANSYS, Inc. Proprietary
Fatigue Analysis in Workbench Constant amplitude, proportional loading– Is the classic, “back of the envelope”calculation describing whether the load has aconstant maximum value or continually varieswith time– The loading ratio is defined as the ratio of thesecond load to the first load (LR L2/L1)– Common types of constant amplitude loadingare: 2006 ANSYS, Inc. Fully reversed (apply a load, then apply an equaland opposite load; a load ratio of –1) Zero-based (apply a load then remove it; a load ratioof 0)ANSYS, Inc. Proprietary
Fatigue Analysis in Workbench Constant amplitude, proportional loading– Loading is proportional since only one set of FEresults are needed (principal stress axes do notchange over time)– Since loading is proportional, looking at a singleset of FE results can identify critical fatiguelocations.– Since there are only two loadings, no cyclecounting or cumulative damage calculationsneed to be done 2006 ANSYS, Inc.ANSYS, Inc. Proprietary
Fatigue Analysis in Workbench Constant amplitude, non-proportional loading– Looks at exactly two load cases that need not berelated by a scale factor– Analyses where loading is proportional but resultsare not– The loading is of constant amplitude but nonproportional since principal stress or strain axesare free to change between the two load sets– This happens under conditions where changingthe direction or magnitude of loads causes achange in the relative stress distribution in themodel. This may be important in situations withnonlinear contact, compression-only surfaces, orbolt loads 2006 ANSYS, Inc.ANSYS, Inc. Proprietary
Fatigue Analysis in Workbench Constant amplitude, non-proportional loading– This type of fatigue loading can describe commonfatigue loadings such as: Alternating between two distinct load cases (like abending load and torsional load) Applying an alternating load superimposed on a staticload– No cycle counting needs to be done– But since the loading is non-proportional, thecritical fatigue location may occur at a spatiallocation that is not easily identifiable by looking ateither of the base loading stress states 2006 ANSYS, Inc.ANSYS, Inc. Proprietary
Fatigue Analysis in Workbench Constant amplitude, non-proportional loading– Fatigue tools located under asolution branch are inherentlyapplied to that single branchand thus can only handleproportional loading 2006 ANSYS, Inc. In order to handle nonproportional loading, the fatiguetool must be able to spanmultiple solutions This is accomplished by adding afatigue tool under the solutioncombination folder that canindeed span multiple solutionbranchesANSYS, Inc. Proprietary
Fatigue Analysis in Workbench Non-constant amplitude, proportional loading– Instead of using a single load ratio to calculate alternating andmean values, the load ratio varies over time– Think of this as coupling an FE analysis with strain-gauge resultscollected over a given time interval– Since loading is proportional, the critical fatigue location can befound by looking at a single set of FE results 2006 ANSYS, Inc.ANSYS, Inc. Proprietary
Fatigue Analysis in Workbench Non-constant amplitude,proportional loading 2006 ANSYS, Inc.– However, the fatigue loadingwhich causes the maximumdamage cannot easily be seen– Thus, cumulative damagecalculations (including cyclecounting such as Rainflow anddamage summation such asMiner’s rule) need to be doneto determine the total amountof fatigue damage and whichcycle combinations cause thatdamage– Cycle counting is a means toreduce a complex load historyinto a number of events, whichcan be compared to theavailable constant amplitudetest dataANSYS, Inc. Proprietary
Fatigue Analysis in Workbench Non-constant amplitude, proportional loading– The ANSYS Fatigue Module uses a “quickcounting” technique to substantially reduceruntime and memory– In quick counting, alternating and mean stressesare sorted into bins before partial damage iscalculated– Without quick counting, data is notsorted into bins until after partialdamages are found– The accuracy of quick counting isusually very good if a proper numberof bins are used when counting 2006 ANSYS, Inc.ANSYS, Inc. Proprietary
Fatigue Analysis in Workbench Non-constant amplitude, proportional loading– Bin size defines how many divisions the cyclecounting history should be organized into Strictly speaking, bin sizespecifies the number ofdivisions of the rainflow matrix A larger bin size has greaterprecision but will take longer tosolve and use more memory Bin size defaults to 32, meaningthat the Rainflow Matrix is 32 x32 in dimension. 2006 ANSYS, Inc.ANSYS, Inc. Proprietary
Fatigue Analysis in Workbench Non-constant amplitude, proportional loading– For Stress Life, another available option whenconducting a variable amplitude fatigue analysis isthe ability to set the value used for infinite life– In constant amplitude loading, if the alternatingstress is lower than the lowest alternating stress onthe fatigue curve, the fatigue tool will use the life atthe last point– This provides for an added level of safety becausemany materials do not exhibit an endurance limit 2006 ANSYS, Inc.ANSYS, Inc. Proprietary
Fatigue Analysis in Workbench Non-constant amplitude, non-proportionalloading– Most general case and is similar to Constant Amplitude,non-proportional loading, but in this loading class thereare more than 2 different stress cases involved thathave no relation to one another– Not only is the spatial location of critical fatigue lifeunknown, but also unknown is what combination ofloads cause the most damage– Thus, more advanced cycle counting is required suchas path independent peak methods or multiaxial criticalplane methods– Currently the ANSYS Fatigue Module does not supportthis type of fatigue loading 2006 ANSYS, Inc.ANSYS, Inc. Proprietary
Fatigue Analysis in Workbench Mean Stress Correction– Cyclic fatigue properties of a material are oftenobtained from completely reversed, constantamplitude tests– Actual components seldom experience thispure type of loading, since some mean stress isusually present– If the loading is other than fully reversed, amean stress exists and may be accounted forby using a Mean Stress Correction 2006 ANSYS, Inc.ANSYS, Inc. Proprietary
Fatigue Analysis in Workbench Mean Stress Correction (Stress Life)– Soderburg– Goodman– Gerber– Mean Stress Curves Mean Stress Dependent Multiple r-ratio curves– No Mean Stress Correction (None) 2006 ANSYS, Inc.ANSYS, Inc. Proprietary
Fatigue Analysis in Workbench Mean Stress Correction (Stress Life)– Soderberg Is usually overlyconservative Soderberg theory is notbounded when usingnegative mean stressesσSAlternatingEndurance Limit 2006 ANSYS, Inc. σSMeanYield Strength 1– ANSYS Fatigue Moduledoes bound the negativemeans stresses– Negative mean stress iscapped to the yield stressANSYS, Inc. Proprietary
Fatigue Analysis in Workbench Mean Stress Correction (Stress Life)– GoodmanσSAlternatingEndurance Limit 2006 ANSYS, Inc. σSMeanUltimate Strength 1 Most experimental datafalls between Goodmanand Gerber theories Goodman theory isusually a good choicefor brittle materials Goodman theory is notbounded when usingnegative mean stresses– ANSYS Fatigue Moduledoes bound the negativemeans stresses to theultimate stressANSYS, Inc. Proprietary
Fatigue Analysis in Workbench Mean Stress Correction (Stress Life)– GerberσSAlternatin gEndurance Limit 2006 ANSYS, Inc. σMean 1 S Ultimate Strength 2 Most experimental datafalls between Goodmanand Gerber theories Gerber theory usually agood choice for ductilematerials Gerber theory isbounded when usingnegative mean stressesANSYS, Inc. Proprietary
Fatigue Analysis in Workbench Mean Stress Correction (Stress Life)– Mean Stress Curves Uses experimentalfatigue data to accountfor mean stress effects Two Types Available– Mean Stress Dependent– Multiple r-ratio curves In general, it is notadvisable to use anempirical mean stresstheory if multiple meanstress data exists 2006 ANSYS, Inc.ANSYS, Inc. Proprietary
Fatigue Analysis in Workbench Mean Stress Correction (Strain Life)– Morrow’s method Modified Elastic term inthe strain-life equation Consistent withobservations that meanstress:Δε2 2006 ANSYS, Inc. σσ 'fEMean(2N ) ε (2N )bf'cff– is significant at lowvalues of plastic strain– has little effect at highvalues of plastic strain– Incorrectly predicts thatthe ratio of elastic toplastic strain isdependent on meanstressANSYS, Inc. Proprietary
Fatigue Analysis in Workbench Mean Stress Correction (Strain Life)– Smith, Watson andTopper (SWT) Use a different equationto account for thepresence of meanstressesσ'Maximum 2006 ANSYS, Inc.Δε2()σ(2 N ) σ 'f ε (2 N ) E2'2bff'b cff– It has the limitation that itis undefined for negativemaximum stresses– The physicalinterpretation of this isthat no fatigue damageoccurs unless tension ispresent at some pointduring the loadingANSYS, Inc. Proprietary
Fatigue Analysis in Workbench Multiaxial Stress Correction– Experimental test data is mostly uniaxial whereas FEresults are usually multiaxial– At some point, stress must be converted from amultiaxial stress state to a uniaxial one– In the ANSYS Fatigue Module: Von-Mises, max shear, maximum principal stress, or any of thecomponent stresses can be used to compare against theexperimental uniaxial stress value A “signed” Von-Mises stress may be chosen where the VonMises stress takes the sign of the largest absolute principalstress– This is useful to identify any compressive mean stresses sinceseveral of the mean stress theories treat positive and negativemean stresses differently. 2006 ANSYS, Inc.ANSYS, Inc. Proprietary
Fatigue Analysis in Workbench Fatigue Modifications– Value of Infinite Life– Fatigue Strength Factor– Loading Scale Factor– Interpolation Type (Stress Life) Log-log Semi-log Linear 2006 ANSYS, Inc.ANSYS, Inc. Proprietary
Fatigue Analysis in Workbench Value of Infinite Life (Stress Life)– In constant amplitude loading, if the alternating stress islower than the lowest alternating stress on the fatigue curve,the fatigue tool will use the life at the last point This provides for an added level of safety because manymaterials do not exhibit an endurance limit– However, in non-constant amplitude loading, cycles with verysmall alternating stresses may be present and may incorrectlypredict too much damage if the number of the small stresscycles is high enough– To help control this, the user can set the infinite life value thatwill be used if the alternating stress is beyond the limit of theSN curve– Setting a higher value will make small stress cycles lessdamaging if they occur many times– The rainflow and damage matrix results can be helpful indetermining the effects of small stress cycles in your loadinghistory 2006 ANSYS, Inc.ANSYS, Inc. Proprietary
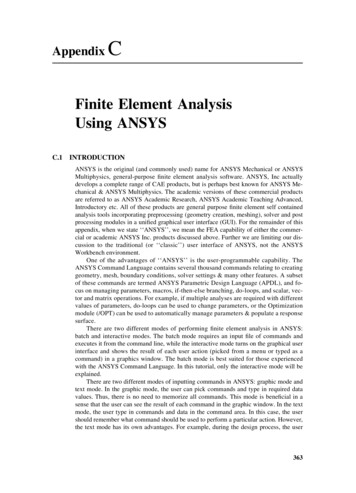
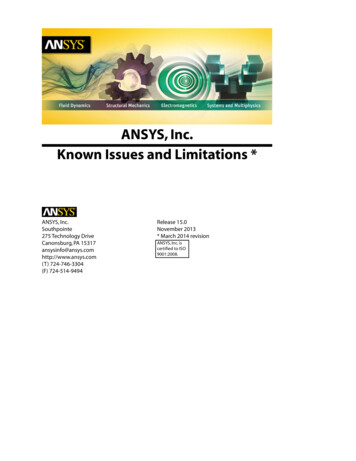
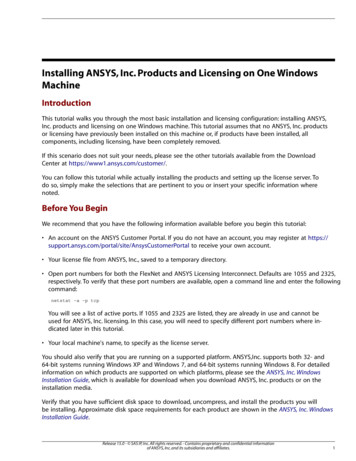
Fatigue Analysis in Workbench Value of Infinite Life (Stress Life)Rainflow matrix for agiven load history. 2006 ANSYS, Inc.Resulting DamageResulting Damage Matrix Matrix with when thewhen the Value of Infinite Value of Infinite LifeLife is equal to 106 cycles. is equal to 109 cycles.Total damage isTotal damage iscalculated to be 0.19.calculated to be 0.12(37% less damage).ANSYS, Inc. Proprietary
Fatigue Analysis in Workbench Fatigue Strength Factor– Modification factors to account for the differencesbetween the in service part from the as testedconditions– In design handbooks, the fatigue alternating stressis usually divided by this modification factor– In the ANSYS Fatigue Module, the Fatigue StrengthFactor (Kf) reduces the fatigue strength and mustbe less than one Note that this factor is applied to the alternating stressonly Does not affect the mean stress. Same as values from Handbooks (Example: Shigley) butall factors combined into one value 2006 ANSYS, Inc.ANSYS, Inc. Proprietary
1 FEM load 1000lbs 1 FEM load needed load scale factor 1000lbs 200 strain gauge 200 strain gauge Fatigue Analysis in Workbench Loading Scale Factor– Loading Scale Factor that will scale all stresses,both alternating and mean by the specified value– This value may be parameterized– Applying a scale factor is useful to avoid having tosolve the static model again to see the effects ofchanging the magnitude of the FEM loads– In addition, this factor may be useful to convert anon-constant amplitude load history data into theappropriate valuesExample: 1 FEM load 1000lbs 1 FEM load Needed Load Scale Factor 1000lbs 200 strain gauge 200 strain gauge 2006 ANSYS, Inc.ANSYS, Inc. Proprietary
Fatigue Analysis in Workbench Interpolation Type (Stress Life)– When the stress life analysis needs to query the SN curve, almost assuredly the data will not beavailable at the same stress point as the analysishas produced; hence the stress life analysis needsto interpolate the S-N curve to find an appropriatevalue– Three interpolations are available Log-log Semi-log Linear– Results will vary due to the interpolation methodused 2006 ANSYS, Inc.ANSYS, Inc. Proprietary
Fatigue Analysis in Workbench Fatigue Results– Calculations and results can be dependent upon thetype of fatigue analysis– Results that are common to both types of fatigueanalyses are listed below: Fatigue LifeFatigue Damage at a specified design lifeFatigue Factor of Safety at a specified design lifeStress BiaxialityFatigue Sensitivity ChartRainflow Matrix output (Beta for Strain Life at 10.0)Damage Matrix output (Beta for Strain Life at 10.0)– Results that are only available for Stress Life are: Equivalent Alternating Stress– Results that are only available for Strain Life are: Hysteresis 2006 ANSYS, Inc.ANSYS, Inc. Proprietary
Fatigue Analysis in Workbench Fatigue life– Shows the available life for the given fatigue analysis Result contour plot, which can be over the whole model orscoped This, and any contour result, may be exported to a tab-delimitedtext file by a right mouse button click on the result– If loading is of constant amplitude, this represents the numberof cycles until the part will fail due to fatigue– If loading is non-constant (i.e. a load history), this representsthe number of loading blocks until failure If a given load history represents one hour of loading and the lifewas found to be 24,000, then the expected model life would be1,000 days– In a Stress Life analysis with constant amplitude, if theequivalent alternating stress is lower than the lowestalternating stress defined in the S-N curve, the life at thatpoint will be used. 2006 ANSYS, Inc.ANSYS, Inc. Proprietary
Fatigue Analysis in Workbench FatigueLife 2006 ANSYS, Inc.ANSYS, Inc. Proprietary
Fatigue Analysis in Workbench Fatigue Damage at a Design Life– Fatigue damage is defined as the design lifedivided by the available life– This result may be scoped– The default design life may be set throughthe Control Panel– For Fatigue Damage, values greater than 1indicate failure before the design life isreached 2006 ANSYS, Inc.ANSYS, Inc. Proprietary
Fatigue Analysis in Workbench FatigueDamage 2006 ANSYS, Inc.ANSYS, Inc. Proprietary
Fatigue Analysis in Workbench Fatigue Factor of Safety at a Design Life– Contour plot of the factor of safety withrespect to a fatigue failure at a given designlife– Maximum Factor of Safety displayed is 15– Like damage and life, this result may bescoped– For Fatigue Safety Factor, values less thanone indicate failure before the design lifehas been reached 2006 ANSYS, Inc.ANSYS, Inc. Proprietary
Fatigue Analysis in Workbench FatigueFactorofSafetyat aDesignLife 2006 ANSYS, Inc.ANSYS, Inc. Proprietary
Fatigue Analysis in Workbench Stress Biaxiality Indication– Fatigue material properties are typically based onuniaxial stresses– Real world stress states are usually multiaxial– This fatigue result gives the user some indication ofthe stress state over the model and how to interpretthe results– Biaxiality indication is defined as the smaller inmagnitude principal stress divided by the largerprincipal stress with the principal stress nearestzero ignored– Stress Biaxiality Indication Values: Biaxiality of zero corresponds to uniaxial stress Biaxiality of –1 corresponds to pure shear Biaxiality of 1 corresponds to a pure biaxial state 2006 ANSYS, Inc.ANSYS, Inc. Proprietary
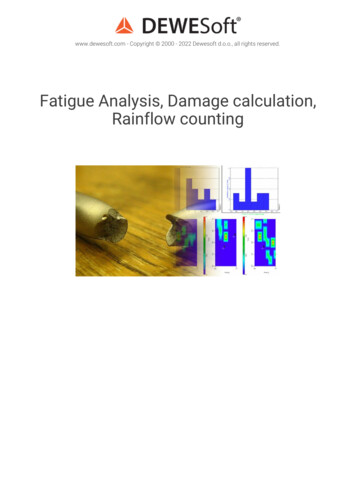
Fatigue Analysis in Workbench Stress Biaxiality Indication– Majority of this model is under a pure uniaxial stress, withparts exhibiting both pure shear and nearly pure biaxiality– Comparing biaxiality with safety factor, the most damagedpoint occurs at a point of nearly uniaxial stress 2006 ANSYS, Inc.ANSYS, Inc. Proprietary
Fatigue Analysis in Workbench Stress Biaxiality Indication– In the preceding example, if the mostdamaged spot was under pure shear, then itwould be desirable to use S-N datacollected through torsional loading, if suchdata was available– Unfortunately, collecting experimental dataunder different loading conditions is costprohibitive and not often done 2006 ANSYS, Inc.ANSYS, Inc. Proprietary
Fatigue Analysis in Workbench Stress Biaxiality Indication– For non-proportional fatigue loading, thereare multiple stress states and thus there isno single stress biaxiality at each node The user may select either to view the average orstandard deviation of stress biaxiality The average value may be interpreted as aboveand in combination with the standard deviation,the user can get a measure of how the stressstate changes at a given location Thus a small standard deviation indicates acondition where the loading is near proportionalwhile a larger deviation indicates change in thedirection of the principal stress vectors This information can be used to give the useradditional confidence in his results or whethermore in depth fatigue analysis is needed toaccount for non-proportionality 2006 ANSYS, Inc.ANSYS, Inc. Proprietary
Fatigue Analysis in Workbench Fatigue Sensitivity Chart– Shows how the fatigue results change withloading at the critical location on the model– User specifies: Sensitivity for life, damage, or factorof safety Number of fill points Load variation limits– Negative variations are allowed to seethe effects of a possible negative meanstress if the loading is not totallyreversed– Linear, Log-X, Log-Y, or Log-Log scaling 2006 ANSYS, Inc.ANSYS, Inc. Proprietary
Fatigue Analysis in Workbench FatigueSensitivityChart 2006 ANSYS, Inc.ANSYS, Inc. Proprietary
Fatigue Analysis in Workbench Rainflow Matrix Output (Beta, Strain Life, 10.0)– Shows the rainflow matrix at the critical location– Only applicable for non-constant amplitude loadingwhere rainflow counting is needed– This result may be scoped– 3-D histogram where alternating and mean stress isdivided into bins and plotted Z-axis corresponds to the number of counts for a givenalternating and mean stress bin This result gives the user a measure of the composition ofa loading history Such as if most of the alternating stress cycles occur at anegative mean stress 2006 ANSYS, Inc.ANSYS, Inc. Proprietary
Fatigue Analysis in Workbench RainflowMatrixOutput(Beta,StrainLife,10.0) 2006 ANSYS, Inc.ANSYS, Inc. Proprietary
Fatigue Analysis in Workbench Damage Matrix Output (Beta for Strain Life at 10.0)– Shows the damage matrix at the critical location on the model– This result is only applicable for non-constant amplitudeloading where rainflow counting is needed– This result may be scoped– 3-D histogram where alternating and mean stress is dividedinto bins and plotted Z-axis corresponds to the percent damage that each of theRainflow bin’s cause Similar to the rainflow matrix except that the percent damage thateach of the Rainflow bin’s cause is plotted on the Z-axis Thisresult gives the user a measure of the composition of what iscausing the most damage Such as if most of the counts occur at the lower stressamplitudes, but most of the damage occurs at the higher stressamplitudes 2006 ANSYS, Inc.ANSYS, Inc. Proprietary
Fatigue Analysis in Workbench DamageMatrixOutput(BetaforStrainLife at10.0) 2006 ANSYS, Inc.ANSYS, Inc. Proprietary
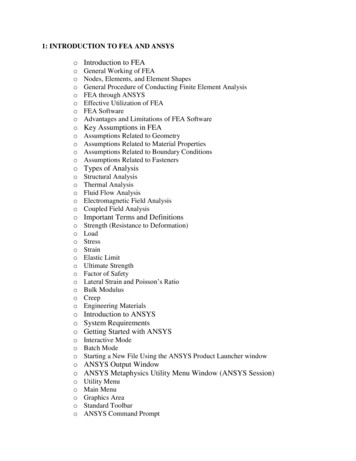
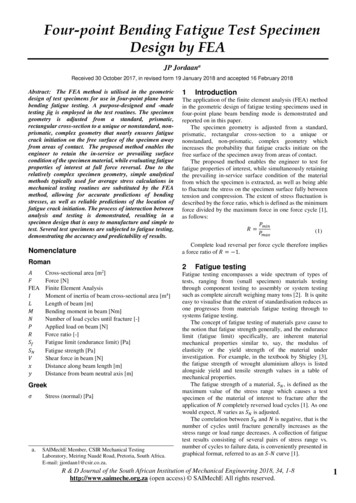
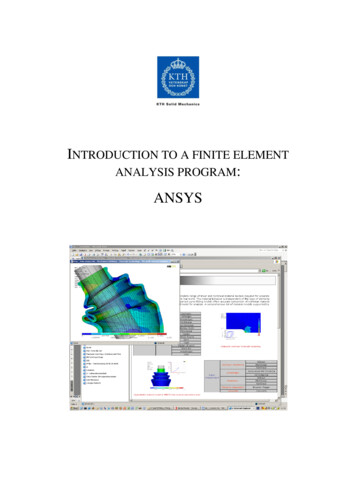
Fatigue Analysis in WorkbenchRainflow MatrixDamage MatrixIn this particular case although most of the countsoccur at the lower stress amplitudes, most of thedamage occurs at the higher stress amplitudes 2006 ANSYS, Inc.ANSYS, Inc. Proprietary
Fatigue Analysis in Workbench Equivalent Alternating Stress (Stress LifeOnly)– Stress Life always needs to query an SN curve torelate the fatigue life to the stress state– “Equivalent alternating stress” is the stress used toquery the fatigue SN curve after accounting forfatigue loading type, mean stress effects, multiaxialeffects, and any other factors in the fatigue analysis– Equivalent alternating stress is the last calculatedquantity before determining the fatigue life– This result is not applicable to Stress life with nonconstant amplitude fatigue loading due to the factmultiple SN queries per location are required andthus no single equivalent alternating stress exists– This result is not applicable to Strain Life 2006 ANSYS, Inc.ANSYS, Inc. Proprietary
Fatigue Analysis in Workbench Equivalent Alternating Stress (Stress LifeOnly)– The usefulness of this result is that in general itcontains all of the fatigue related calculationsindependent of any fatigue material properties Note that some mean stress theories use staticmaterial properties such as tensile strength soEquivalent Alternating Stress may not be totallydevoid of material properties 2006 ANSYS, Inc.ANSYS, Inc. Proprietary
Fatigue Analysis in Workbench Equivalent Alternating Stress (Stress Life Only)– Equivalent Alternating Stress may be useful in avariety of situations: Instead of possible security issues with proprietary materialstress life properties, an engineer may be given an“equivalent alternating stress” design criteria. The equivalent alternating stress may be exported to a 3rdparty or “in house” fatigue code that performs specializedfatigue calculations based on the industry specificknowledge. An engineer can perform a comparative analysis among avariety of designs using a result type (stress) that he may feelmore comfortable with. A part can be geometrically optimized with respect to fatiguewithout regard to the specific material or finishing operationsthat are going to be used for the final product 2006 ANSYS, Inc.ANSYS, Inc. Proprietary
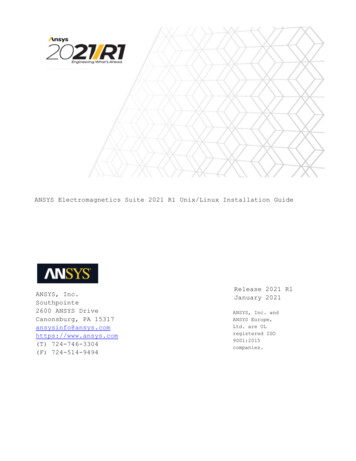
Fatigue Analysis in Workbench EquivalentAlternatingStress(Stress LifeOnly) 2006 ANSYS, Inc.ANSYS, Inc. Proprietary
Fatigue Analysis in Workbench Hysteresis Result for Strain Life– The Hysteresis result plots the local elastic-plastic responseat the critical location– In strain-life fatigue, although the finite element response maybe linear, the local elastic/plastic response may not be linear
Note that in the above equation, total strain (elastic plastic) is the required input. However, running an FE analysis to 搀攀琀攀爀洀椀渀攀 琀栀攀 琀漀琀愀氀 爀攀猀瀀漀渀猀攀 挀愀渀 戀攀 瘀攀爀礀 攀砀瀀攀渀猀椀瘀攀 愀渀搀 眀愀猀琀攀昀甀氀Ⰰ 攀猀瀀攀挀椀愀氀氀礀 椀昀 琀栀攀 渀漀洀椀渀愀氀 爀攀猀瀀漀渀猀攀 .