Transcription
PythonData ScienceHandbookESSENTIAL TOOLS FOR WORKING WITH DATApowered byJake VanderPlas
Python Data Science HandbookEssential Tools for Working with DataJake VanderPlasBeijingBoston Farnham SebastopolTokyo
Python Data Science Handbookby Jake VanderPlasCopyright 2017 Jake VanderPlas. All rights reserved.Printed in the United States of America.Published by O’Reilly Media, Inc., 1005 Gravenstein Highway North, Sebastopol, CA 95472.O’Reilly books may be purchased for educational, business, or sales promotional use. Online editions arealso available for most titles (http://oreilly.com/safari). For more information, contact our corporate/insti‐tutional sales department: 800-998-9938 or corporate@oreilly.com.Editor: Dawn SchanafeltProduction Editor: Kristen BrownCopyeditor: Jasmine KwitynProofreader: Rachel MonaghanDecember 2016:Indexer: WordCo Indexing Services, Inc.Interior Designer: David FutatoCover Designer: Karen MontgomeryIllustrator: Rebecca DemarestFirst EditionRevision History for the First Edition2016-11-17: First ReleaseSee http://oreilly.com/catalog/errata.csp?isbn 9781491912058 for release details.The O’Reilly logo is a registered trademark of O’Reilly Media, Inc. Python Data Science Handbook, thecover image, and related trade dress are trademarks of O’Reilly Media, Inc.While the publisher and the author have used good faith efforts to ensure that the information andinstructions contained in this work are accurate, the publisher and the author disclaim all responsibilityfor errors or omissions, including without limitation responsibility for damages resulting from the use ofor reliance on this work. Use of the information and instructions contained in this work is at your ownrisk. If any code samples or other technology this work contains or describes is subject to open sourcelicenses or the intellectual property rights of others, it is your responsibility to ensure that your usethereof complies with such licenses and/or rights.978-1-491-91205-8[LSI]
Table of ContentsPreface. . . . . . . . . . . . . . . . . . . . . . . . . . . . . . . . . . . . . . . . . . . . . . . . . . . . . . . . . . . . . . . . . . . . . . . xi1. IPython: Beyond Normal Python. . . . . . . . . . . . . . . . . . . . . . . . . . . . . . . . . . . . . . . . . . . . . . . 1Shell or Notebook?Launching the IPython ShellLaunching the Jupyter NotebookHelp and Documentation in IPythonAccessing Documentation with ?Accessing Source Code with ?Exploring Modules with Tab CompletionKeyboard Shortcuts in the IPython ShellNavigation ShortcutsText Entry ShortcutsCommand History ShortcutsMiscellaneous ShortcutsIPython Magic CommandsPasting Code Blocks: %paste and %cpasteRunning External Code: %runTiming Code Execution: %timeitHelp on Magic Functions: ?, %magic, and %lsmagicInput and Output HistoryIPython’s In and Out ObjectsUnderscore Shortcuts and Previous OutputsSuppressing OutputRelated Magic CommandsIPython and Shell CommandsQuick Introduction to the ShellShell Commands in IPython222335688991010111212131313151516161618iii
Passing Values to and from the ShellShell-Related Magic CommandsErrors and DebuggingControlling Exceptions: %xmodeDebugging: When Reading Tracebacks Is Not EnoughProfiling and Timing CodeTiming Code Snippets: %timeit and %timeProfiling Full Scripts: %prunLine-by-Line Profiling with %lprunProfiling Memory Use: %memit and %mprunMore IPython ResourcesWeb ResourcesBooks181920202225252728293030312. Introduction to NumPy. . . . . . . . . . . . . . . . . . . . . . . . . . . . . . . . . . . . . . . . . . . . . . . . . . . . . . 33Understanding Data Types in PythonA Python Integer Is More Than Just an IntegerA Python List Is More Than Just a ListFixed-Type Arrays in PythonCreating Arrays from Python ListsCreating Arrays from ScratchNumPy Standard Data TypesThe Basics of NumPy ArraysNumPy Array AttributesArray Indexing: Accessing Single ElementsArray Slicing: Accessing SubarraysReshaping of ArraysArray Concatenation and SplittingComputation on NumPy Arrays: Universal FunctionsThe Slowness of LoopsIntroducing UFuncsExploring NumPy’s UFuncsAdvanced Ufunc FeaturesUfuncs: Learning MoreAggregations: Min, Max, and Everything in BetweenSumming the Values in an ArrayMinimum and MaximumExample: What Is the Average Height of US Presidents?Computation on Arrays: BroadcastingIntroducing BroadcastingRules of BroadcastingBroadcasting in Practiceiv Table of 596163636568
Comparisons, Masks, and Boolean LogicExample: Counting Rainy DaysComparison Operators as ufuncsWorking with Boolean ArraysBoolean Arrays as MasksFancy IndexingExploring Fancy IndexingCombined IndexingExample: Selecting Random PointsModifying Values with Fancy IndexingExample: Binning DataSorting ArraysFast Sorting in NumPy: np.sort and np.argsortPartial Sorts: PartitioningExample: k-Nearest NeighborsStructured Data: NumPy’s Structured ArraysCreating Structured ArraysMore Advanced Compound TypesRecordArrays: Structured Arrays with a TwistOn to Pandas70707173757879808182838586888892949596963. Data Manipulation with Pandas. . . . . . . . . . . . . . . . . . . . . . . . . . . . . . . . . . . . . . . . . . . . . . 97Installing and Using PandasIntroducing Pandas ObjectsThe Pandas Series ObjectThe Pandas DataFrame ObjectThe Pandas Index ObjectData Indexing and SelectionData Selection in SeriesData Selection in DataFrameOperating on Data in PandasUfuncs: Index PreservationUFuncs: Index AlignmentUfuncs: Operations Between DataFrame and SeriesHandling Missing DataTrade-Offs in Missing Data ConventionsMissing Data in PandasOperating on Null ValuesHierarchical IndexingA Multiply Indexed SeriesMethods of MultiIndex CreationIndexing and Slicing a 20124128128131134Table of Contents v
Rearranging Multi-IndicesData Aggregations on Multi-IndicesCombining Datasets: Concat and AppendRecall: Concatenation of NumPy ArraysSimple Concatenation with pd.concatCombining Datasets: Merge and JoinRelational AlgebraCategories of JoinsSpecification of the Merge KeySpecifying Set Arithmetic for JoinsOverlapping Column Names: The suffixes KeywordExample: US States DataAggregation and GroupingPlanets DataSimple Aggregation in PandasGroupBy: Split, Apply, CombinePivot TablesMotivating Pivot TablesPivot Tables by HandPivot Table SyntaxExample: Birthrate DataVectorized String OperationsIntroducing Pandas String OperationsTables of Pandas String MethodsExample: Recipe DatabaseWorking with Time SeriesDates and Times in PythonPandas Time Series: Indexing by TimePandas Time Series Data StructuresFrequencies and OffsetsResampling, Shifting, and WindowingWhere to Learn MoreExample: Visualizing Seattle Bicycle CountsHigh-Performance Pandas: eval() and query()Motivating query() and eval(): Compound Expressionspandas.eval() for Efficient OperationsDataFrame.eval() for Column-Wise OperationsDataFrame.query() MethodPerformance: When to Use These FunctionsFurther Resourcesvi Table of 6202202208209210211213214215
4. Visualization with Matplotlib. . . . . . . . . . . . . . . . . . . . . . . . . . . . . . . . . . . . . . . . . . . . . . . 217General Matplotlib TipsImporting matplotlibSetting Stylesshow() or No show()? How to Display Your PlotsSaving Figures to FileTwo Interfaces for the Price of OneSimple Line PlotsAdjusting the Plot: Line Colors and StylesAdjusting the Plot: Axes LimitsLabeling PlotsSimple Scatter PlotsScatter Plots with plt.plotScatter Plots with plt.scatterplot Versus scatter: A Note on EfficiencyVisualizing ErrorsBasic ErrorbarsContinuous ErrorsDensity and Contour PlotsVisualizing a Three-Dimensional FunctionHistograms, Binnings, and DensityTwo-Dimensional Histograms and BinningsCustomizing Plot LegendsChoosing Elements for the LegendLegend for Size of PointsMultiple LegendsCustomizing ColorbarsCustomizing ColorbarsExample: Handwritten DigitsMultiple Subplotsplt.axes: Subplots by Handplt.subplot: Simple Grids of Subplotsplt.subplots: The Whole Grid in One Goplt.GridSpec: More Complicated ArrangementsText and AnnotationExample: Effect of Holidays on US BirthsTransforms and Text PositionArrows and AnnotationCustomizing TicksMajor and Minor TicksHiding Ticks or LabelsReducing or Increasing the Number of 5266268269270272275276277278Table of Contents vii
Fancy Tick FormatsSummary of Formatters and LocatorsCustomizing Matplotlib: Configurations and StylesheetsPlot Customization by HandChanging the Defaults: rcParamsStylesheetsThree-Dimensional Plotting in MatplotlibThree-Dimensional Points and LinesThree-Dimensional Contour PlotsWireframes and Surface PlotsSurface TriangulationsGeographic Data with BasemapMap ProjectionsDrawing a Map BackgroundPlotting Data on MapsExample: California CitiesExample: Surface Temperature DataVisualization with SeabornSeaborn Versus MatplotlibExploring Seaborn PlotsExample: Exploring Marathon Finishing TimesFurther ResourcesMatplotlib ResourcesOther Python Graphics 43073083093113123133223293293305. Machine Learning. . . . . . . . . . . . . . . . . . . . . . . . . . . . . . . . . . . . . . . . . . . . . . . . . . . . . . . . . 331What Is Machine Learning?Categories of Machine LearningQualitative Examples of Machine Learning ApplicationsSummaryIntroducing Scikit-LearnData Representation in Scikit-LearnScikit-Learn’s Estimator APIApplication: Exploring Handwritten DigitsSummaryHyperparameters and Model ValidationThinking About Model ValidationSelecting the Best ModelLearning CurvesValidation in Practice: Grid SearchSummaryFeature Engineeringviii Table of 375375
Categorical FeaturesText FeaturesImage FeaturesDerived FeaturesImputation of Missing DataFeature PipelinesIn Depth: Naive Bayes ClassificationBayesian ClassificationGaussian Naive BayesMultinomial Naive BayesWhen to Use Naive BayesIn Depth: Linear RegressionSimple Linear RegressionBasis Function RegressionRegularizationExample: Predicting Bicycle TrafficIn-Depth: Support Vector MachinesMotivating Support Vector MachinesSupport Vector Machines: Maximizing the MarginExample: Face RecognitionSupport Vector Machine SummaryIn-Depth: Decision Trees and Random ForestsMotivating Random Forests: Decision TreesEnsembles of Estimators: Random ForestsRandom Forest RegressionExample: Random Forest for Classifying DigitsSummary of Random ForestsIn Depth: Principal Component AnalysisIntroducing Principal Component AnalysisPCA as Noise FilteringExample: EigenfacesPrincipal Component Analysis SummaryIn-Depth: Manifold LearningManifold Learning: “HELLO”Multidimensional Scaling (MDS)MDS as Manifold LearningNonlinear Embeddings: Where MDS FailsNonlinear Manifolds: Locally Linear EmbeddingSome Thoughts on Manifold MethodsExample: Isomap on FacesExample: Visualizing Structure in DigitsIn Depth: k-Means 442445445446447450452453455456460462Table of Contents ix
Introducing k-Meansk-Means Algorithm: Expectation–MaximizationExamplesIn Depth: Gaussian Mixture ModelsMotivating GMM: Weaknesses of k-MeansGeneralizing E–M: Gaussian Mixture ModelsGMM as Density EstimationExample: GMM for Generating New DataIn-Depth: Kernel Density EstimationMotivating KDE: HistogramsKernel Density Estimation in PracticeExample: KDE on a SphereExample: Not-So-Naive BayesApplication: A Face Detection PipelineHOG FeaturesHOG in Action: A Simple Face DetectorCaveats and ImprovementsFurther Machine Learning ResourcesMachine Learning in PythonGeneral Machine 506507512514514515Index. . . . . . . . . . . . . . . . . . . . . . . . . . . . . . . . . . . . . . . . . . . . . . . . . . . . . . . . . . . . . . . . . . . . . . . 517x Table of Contents
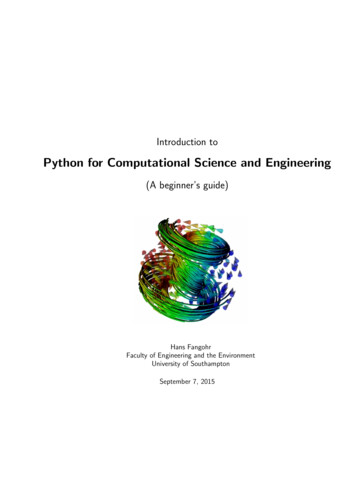
PrefaceWhat Is Data Science?This is a book about doing data science with Python, which immediately begs thequestion: what is data science? It’s a surprisingly hard definition to nail down, espe‐cially given how ubiquitous the term has become. Vocal critics have variously dis‐missed the term as a superfluous label (after all, what science doesn’t involve data?) ora simple buzzword that only exists to salt résumés and catch the eye of overzealoustech recruiters.In my mind, these critiques miss something important. Data science, despite its hypeladen veneer, is perhaps the best label we have for the cross-disciplinary set of skillsthat are becoming increasingly important in many applications across industry andacademia. This cross-disciplinary piece is key: in my mind, the best existing defini‐tion of data science is illustrated by Drew Conway’s Data Science Venn Diagram, firstpublished on his blog in September 2010 (see Figure P-1).Figure P-1. Drew Conway’s Data Science Venn Diagramxi
While some of the intersection labels are a bit tongue-in-cheek, this diagram capturesthe essence of what I think people mean when they say “data science”: it is fundamen‐tally an interdisciplinary subject. Data science comprises three distinct and overlap‐ping areas: the skills of a statistician who knows how to model and summarizedatasets (which are growing ever larger); the skills of a computer scientist who candesign and use algorithms to efficiently store, process, and visualize this data; and thedomain expertise—what we might think of as “classical” training in a subject—neces‐sary both to formulate the right questions and to put their answers in context.With this in mind, I would encourage you to think of data science not as a newdomain of knowledge to learn, but as a new set of skills that you can apply withinyour current area of expertise. Whether you are reporting election results, forecastingstock returns, optimizing online ad clicks, identifying microorganisms in microscopephotos, seeking new classes of astronomical objects, or working with data in anyother field, the goal of this book is to give you the ability to ask and answer new ques‐tions about your chosen subject area.Who Is This Book For?In my teaching both at the University of Washington and at various tech-focusedconferences and meetups, one of the most common questions I have heard is this:“how should I learn Python?” The people asking are generally technically mindedstudents, developers, or researchers, often with an already strong background in writ‐ing code and using computational and numerical tools. Most of these folks don’t wantto learn Python per se, but want to learn the language with the aim of using it as atool for data-intensive and computational science. While a large patchwork of videos,blog posts, and tutorials for this audience is available online, I’ve long been frustratedby the lack of a single good answer to this question; that is what inspired this book.The book is not meant to be an introduction to Python or to programming in gen‐eral; I assume the reader has familiarity with the Python language, including definingfunctions, assigning variables, calling methods of objects, controlling the flow of aprogram, and other basic tasks. Instead, it is meant to help Python users learn to usePython’s data science stack—libraries such as IPython, NumPy, Pandas, Matplotlib,Scikit-Learn, and related tools—to effectively store, manipulate, and gain insightfrom data.Why Python?Python has emerged over the last couple decades as a first-class tool for scientificcomputing tasks, including the analysis and visualization of large datasets. This mayhave come as a surprise to early proponents of the Python language: the languageitself was not specifically designed with data analysis or scientific computing in mind.xii Preface
The usefulness of Python for data science stems primarily from the large and activeecosystem of third-party packages: NumPy for manipulation of homogeneous arraybased data, Pandas for manipulation of heterogeneous and labeled data, SciPy forcommon scientific computing tasks, Matplotlib for publication-quality visualizations,IPython for interactive execution and sharing of code, Scikit-Learn for machinelearning, and many more tools that will be mentioned in the following pages.If you are looking for a guide to the Python language itself, I would suggest the sisterproject to this book, A Whirlwind Tour of the Python Language. This short report pro‐vides a tour of the essential features of the Python language, aimed at data scientistswho already are familiar with one or more other programming languages.Python 2 Versus Python 3This book uses the syntax of Python 3, which contains language enhancements thatare not compatible with the 2.x series of Python. Though Python 3.0 was first releasedin 2008, adoption has been relatively slow, particularly in the scientific and web devel‐opment communities. This is primarily because it took some time for many of theessential third-party packages and toolkits to be made compatible with the new lan‐guage internals. Since early 2014, however, stable releases of the most important toolsin the data science ecosystem have been fully compatible with both Python 2 and 3,and so this book will use the newer Python 3 syntax. However, the vast majority ofcode snippets in this book will also work without modification in Python 2: in caseswhere a Py2-incompatible syntax is used, I will make every effort to note it explicitly.Outline of This BookEach chapter of this book focuses on a particular package or tool that contributes afundamental piece of the Python data science story.IPython and Jupyter (Chapter 1)These packages provide the computational environment in which many Pythonusing data scientists work.NumPy (Chapter 2)This library provides the ndarray object for efficient storage and manipulation ofdense data arrays in Python.Pandas (Chapter 3)This library provides the DataFrame object for efficient storage and manipulationof labeled/columnar data in Python.Matplotlib (Chapter 4)This library provides capabilities for a flexible range of data visualizations inPython.Preface xiii
Scikit-Learn (Chapter 5)This library provides efficient and clean Python implementations of the mostimportant and established machine learning algorithms.The PyData world is certainly much larger than these five packages, and is growingevery day. With this in mind, I make every attempt through these pages to providereferences to other interesting efforts, projects, and packages that are pushing theboundaries of what can be done in Python. Nevertheless, these five are currently fun‐damental to much of the work being done in the Python data science space, and Iexpect they will remain important even as the ecosystem continues growing aroundthem.Using Code ExamplesSupplemental material (code examples, figures, etc.) is available for download book. This book is here to helpyou get your job done. In general, if example code is offered with this book, you mayuse it in your programs and documentation. You do not need to contact us for per‐mission unless you’re reproducing a significant portion of the code. For example,writing a program that uses several chunks of code from this book does not requirepermission. Selling or distributing a CD-ROM of examples from O’Reilly books doesrequire permission. Answering a question by citing this book and quoting examplecode does not require permission. Incorporating a significant amount of examplecode from this book into your product’s documentation does require permission.We appreciate, but do not require, attribution. An attribution usually includes thetitle, author, publisher, and ISBN. For example, “Python Data Science Handbook byJake VanderPlas (O’Reilly). Copyright 2017 Jake VanderPlas, 978-1-491-91205-8.”If you feel your use of code examples falls outside fair use or the permission givenabove, feel free to contact us at permissions@oreilly.com.Installation ConsiderationsInstalling Python and the suite of libraries that enable scientific computing isstraightforward. This section will outline some of the considerations to keep in mindwhen setting up your computer.Though there are various ways to install Python, the one I would suggest for use indata science is the Anaconda distribution, which works similarly whether you useWindows, Linux, or Mac OS X. The Anaconda distribution comes in two flavors: Miniconda gives you the Python interpreter itself, along with a command-linetool called conda that operates as a cross-platform package manager gearedxiv Preface
toward Python packages, similar in spirit to the apt or yum tools that Linux usersmight be familiar with. Anaconda includes both Python and conda, and additionally bundles a suite ofother preinstalled packages geared toward scientific computing. Because of thesize of this bundle, expect the installation to consume several gigabytes of diskspace.Any of the packages included with Anaconda can also be installed manually on top ofMiniconda; for this reason I suggest starting with Miniconda.To get started, download and install the Miniconda package (make sure to choose aversion with Python 3), and then install the core packages used in this book:[ ] conda install numpy pandas scikit-learn matplotlib seaborn ipython-notebookThroughout the text, we will also make use of other, more specialized tools inPython’s scientific ecosystem; installation is usually as easy as typing conda installpackagename. For more information on conda, including information about creatingand using conda environments (which I would highly recommend), refer to conda’sonline documentation.Conventions Used in This BookThe following typographical conventions are used in this book:ItalicIndicates new terms, URLs, email addresses, filenames, and file extensions.Constant widthUsed for program listings, as well as within paragraphs to refer to program ele‐ments such as variable or function names, databases, data types, environmentvariables, statements, and keywords.Constant width boldShows commands or other text that should be typed literally by the user.Constant width italicShows text that should be replaced with user-supplied values or by values deter‐mined by context.O’Reilly SafariSafari (formerly Safari Books Online) is a membership-basedtraining and reference platform for enterprise, government,educators, and individuals.Preface xv
Members have access to thousands of books, training videos, Learning Paths, interac‐tive tutorials, and curated playlists from over 250 publishers, including O’ReillyMedia, Harvard Business Review, Prentice Hall Professional, Addison-Wesley Profes‐sional, Microsoft Press, Sams, Que, Peachpit Press, Adobe, Focal Press, Cisco Press,John Wiley & Sons, Syngress, Morgan Kaufmann, IBM Redbooks, Packt, AdobePress, FT Press, Apress, Manning, New Riders, McGraw-Hill, Jones & Bartlett, andCourse Technology, among others.For more information, please visit http://oreilly.com/safari.How to Contact UsPlease address comments and questions concerning this book to the publisher:O’Reilly Media, Inc.1005 Gravenstein Highway NorthSebastopol, CA 95472800-998-9938 (in the United States or Canada)707-829-0515 (international or local)707-829-0104 (fax)We have a web page for this book, where we list errata, examples, and any additionalinformation. You can access this page at http://bit.ly/python-data-sci-handbook.To comment or ask technical questions about this book, send email to bookques‐tions@oreilly.com.For more information about our books, courses, conferences, and news, see our web‐site at http://www.oreilly.com.Find us on Facebook: http://facebook.com/oreillyFollow us on Twitter: http://twitter.com/oreillymediaWatch us on YouTube: http://www.youtube.com/oreillymediaxvi Preface
CHAPTER 1IPython: Beyond Normal PythonThere are many options for development environments for Python, and I’m oftenasked which one I use in my own work. My answer sometimes surprises people: mypreferred environment is IPython plus a text editor (in my case, Emacs or Atomdepending on my mood). IPython (short for Interactive Python) was started in 2001by Fernando Perez as an enhanced Python interpreter, and has since grown into aproject aiming to provide, in Perez’s words, “Tools for the entire lifecycle of researchcomputing.” If Python is the engine of our data science task, you might think of IPy‐thon as the interactive control panel.As well as being a useful interactive interface to Python, IPython also provides anumber of useful syntactic additions to the language; we’ll cover the most useful ofthese additions here. In addition, IPython is closely tied with the Jupyter project,which provides a browser-based notebook that is useful for development, collabora‐tion, sharing, and even publication of data science results. The IPython notebook isactually a special case of the broader Jupyter notebook structure, which encompassesnotebooks for Julia, R, and other programming languages. As an example of the use‐fulness of the notebook format, look no further than the page you are reading: theentire manuscript for this book was composed as a set of IPython notebooks.IPython is about using Python effectively for interactive scientific and data-intensivecomputing. This chapter will start by stepping through some of the IPython featuresthat are useful to the practice of data science, focusing especially on the syntax itoffers beyond the standard features of Python. Next, we will go into a bit more depthon some of the more useful “magic commands” that can speed up common tasks increating and using data science code. Finally, we will touch on some of the features ofthe notebook that make it useful in understanding data and sharing results.1
Shell or Notebook?There are two primary means of using IPython that we’ll discuss in this chapter: theIPython shell and the IPython notebook. The bulk of the material in this chapter isrelevant to both, and the examples will switch between them depending on what ismost convenient. In the few sections that are relevant to just one or the other, I willexplicitly state that fact. Before we start, some words on how to launch the IPythonshell and IPython notebook.Launching the IPython ShellThis chapter, like most of this book, is not designed to be absorbed passively. I recom‐mend that as you read through it, you follow along and experiment with the tools andsyntax we cover: the muscle-memory you build through doing this will be far moreuseful than the simple act of reading about it. Start by launching the IPython inter‐preter by typing ipython on the command line; alternatively, if you’ve installed a dis‐tribution like Anaconda or EPD, there may be a launcher specific to your system(we’ll discuss this more fully in “Help and Documentation in IPython” on page 3).Once you do this, you should see a prompt like the following:IPython 4.0.1 -- An enhanced Interactive Python.?- Introduction and overview of IPython's features.%quickref - Quick reference.help- Python's own help system.object? - Details about 'object', use 'object?' for extra details.In [1]:With that, you’re ready to follow along.Launching the Jupyter NotebookThe Jupyter notebook is a browser-based graphical interface to the IPython shell, andbuilds on it a rich set of dynamic display capabilities. As well as executing Python/IPython statements, the notebook allows the user to include formatted text, static anddynamic visualizations, mathematical equations, JavaScript widgets, and much more.Furthermore, these documents can be saved in a way that lets other people open themand execute the code on their own systems.Though the IPython notebook is viewed and edited through your web browser win‐dow, it must connect to a running Python process in order to execute code. To startthis process (known as a “kernel”), run the following command in your system shell: jupyter notebookThis command will launch a local web server that will be visible to your browser. Itimmediately spits out a log showing what it is doing; that log will look something likethis:2 Chapter 1: IPython: Beyond Normal Python
jupyter notebook[NotebookApp] Serving notebooks from local directory: /Users/jakevdp/.[NotebookApp] 0 active kernels[NotebookApp] The IPython Notebook is running at: http://localhost:8888/[NotebookApp] Use Control-C to stop this server and shut down all kernels.Upon issuing the command, your default browser should automatically open andnavigate to the listed local URL; the exact address will depend on your system. If thebrowser does not open automatically, you can open a window and manually open thisaddress (http://localhost:8888/ in this example).Help and Documentation in IPythonIf you read no other section in this chapter, read this one: I find the tools discussedhere to be the most transformative contributions of IPython to my daily workflow.When a technologically minded person is asked to help a friend, family member, orcolleague with a computer problem, most of the time it’s less a matter of knowing theanswer as much as knowing how to quickly find an unknown answer. In data scienceit’s the same: searchable web resources such as online documentation, mailing-listthreads, and Stack Overflow answers contain a wealth of information, even (espe‐cially?) if it is a topic you’ve found yourself searching before. Being an effective prac‐titioner of data science is less about memorizing the tool or command you should usefor every possible situation, and more about learning to effectively find the informa‐tion you don’t know, whether through a web search engine or another means.One of the most useful functions of IPython/Jupyter is to shorten the gap between theuser and the type of documentation and search th
Understanding Data Types in Python 34 A Python Integer Is More Than Just an Integer 35 A Python List Is More Than Just a List 37 Fixed-Type Arrays in Python 38 . Principal Component Analysis