Transcription
Phase Diagramsa ReviewTopic 2
Review ofPhase TransformationDiagrams
Solution and SolubilityExample: Solubility of salt in waterThere exists a maximum amount of salt that can becompletely dissolved in water; excess of salt stays as solid.This maximum amount is the solubility of salt in water.The solution containing the maximum concentration of saltis a saturated solution.Cooling of saturated solution results in the formation ofsolid salt from the solution, indicating that solubilitydecreases with decreasing T. This process is calledprecipitation and the solid formed is a precipitate.Solid salt – theHeating the solution will lead to the dissolving of theprecipitateprecipitate back into solution.In this example there exist two phases in the system and the two phases stay inequilibrium:dissolvingSolutionSalty water –the solutionSolidprecipitationThe same concepts apply to solids: solid solution, saturation, solubility, precipitation
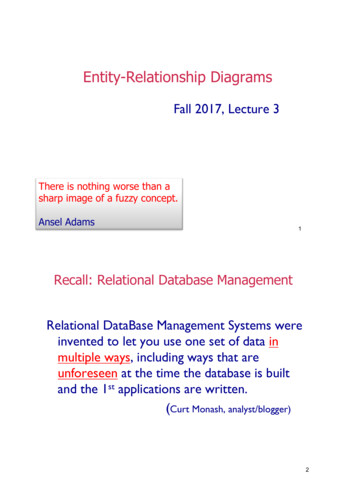
Phase DiagramsLiquidSolidPressurePhase diagrams are used to map outthe existence and conditions ofvarious phases of a give system.The phase diagram of water is acommon example. Water may stayin liquid, solid or gaseous states indifferent pressure-temperatureregions. Boundaries of the regionsexpress the equilibrium conditions interms of P and T. Water is amonolithic system. For binarysystems, which contains twoconstituents, such as binary alloys,phase diagrams are often expressedin the ase diagram of waterCriticalpoint221 bar1 bar0 barTriplepoint0 CGas100 CTemperature374 C
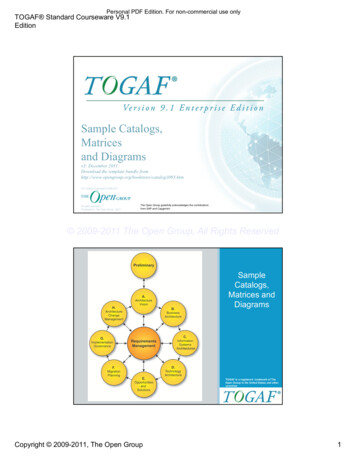
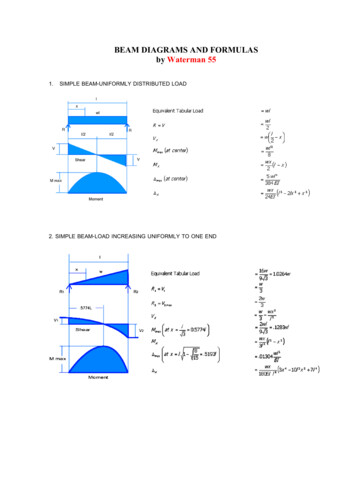
Binary Phase DiagramsSolidification of alloy Co starts oncooing at T1. The first solid formed hasa composition of Cs1 and the liquidCo. On further cooling the solidparticles grow larger in size and changetheir composition to Cs2 and then Co,following the solidus whereas the liquiddecrease in volume and changes itscomposition from Co to CL3 followingthe liquidus. The solidificationcompletes at T3.TemperatureThe simplest type of binary phasediagrams is the isomorphous system, inwhich the two constituents form acontinuous solid solution over theentire composition range. An exampleis the Ni-Cu system.1455 Cliquid phase Solution ofCu and NiT1T2CoCLT3 CL 231085 CCuCSCo12α phase (fcc) Solid solutionof Cu and NiCompositionLαCSNi
The simplest type of binary phasediagrams is the isomorphous system, inwhich the two constituents form acontinuous solid solution over theentire composition range. An exampleis the Ni-Cu system.TemperatureBinary Phase Diagramsliquid phase Solution ofCu and NiT*CLCompositions of phases is determinedby the tie lineThe relative fractions of the phases aredetermined by the lever rule1085 CW11455 CCoCSα phase (fcc) Solid solutionof Cu and NiW2L1L2CuCompositionNi
Lever RuleW1W2L1Weight fractions:L2
ExampleAt temperature T1, alloy Co is in the dual phase region,CLcomprising the liquid phase and the α-phase.CSCo(i) Determine the compositions of the two phases;(ii) Determine the weight fractions of the two phasesRead from the tie line:Liquid phase:Cu-30%Niα-phase:Cu-55%Ni1455 CC0WL Cs Co 55 50 0.2 20%Cs CL 55 30T1Wα Co CL 50 30 0.8 80%Cs CL 55 301085 CCSorWα 1 WL 1 0.2 0.8 80%CL30%NiCu55%Ni50%NiNi
Cooling Curvesdetermination of Phase diagramsII1455 C1085 CTLiquidus(thermal arrest)T1SolidusTT2IT11085 CTT2IICutI%IIINi
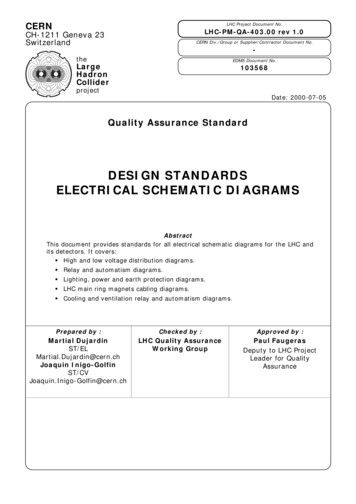
Eutectic SystemsPb-Sn phase diagramPb has a fcc structure and Sn hasa tetragonal structure. Thesystem has three phases: L, α andβ.Liquid300LiquidusTemperatureThe Pb-Sn system ischaracteristic of a valley in themiddle. Such system is known asthe Eutectic system. Thecentral point is the Eutecticpoint and the transformationthough this point is calledEutectic reaction: L α β350250Eutecticpointα L200L β150solidus100α phase: solidsolution of Snin fcc Pb50020solvusα βsolvus0 10Pb(Fcc)β phase: solidsolution of Pb intetragonal Sn30405060Wt%708090 100Sn(Tetra)
Solidification of Eutectic SystemsPb-Sn phase diagramThe cooling curve of this alloy issimilar to cooling curve I shown inslide 9.350IIIIIILiquid1300TemperatureAlloy I:At point 1: LiquidSolidification starts at liquidusAt point 2: L αThe amount α with TSolidification finishes at solidusAt point 3: αPrecipitation starts at solvusAt point 4: α βFurther cooling leads to formationand growth of more β precipitateswhereas Sn% in α decreasesfollowing the solvus.25020023αβ15041005000 10Pb(Fcc)2030405060Wt%708090 100Sn(Tetra)
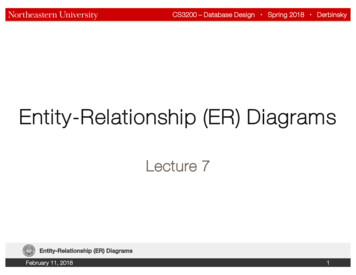
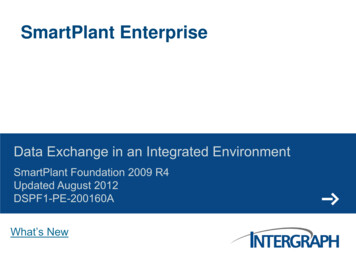
L(1)(a)(2)LLα(3)Precipitates in a Al-Si alloy;(a) optical microscopy,(b) scanning electronmicroscopy of fracture surface(4)αβα(b)
Solidification of Eutectic SystemsThe cooling curve of this alloy issimilar to cooling curve II shownin slide 9.Pb-Sn phase diagram350IIIIIILiquid300TemperatureAlloy II:At point 1: LiquidSolidification starts at eutecticpoint (where liquidus and solidusjoin)At point 2: L (α β) (eutecticreaction)The amounts of α and β increasein proportion with time.Solidification finishes at the sametemperature.At point 3: α βFurther cooling leads to thedepletion of Sn in α and thedepletion of Pb in β.2502001αβ215010035000 10Pb(Fcc)2030405060Wt%708090 100Sn(Tetra)
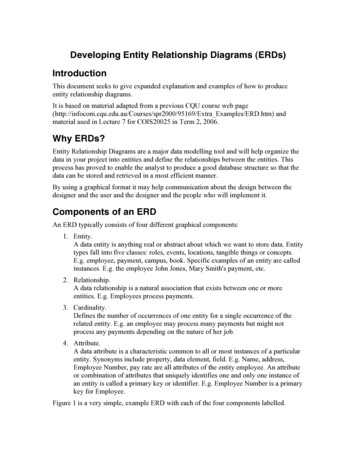
(1)L(2)LLNucleation of coloniesof α and β laminates(3)Pb-Sn eutecticEutectic structure ofintimate mix of α and β tominimise diffusion path
Solidification of Eutectic SystemsThe cooling curve of this alloy is acombination of the two cooling curvesshown in slide 9.Pb-Sn phase diagram350IIII300TemperatureAlloy III:At point 1: LiquidSolidification starts at liquidusAt point 2: L L α (pre-eutectic α)The amount α with TAt point 3: L (α β) (eutecticreaction)Solidification finishes at the eutectictemperatureAt point 4: α β (pre-eutectic α (α β) eutectic mixture)Further cooling leads to the depletionof Sn in α and the depletion of Pb inβ.IILiquid12502002αβ315041005000 10Pb(Fcc)2030405060Wt%708090 100Sn(Tetra)
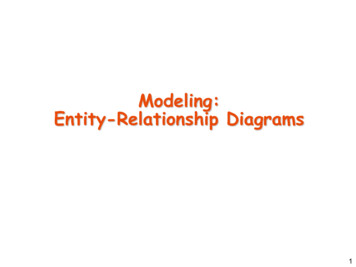
L(1)Cooling curve(2)LLα(3)(3)Cu-Ag alloyPre-euLαEuttecticααEutectic laminateof α and β
Solidification of Eutectic Systems350I300Can you describe thesolidification process of alloy IV,including microstructureevolution, morphology of phasesand cooling curve?IIIIIIVLiquid250200αβ15010050α β0PbSnHypoeutecticHypereutectic
Gibbs Phase RuleGibbs phase ruleF C N-PF: degree of freedomC: number of chemical variablesN: number of non-chemical variablesP: number of phasesApplication of Gibbs phase rule:For a binary system at ambient pressure:C 2 (2 elements)N 1 (temperature, no pressure)For single phase: F 2: % and T(a region)For a 2-phase equilibrium: F 1:% or T (a line)For a 3-phase equilibrium: F 0, (invariantpoint)Lone-phase regiontwo-phaseequilibrium (line)αβthree-phaseequilibrium (point)May we have a 4-phase equilibrium, in abinary system, or in any system?α βPbSn
Non-Equilibrium SolidificationSome transformations do not cause changes in composition, such as thesolidification of a pure metal, whereas some other do, such as thesolidification of an alloy into a solid solution. The former is known ansformations. Congruent transformations are cooling rate insensitiveand incongruent transformations are cooling rate sensitive – they rely oninterdiffusion to proceed. Solidification under a fast cooling rate, wherediffusion is insufficient to homogenise the composition simultaneouslyduring the process is known as the non-equilibrium solidification.A common consequence of non-equilibrium solidification is coring.
CoringAlloy Co starts solidification at T1. The firstsolid formed has composition Cs1. Onfurther cooling to T2, an outer shell ofcomposition Cs2 is formed surroundingCs1. Due to inadequate diffusion on fastcooling, a composition difference is created.The average composition of the solidcomposite at T2 is, thus, somewherebetween Cs1 and Cs2: Cs2*. The samesituation continues throughout the process.Under equilibrium condition solidificationcompletes at T3. However, under nonequilibriumcondition,theaveragecomposition of solid at T3 is Cs3* Co,indicating that solidification is not completedyet. Solidification actually ends when theaverage composition of solid equals Co, i.e.,at T4.EquilibriumsolidusCoT1 (start of solidification)Cs1CsT22Cs*2Cs*3T3 (end of solidificationunder equilibrium)T4 (actual end m solidification lowerseffective melting temperature.
CoringT1T2Cs1LEquilibriumsolidusCs1CoCs2T3Average solidcomposition: Cs2*T1 (start of solidification)Cs1CsT22Cs*2Average solidcomposition: Cs3*Cs*3T3 (end of solidificationunder equilibrium)T4 (actual end ofsolidification)EffectivesolidusT4Average solidcomposition:CoA%BThe cored structure: composition segregation,enrichment of high-Tm constituent in the core
Coring in Eutectic SystemscoAccording to the lever rule, theweight fraction of the eutecticproducts can be computed as:LUnder equilibrium condition:Weutαc b d babcdβUnder non-equilibrium condition:*eutWα βc a d a*Weut WeutABCoring leads to increase of weight fractionof eutectic products
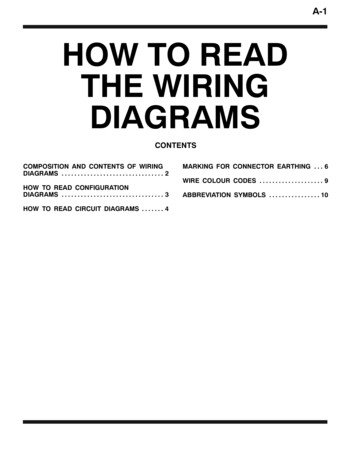
Constitutional SupercoolingCoSCLCSCLCLCoCSTxTmA%BTSSupercooling window caused byrising Tm, resulting in unstableinterfacexL
Dendrite Structure of MetalsA consequence of constitutional supercooling and destabilisation of solid-liquid interface isthe formation of dendritic structure, as commonly found in alloy castings. In such structure,gaps between dendrites and between dentitic fingers are regions rich of low-meltingtemperature phases and impurities. Dendritic branches themselves are often cored, too.This often require post-casting heat treatment to homogenise the structure.
Pb-Sn phase diagram β phase: solid solution of Pb in tetragonal Sn α phase: solid solution of Sn in fcc Pb Liquid Pb (Fcc) Sn (Tetra) 0 50 100 150 200 250 300 350 0 10 20 30 40 50 60 70 80 90 100