Transcription
Mass SpectrometryMS InterpretationGeneral Interpretation StrategiesiWherever you see this symbol, it is important to access the on-line courseas there is interactive material that cannot be fully shown in this referencemanual.
Aims and ObjectivesAims and ObjectivesAims Introduces students to the principles of mass spectral interpretation. Present fundamental concepts regarding mass spectral interpretationObjectivesAt the end of this Section you should be able to: List and explain the main characteristics of the mass spectrum Explain how mass spectrometric data can be used for structure analysis Explain why is important to optimise ESI/APCI parameters
ContentIntroductionMass to Charge RatioMass ResolutionDoublet MethodResolution of Single PeakHigh Mass ResolutionMass AccuracyHigh Mass AccuracyMass RangeMultiply Charged IonsSpectral FeaturesIsotopic abundancesHigh Mass Region –Brominated SampleThe Nitrogen RuleInterpretation StrategyLogical LossesIllogical lossesFragmentation in APIRings and InsaturationsNumber of CarbonsCleavages –Ion AbundanceCleavages –Simple MechanismsElectrospray IonisationESI ConsiderationsAPCI ConsiderationsAPPI ConsiderationsLC-MS Structural Information ModesMS/MS OverviewMS/MS ExperimentsProduct Ion ScanningOverviewApplicationPrecursor Ion ScanningOverviewApplicationConstant Neutral Loss ScanningOverviewApplicationSingle/Multiple Reaction MonitoringOverviewApplicationMS/MS Quantitative ConsiderationsReferences Crawford demy.com2
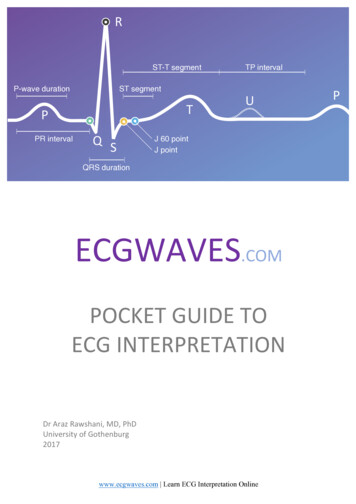
IntroductionMass Spectrometry is a wide-ranging analytical technique. It relates to the production andsubsequent separation and identification of charged species that are produced by avariety of ionisation methods.The importance of learning how to identify mass spectra lies in the fact that we cannotcreate a standard library for the identification of any single chemical compound (the massspectrum of a single compound could contain a huge amount of information and thenumber of chemical compounds is extremely huge). Nowadays standard libraries couldinclude a few hundred thousands spectra.A simple mass spectrum is represented by a two dimensional bar plot, the height of thebar (y component) is related to the intensity of the mass fragment ion and its location onthe spectra (x component) is related to the charge to mass ratio.[1]Mass SpectrumRemember:Ionisation is the process whereby electrons are either removed or added toatoms or molecules to produce ions. In LCMS, neutral molecules may becharged (producing cations in the positive ion mode or anions in the negative ionmode) by a number of different ways according to the selected ionisationinterface. Crawford Scientificwww.chromacademy.com3
Mass to Charge RatioThe mass spectrum of an analyte species is represented by a bar graph that plots signalabundance of the ions against mass-to-charge (m/z). This represents the mass of a givenparticle (Da) to the number (z) of electrostatic charges (e) that the particle carries. Theterm m/z (measured in Da/e) is the parameter of the particle that is measured by the massanalyzer.Prior to 1980 the mass-to-charge ratio was often incorrectly defined as m/e, where e is thecharge on an electron (1.6 x 10⁻¹⁹ Coulomb). The mass of a given particle is equal to thesum of the atomic masses in daltons (Da) of all of the elements that compose it.[1,2,3]Because many ions carry only one electrostatic charge the ratio m/z is frequently referredto as the particle ‘mass’; however, this can be misleading when dealing with certainanalyte species such as proteins which readily carry more than one fundamental charge.Dalton:One Dalton is the mass of a proton or neutron –an ethyl group has a mass of 27.The symbol for the mass unit is u, the use of u is no longer recommended byIUPAC (International Union of Pure and Applied Chemists) but Da.[2]The symbol u corresponds to 1/12 the mass of 12C, which is assigned the value12.000000 under IUPAC convention. Naturally occurring carbon is 98.892% 12Cand 1.108% 13C. The mass of 12C is 12 Da, and that of 13C is 13.00335 Da.Therefore, the average atomic mass of carbon is:(0.98892) (12 Da) (0.01108) (13.00335 Da) 12.01 Da Crawford Scientificwww.chromacademy.com4
Monoisotopic, nominal and average mass calculations:For the molecule of Butyric acid (C4H8O2) calculate: Monoisotopic massNominal massAverage massTable 1. Properties of atoms in CH3CH2CH2COOH.Molecular weight (Da)ElementAverageLightest IsotopeMost 49C12.01071212Monoisotopic mass: The mass of the ion or molecule calculated by summingthe atomic masses of the lightest isotopes.4 12 8 1.00783 2 15.9949 88.05244 DaNominal mass: (the mass of an ion or molecule calculated using the mass ofthe most abundant isotope of each element rounded to the nearest integervalue.4 12 8 1 2 16 88 DaAverage mass: (the value calculated from the average masses of the elements,weighted for abundance)4 12.0107 8 1.00794 2 15.9994 88.10512 DaMass ResolutionMass resolution (Rm) is the ability of a mass analyser to separate two adjacent peaks.The resolving power of a mass analyser is described by the equation below:[5]Rm m/ΔmOr in terms of parts-per-million:ppm 106 x m/Δm 106 x RmIn practice the resolving power of a mass analyser is determined by one of the next twomethods:[6] Doublet methodResolution of a single peakResolution is usually defined in one of two ways depending on the mass spectrometerbeing used. Crawford Scientificwww.chromacademy.com5
The 10% valley (intensity) definition states that two peaks are considered to be resolvedwhen they are separated by a valley, which is 10% of the height of each. This definition isused with magnetic sector instruments. The definition used with quadrupole, ion trap andtime of flight mass spectrometers is based on a peak width measured at 50% peak height(full width half maximum or FWHM)Doublet MethodIntIMAXIMINIVALLEYΔmm1m1m/zResolution of two peaksThe doublet method states that the two presented peaks are resolved if:1. IVALLEY 10% IMIN (magnetic sector instruments).2. IVALLEY 50% IMIN (quadrupole, ion trap and time of flight instruments)Here m is the measured or average mass and Δm is the mass difference between the two adjacentpeaks. Note that resolution will have slightly different values depending on whether the FWHM,10% or 50% valley definitions are used.Two molecules of identical nominal (integral) mass and different elemental composition, such as Arand C3H4 will differ significantly; e.g. 39.96239 and 40.06386. Any mass analyser which canoperate with a resolving power of at least 394.3 will be able to distinguish between these twospecies.%Int40[C H ]3 410040[Ar] 40.06386 DaΔm 40.06386 - 39.96239 0.10147Rm m/Δm 39.96239 DaRm(required) 40.013125 / 0.10147 394.350Δm39.940.040.1m/zResolution of two molecules with the same nominal mass Crawford Scientificwww.chromacademy.com6
Resolution of Single PeakIntIMAXIXΔmmm/zResolution of single peakIf IX 50% IMAX, then Δm is designated Full Width at Half Maximum (FWHM).Usually Δm is taken to be at half of the peak height (50% of IMAX) and Δm is designated Full Width[7]at Half Maximum (FWHM). In some cases the peak width is measured at 5% of the peak height.Note that resolution will have different values depending on whether Δm is measured (5% or 50%of IMAX). The resolving power required to resolve a peak can be easily calculated.m 501.96431Da%Int100Δm 0.21734DaΔm50501502503m/zResolution of a single peakm 501.96431DaΔm 0.21734DaRm m/ΔmRm 501.96431/0.21734 2309.58089 Crawford Scientificwww.chromacademy.com7
High Mass ResolutionIn order to elucidate or quantify analytes within organic mass spectrometry the massanalyser should be able to separate masses that differ by at least one mass unit. This isknown as unit mass resolution.[7] Unit mass resolution is required when using spectrallibraries for analyte identification.High resolution instruments in combination with the ability to accurately measure mass arerequired to determine the elemental composition of analyte species.[8] High resolutionmass analysers can be used for the removal of isobaric interferences (species with thesame nominal mass), or increased selectivity in MS/MS experiments.With ESI-MS and the trend towards analysis of heavier masses, higher resolution isrequired to isolate and identify analytes. High resolution mass analysers therefore have agreater role in high mass analysis applications where the resolving power is useful for theidentification of the charge state of multiply-charged ions.High resolution mass spectrometry has been used to determine atomic composition ofions. It is important to remember that different atoms present different molecular weights;therefore, different molecules presenting nominally the same mass but different atomiccompositions should be differentiated in a mass spectrometer with sufficient resolvingpower.In the previous section was stated that two molecules of identical nominal (integral) massand different elemental composition, such as Ar and C3H4 will differ significantly; e.g.39.96239 and 40.06386. Any mass analyser which can operate with a resolving power ofat least 394.3 will be able to distinguish between these two species.iLow/high mass resolution Crawford Scientificwww.chromacademy.com8
Mass AccuracyMass accuracy is the measurement of the closeness of the given measurement to the truemass of the analyte. In this instance Δ m accuracy denotes the difference between ameasured value (mmeasured) and the true mass (mtrue) of a substance.[9]Δ maccuracy mtrue — mmeasuredIn practice all mass analysers should be calibrated to the nearest mass unit and accurateassignment of mass is essential to virtually every aspect of mass analysis. Instrumentsshould be evaluated to assess drift over extended operating periods with figures of around0.1Da being reasonable.Exact mass measurement is done with very high accuracy (ppm) and in practice thisrequires high resolution in conjunction with high mass accuracy in order to rule out thepossibility of isobaric interferences.High Mass AccuracyMass instability may arise from many sources including the stability of the instrumentselectronics, temperature fluctuations, tuning and contamination of the mass analyser etc.Mass accuracy must be maintained throughout the entire mass range and even smallchanges in mass accuracy can have an adverse effect on the interpretation of spectra,and quantitative results.High mass accuracy is referred to as exact mass measurement, and when measuring themass of a particular compound at the ppm level in mass accuracy, it is possible tounambiguously determine elemental composition.Knowledge of the elementalcomposition of a molecular or fragment ion is one of the most powerful analytical tools foridentifying and elucidating the structure of unknowns. In practice, mass accuracy andhigh resolution are closely related. Crawford Scientificwww.chromacademy.com9
To observe the isotopic profile of an ion, resolution must increase with m/z —a resolutionof approximately twice the ion mass is required for isotopic resolution.The table below presents typical resolution, mass range and accuracy for several types ofmass analyserTable 2 “resolution, mass range and accuracy for selected mass analyser types”InstrumentResolutionMass RangeMass AccuracyQuadrupoleIon Trap500-20002 – 2000Da0.1Da500-2000100-2000Da0.1Da6Time of Flight500-12,00050 – 1x10 Da0.0001DaMagnetic Sector800-50,0002 - 15,000Da0.0001DaMass spectra of species with mass greater than 2000 Da can change as the isotopicmass distribution from the heavier isotopes shifts.[10] In general, high mass range isconsidered as any species with a mass of more than 2,000 Da.Remember:Accuracy: Degree of agreement between the best-estimated found value andits true value.Precision: Is defined as the extent to which results correspond to each other.Reproducibility: Refers to the agreement between analyses in differentlaboratories and include variations in equipments.Mass RangeMass analysers measure mass-to-charge ratio (m/z). The difference between the highestand lowest measurable m/z denotes the mass analyser range. The difference betweenmass resolution, mass accuracy and mass range is shown.Electrospray ionisation allows more than one fundamental charge to reside on the gasphase molecule of interest (allowing the molecule to be measured at a lower m/z). Anincrease in z will extend the upper mass limit of the analyzerTime-of-flight (TOF) mass analysers present no upper mass limit. Recent developmentsin rapid ion detection are promoting TOF to be the first choice for high mass analysis.The mass range of any particular analyser is governed by the instrument configurationand its ability to generate gas phase ionic species. Crawford Scientificwww.chromacademy.com10
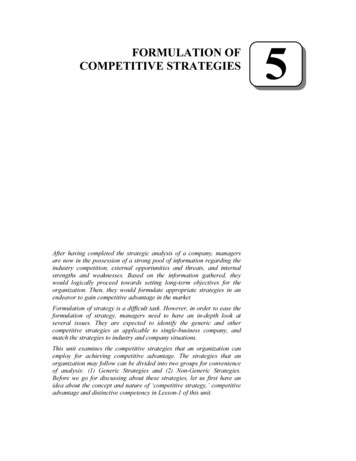
Mass spectrum detailsMultiply Charged IonsIt is possible that during the API process the analyte molecule will acquire two or moreelectrostatic charges, due to the molecular conformation, numbers of functional moietiescapable of ionisation etc.Doubly charged ions are produced when gaseous species acquire two electrostaticcharges per molecule. Doubly charged ions present a peak in the mass spectrum at anm/z value exactly half of the mass of the molecular (singly charged) ion.Some analyte species (high molecular weight proteins and peptides are good examples)may acquire many electrostatic charges during the API process. These species areknown as ‘multiply-charged’ ions. Signals coming from multiply charged ions often needto be de-convoluted to establish the number of charges that the ion carries and to obtaininformation on its true molecular weight.[3]Certain high molecular weights compounds presenting the ability of holding multiplecharges can be analysed with traditional mass analysers. The m/z ratio (the property thatis measured by the analyzer) decreases with the number of electrostatic charges held bythe ion. Hence compounds that would otherwise be beyond the mass range of typicalinstruments can be analysed since the m/z ratio of the multiply-charged ion is within themass range of the instrument. Crawford Scientificwww.chromacademy.com11
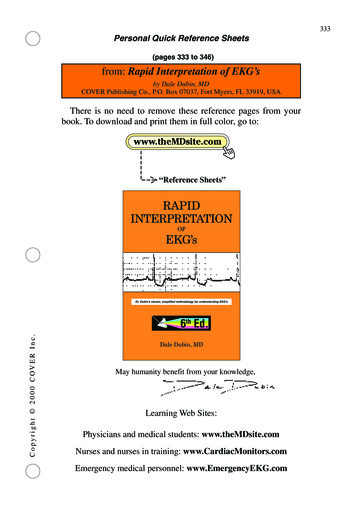
ONH2HOHNONNOHNNOONH2HOOONHHONNH2NH2ONNH2 NNH2SNH2Substance P (C63H98N18O13S, 1347.63 Da) is an 11-amino acid polypeptide with thesequence: Arg-Pro-Lys-Pro-Gln-Gln-Phe-Phe-Gly-Leu-Met.ESI-MS mass spectrum of Substance P (oversimplified)Nerve cells communicate with one another through neurotransmitters, Substance P is onesuch neurotransmitter. It is a protein found in the brain and spinal cord, and is associatedwith some inflammatory processes in the joints, its function is to cause pain. Crawford Scientificwww.chromacademy.com12
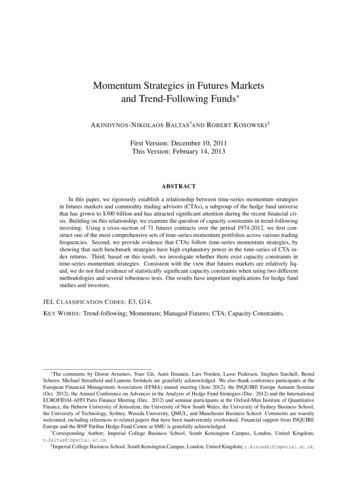
Spectral FeaturesMolecular ions represent intact species. They are precursors for all fragment ions thatconstitute the spectrum. The molecular-ion peak appears at an m/z value numericallyequal to the nominal molecular weight of the compound (the weight calculated bysumming the atomic masses of the most abundant isotope of each atom composing themolecule).Very often in API-MS adducts ions are formed due to in-source gas phase reactions.Molecular species such as [M H] or [M-H]- appear at one mass unit above or below thenominal molecular mass of the analyte species.The base peak refers to the most intense peak in the mass spectrum and is used as thereference peak when normalising all peaks within the spectrum.[4]The relative intensity of a peak expresses its intensity relative to the base peak. Therelative intensity of any peak is conventionally displayed as either Abundance or % on they-axis of the mass spectrum.iAcetone mass spectrum (oversimplified)Important:Molecular Ion: The ionised form of the molecule.The ion M . is known as the molecular ion.M M e An ion formed by the removal from (positive ions) or addition to (negative ions) amolecule of one electron without fragmentation of the molecular structure.Base Peak: This peak presents the highest intensity in the spectrum Crawford Scientificwww.chromacademy.com13
Isotopic abundancesIsotopes are atoms with the same atomic number but different atomic weight. Thedifference in weight between isotopes of the same element is caused by a difference inthe number of neutrons. The relative abundance of an isotope in nature compared toother isotopes of the same element is relatively constant.[5, 6, 7, 8, 9, 10, 11]The isotopic abundances of the elements can be classified into three general categories: "A": Elements with one natural isotope in appreciable abundance."A 1": Elements with two natural isotopes, the second being one mass unitheavier than the most abundant isotope."A 2": Elements with two natural isotopes, the second being two mass unitsheavier than the most abundant isotope.The high mass region in some cases permits infer if “A 2” elements are present:[5]Table 3. Relative abundances of selected isotopesAtomMass%R.A. dine126.9045100Sulphur31.9720100Where %R.A. is the percentage of relative abundance%R.A. “A 1”%R.A. “A 2”1.10.3732.5980.84.4Once the molecular ion is identified, then a normalization process must be done. Isotopiclines must be referred as a percentage of the molecular ion.The halogens are particularly useful as their isotope patterns are very characteristic andeasy to recognise. Compounds containing single chlorine exhibits a pair of lines separated 2 Da andin relative abundance of 3:1.Compounds containing single bromine exhibits a pair of lines separated 2 Da andin relative abundance of 1:1.Similar analysis can be done with elements as Si or S.If more than one “A 2” elements are present in a molecule, then the spectrumbecomes complex. Crawford Scientificwww.chromacademy.com14
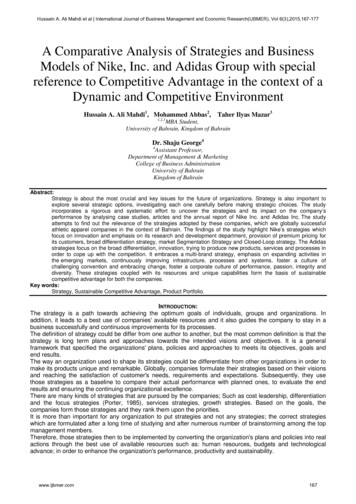
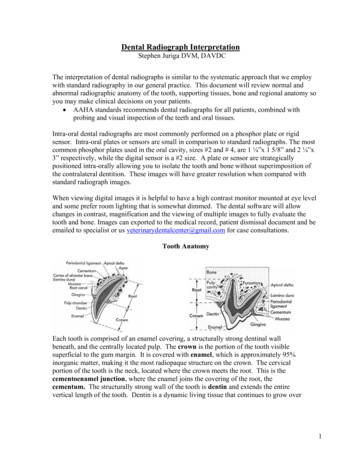
The high mass region of the spectrum can be used to infer about the presence of certainisotopic elements.1. Identify molecular ion and isotope cluster.2. If A 2 abundance is lower than 98% of A abundance then NO bromines are present.3. If A 2 abundance is lower than 33% of A abundance then NO chlorines are present.4. If A 2 abundance is lower than 4.4% of A abundance then NO sulphur is present. Sulphur's A 1 isotope will provide a 0.8% contribution to A 1 abundance.5. If A 2 abundance is lower than 3.4% of A abundance then NO silicon is present. Silicon's A 1 isotope will provide a 5.1% contribution to A 1 abundance. This combination of A 1 and A 2 abundances make silicon easy to identify.6. Multiple carbon atoms (and nitrogens) provide additional A 2 abundance that must beaccounted for.Table 4. A 2 IntensitiesIntensity of “A 2” peak lower than98% A abundance33% A abundance4.4% A abundance3.4% A abundanceSampleBromine is not presentChlorine is not presentSulphur is not presentSilicon is not presentImportant:The high mass region of the spectrum in some cases permits infer if“A 2” elements are present:[5] Compounds containing single chlorine exhibits a pair of linesseparated 2 Da and in relative abundance of 3:1.Compounds containing single bromine exhibits a pair of linesseparated 2 Da and in relative abundance of 1:1.Similar analysis can be done with elements as Si or S.If more than one “A 2” elements are present in a molecule, thenthe spectrum becomes complex.Characteristic high mass region spectrums for samples containing selected “A 2”elements are presented below. Crawford Scientificwww.chromacademy.com15
High mass region of samples containing seleceted “A 2” elements Crawford Scientificwww.chromacademy.com16
Table 5. Relative abundances of selected 0.0129419.878.91834 50.69105.90651.25112.9044 12.2239.96259 96.9545.95369 0.0041298.9135.90710.19132.905410034.96885 8.9984100SymbolMassAbund.SymbolMassAbund.Sb(123) 122.9042Ar(38) 37.9627342.70.063Ar(40)39.9623899.6Ba(132) 131.905Ba(136) 135.90460.17.85Ba(134) 133.9045Ba(137) 50.191.10.25Cd(111) 110.9042Cd(116) 115.9048Ca(43) 42.95877Ce(140) 14.952.2 Crawford ScientificCr(53)SymbolMassAbund.Ba(138) 137.905271.712.87.490.14Cd(112) 111.902824.13Ca(44)43.955492.08688.48Ce(142) 141.909211.0852.940659.5Dy(160) 159.9252Dy(163) 162.9287Er(166) 38882.36Dy(164) 163.9292Er(167) 166.932128.222.9517
Table 5. Relative abundances of selected isotopes 16178.9458 13.743.016029 0.0001164.93031001.007825 15200.970313.291.90681 14.8495.90468 16.68141.9077 27.13145.9131 17.19SymbolMassGa(71) 70.9247Gd(154) 153.9209Gd(158) 157.9241Ge(72) 6.90602142.9098147.916910.129.659.259.5512.185.76 Crawford ScientificSymbolMassAbund.SymbolMassAbund.Gd(155) 154.8226Gd(160) 159.9271Ge(73) 72.9234614.821.867.8Gd(156) 1.6Fe(58)Kr(83)57.9332882.914130.2811.5Pb(207) 206.975922.1Pb(208) 1143.9101149.9209176.815.9224.1323.85.64Hg(200) 199.968323.1Mo(100) 99.90747Nd(145) 144.91269.638.3www.chromacademy.com18
Table 5. Relative abundances of selected isotopes (190)Pt(196)PotassiumK(39)Praseodymium .657.93535 68.2763.927970.9192.9063810014.00307 99.63183.95250.02188.958216.115.99492 99.76101.90561.02107.9039 073.922480.979.9165249.627.97693 92.23106.9051 51.8422.9897710083.913430.56SymbolMassNe(21) 20.99385Ni(60) 40)191.961197.967939.9640.797.20.012Re(187) 7.4Se(76) 75.91921Se(82) 81.91671Si(29)28.9765Ag(109) 108.9048Sr(86)85.90927 Crawford ScientificSymbolMassNe(22) 21.99138Ni(61) 99916104.90511.6410.222.33Os(188) 187.955913.3Pd(106) 594103.9054147.9148151.919712.718.711.326.7Ru(100) 99.9042212.6Sm(154) 78)77.917323.5Sr(88)87.9056382.5819
Table 5. Relative abundances of selected isotopes r(90)Zr(96)MassAbund.31.97207 95.02179.9475 0.012121.90312.6125.9033 18.95158.9254100202.9723 28.6234.0409 925330.689.90471 51.4595.908272.78SymbolMassAbund.S(33) 32.971460.75Ta(181) 180.94899.99Te(123) 122.90430.91Te(128) 127.9045 31.69SymbolMassS(34) 33.96787Abund.4.21SymbolMassS(36) 35.96708Abund.0.02Te(124) 123.9028Te(130) 129.90624.8233.8Te(125) 124.90447.140.368.6Sn(116) 115.9017Sn(120) 4.35.67.3Sn(115) 114.9033Sn(119) 0510.7299.750.0921.2U(238)238.050899.27Xe(128) 127.9035Xe(132) 131.90411.9126.9Xe(129) 128.9048Xe(134) 133.905426.410.4Yb(170) 169.9348Yb(173) 172.93823.0516.12Yb(171) 170.9363Yb(174) 173.938914.331.8Yb(176) .17Zr(94)93.9063217.33 Crawford Scientificwww.chromacademy.com20
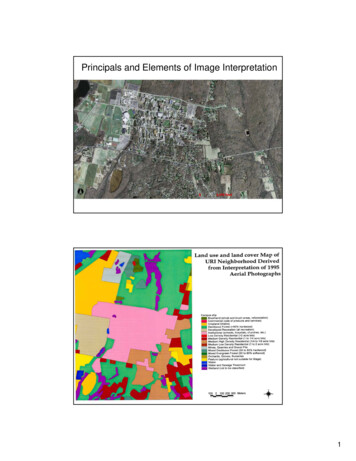
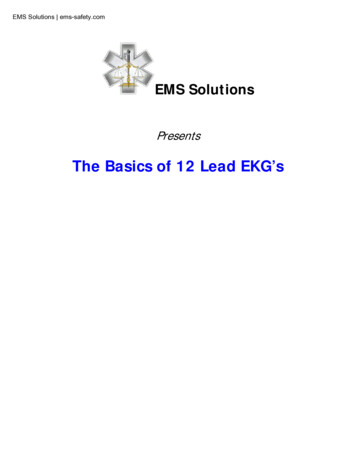
High Mass Region –Brominated SampleIn the present example we are going to explore the high mass region of a bromobenzenesample.As was explained before, in some cases, the high mass region (of a mass spectrum)permits infer if “A 2” elements are present.For practical purposes we are going to consider that our presented spectrum wasobtained under the right conditions (all parameters optimised).Remember: When analysing high mass region signals, you should:1. Identify the molecular Ion (“A” peak)2. Calculate the Normalising Factor (NF), according to the formula:NF 100Intensity Molecular Ion3. Normalise high mass region signals (multiply all intensities by NF)4. Compare your spectrum (if possible) with generic high mass spectrumsiBromobenzene mass spectrum (oversimplified) Crawford Scientificwww.chromacademy.com21
1. Molecular Ion (“A” peak): Located at m/z 156. Intensity 61.92. NF 100/(Intensity Molecular Ion) 100/61.93. Normalise signals (multiply intensities by NF)Table 6. Normalisation processm/z signalIntensityNormalised Intensity15661.961.9 100 / 61.9 10015860.960.9 100 / 61.9 97.94. Compare with generic spectrumsNote that the general appearance of the high mass region closely matches the genericspectrum for compounds possessing one bromine atom per structure. Crawford Scientificwww.chromacademy.com22
The Nitrogen RuleThe “Nitrogen Rule” states that:[13]“A compound with an odd molecular weight will have an odd number of nitrogen’s.Compounds with an even molecular weight will have either no nitrogen or an even numberof nitrogen atoms”.Therefore if you have identified the molecular ion and it is odd you can assume an oddnumber of nitrogen atoms are present.Molecules with an ODD number of nitrogen atoms have ODD masses. Ions which resultfrom simple fragmentation have EVEN masses.Molecules with an EVEN number of nitrogen atoms (cero is an even number) have EVENmolecular weights. Ions which result from simple fragmentation have ODD masses.Important:Molecules with an ODD number of nitrogen atoms have ODD masses.Ions which result from simple fragmentation have EVEN masses.Molecules with an EVEN number of nitrogen atoms (cero is an evennumber) have EVEN molecular weights. Ions which result from simplefragmentation have ODD masses.HiNN-methyl-2-butanamine(C5H13N, 87.16 Da)N-methyl-2-butanamine (C5H13N, 87.16 Da) mass spectrum (oversimplified) Crawford Scientificwww.chromacademy.com23
Interpretation Strategy1.Ionisation type. Consider what type of ion source was used to produce the MSspectrum (soft like ESI or harsh like electron impact).2.General inspection of the spectrum. Does it have many lines (easily brokenbonds) or does it have relatively few lines (stable ions). Information that needs to beconsidered from the mass spectrum: Mass of fragmentsPresence of isotopes linesGaps between lines3.Find the molecular ion if possible. Molecular ions are not always present in thespectrum. In some cases higher mass adduct ions can be formed making difficult themolecular ion identification. The presence of the molecular ion can be confirmed by theuse of “logical and illogical losses”4.Identify the highest m/z fragment. Is this fragment the molecular ion? If thisfragment has an odd m/z value and effectively is the molecular ion, then the presence ofan odd number of nitrogen atoms in the molecule can be expected (the nitrogen rule).[13]5.Try to find “A 2” elements. By inspection (high mass region of the spectrum),try to find the number and the kind(s) of “A 2” e
Aims and Objectives Aims and Objectives Aims Introduces students to the principles of mass spectral interpretation. Present fundamental concepts regarding mass spectral interpretation