Transcription
WOLFRAM WHITE PAPERBacktesting TradingStrategies Using WolframFinance PlatformTM
IntroductionWolfram Finance Platform’s capabilities in data acquisition and management, computation, and reportgeneration make it the platform of choice for implementing a backtesting engine to simulate tradingstrategies. Thanks to its interoperability with languages like C , Java, and R, quantitative analystscan use their Finance Platform code in a heterogeneous environment. In this paper we explore onepossibility for evaluating portfolio performance using Wolfram Finance Platform and describe thethought process behind it.Data AcquisitionWolfram Alpha integrationThere are many ways to obtain financial data through Wolfram Finance Platform. In the examplebelow, we directly access Apple’s stock prices from 2012 to today using the built-in Wolfram Alphafunctionality:WolframAlpha["AAPL from 2012 to today",{{"DateRangeSpecified:Close:FinancialData", 1}, "TimeSeriesData"}];These can be readily plotted directly in Wolfram Finance Platform:DateListPlot[%, Joined - True, Filling - Axis, PlotLabel - "Apple closingprices, 2012 to present"]This integration is extremely powerful, making financial data, economic time series, weather, andgeographical data available to Wolfram Finance Platform users.Backtesting Trading Strategies Using Wolfram Finance PlatformTM 1
FinancialData functionWe can also use the built-in FinancialData function to obtain the same data for Apple’s stockprices from 2012 to today. Note that FinancialData is one of those superfunctions that collatedata from a wide range of sources and is described ata.html:data FinancialData["AAPL", "OHLCV", {{2012, 1, 1}, DateList[]}];TradingChart[data]BloombergLinkWe can use Finance Platform’s BloombergLink to access intraday data, present it in a table, and plotit:Needs["BloombergLink uest a snapshot from the data source:MarketDataGet["Snapshot", "Instruments" - {"IBM Equity", "AAPL Equity", "BNNYEquity"}, "Fields" - {"CUR MKT CAP", "LAST PRICE"}]MarketDataTableA99IBM Equity, 2.24664 µ 1011 , 194.77 ,9AAPL Equity, 5.47913 µ 1011 , 585.964 ,9BNNY Equity, 6.23376 µ 108 , 36.54 ,8id, CUR MKT CAP, LAST PRICE , SnapshotE2 Backtesting Trading Strategies Using Wolfram Finance PlatformTM
Create a table using Grid:Grid[%]idIBM EquityAAPL EquityBNNY EquitySnapshotCUR MKT CAPLAST PRICE11194.7711585.964836.542.24664 µ 105.47913 µ 106.23376 µ 10The result from the command MarketDataSubscribe can be directly applied to TradingChart togenerate a candlestick OHLC chart with a volume bar chart:subscription ument" - "AAPL US Equity","Fields" - "LAST g Trading Strategies Using Wolfram Finance PlatformTM 3
Database connectivityUsing DatabaseLink, we can connect to an SQL database to obtain data. The following functionshows how to query a database to retrieve prices for a list of tickers:Options[LoadDataFromDatabase] {ConnectionName - "", Tickers- {}};LoadDataFromDatabase[universe List, fields List, outputNames List, dataPer List,opts : OptionsPattern[]] : Module[{tickers, strFlds, connName, strSQLQuery, conn, rawData, stDate,enDate, dataPeriod},tickers OptionValue[Tickers];If[Length[tickers] 0,tickers universe;];dataPeriod dataPer;If[! ((dataPeriod All) ((Head[dataPeriod] List) &&(Length[dataPeriod] 2))),Message[LoadDataFromDatabase::dtper, dataPeriod];dataPeriod All;];If[Length[fields] 0,strFlds "pr date";(strFlds StringJoin[strFlds, ",", #]) & /@ fields;If[dataPeriod All,strSQLQuery "ORDER BY internalID,pr date;";,stDate DateString[dataPeriod[[1]], {"Year", "-", "Month", "-", "Day"}];enDate DateString[dataPeriod[[2]], {"Year", "-", "Month", "-", "Day"}];strSQLQuery "AND (pr date '" stDate "') AND (pr date '" enDate "') ORDER BY internalID,pr date;";];connName OptionValue[ConnectionName];conn OpenSQLConnection[connName];rawData {#, outputNames, SQLExecute[ conn, "SELECT " strFlds " FROM Prices WHERE internalID '" # "' " strSQLQuery] /.{SQLDateTime[x ] - x}} & /@ eturn[{}]];];Note the use of pattern matching that easily converts the SQLDateTime object into a WolframLanguage date ( ê. 8SQLDateTime@x D - x ).Data PreprocessingAfter acquiring data, it is preprocessed to detect anomalies such as missing data or outliers. Usingmultiple sources is usually a good remedy for these issues, but is not always an option. Althoughproblem-dependent, preprocessing can be simplified with Wolfram Finance Platform’s patternmatching functionality.4 Backtesting Trading Strategies Using Wolfram Finance PlatformTM
Another preprocessing task is data preparation. Data needs to be transformed depending on themodel used. Data normalization, for example, makes data comparable and avoids overweighting avariable because of its relatively large amplitude. Another example is dimensionality reduction, inwhich the initial dataset is embedded in a new, smaller space, providing better models and a moreconcise representation of the data.The following sequence demonstrates preprocessing of raw data:data {{{2010, 1, 4}, 208.14 }, {{2010, 1, 5}, 208.5 }, {{2010, 1, 6}, 205.18 },{{2010, 1, 7}, 204.8 }, {{2010, 1, 8}, 206.16 }, {{2010, 1, 11}, 204.34 },{{2010, 1, 12}, 202.02 }, {{2010, 1, 13}, -204.87 }, {{2010, 1, 14}, 203.68 },{{2010, 1, 15}, 20028}, Missing[]};Use Cases to remove data that contains non-numeric values:data Cases[data, { String List, ?NumericQ}]Use Select to remove numeric data points that could be numerically incorrect:Select[data, 0 #[[2]] 1000 &]In this next sequence, we use Wolfram Alpha as another source to validate data:data {{{2010, 1, 4}, 214.01 }, {{2010, 1, 5}, 214.38 }, {{2010, 1, 6},210.97 }, {{2010, 1, 7}, 210.58 }, {{2010, 1, 8}, 211.98 }, {{2010, 1, 11},210.11 }, {{2010, 1, 12}, 207.72 }, {{2010, 1, 13}, 210.65 }, {{2010, 1, 14},209.43 }, {{2010, 1, 15}, 205.93 }, {{2010, 1, 19}, 215.04 }, {{2010, 1, 20},211.73 }, {{2010, 1, 21}, 208.07 }, {{2010, 1, 22}, 197.75 }, {{2010, 1, 25},203.07 }, {{2010, 1, 26}, 205.94 }, {{2010, 1, 27}, 207.88 }, {{2010, 1, 28},199.29 }, {{2010, 1, 29}, 192.06 }, {{2010, 2, 1}, 194.73 }, {{2010, 2, 2},195.86 }, {{2010, 2, 3}, 199.23 }, {{2010, 2, 4}, 192.05 }, {{2010, 2, 5},195.46 }, {{2010, 2, 8}, 194.12 }, {{2010, 2, 9}, 196.19 }, {{2010, 2, 10},195.12 }, {{2010, 2, 11}, 198.67 }, {{2010, 2, 12}, 200.38 }, {{2010, 2, 16},203.4 }, {{2010, 2, 17}, 202.55 }, {{2010, 2, 18}, 202.93 }, {{2010, 2, 19},201.67 }, {{2010, 2, 22}, 200.42 }, {{2010, 2, 23}, 197.06 }, {{2010, 2, 24},200.66 }, {{2010, 2, 25}, 202. }, {{2010, 2, 26}, 204.62 }, {{2010, 3, 1},208.99 }, {{2010, 3, 2}, 208.85 }, {{2010, 3, 3}, 209.33 }, {{2010, 3, 4},210.71 }, {{2010, 3, 5}, 218.95 }, {{2010, 3, 8}, 219.08 }, {{2010, 3, 9},223.02 }, {{2010, 3, 10}, 224.84 }, {{2010, 3, 11}, 225.5 }, {{2010, 3, 12},226.6 }, {{2010, 3, 15}, 223.84 }, {{2010, 3, 16}, 224.45 }, {{2010, 3, 17},224.12 }, {{2010, 3, 18}, 224.65 }, {{2010, 3, 19}, 222.25 }, {{2010, 3, 22},224.75 }, {{2010, 3, 23}, 228.36 }, {{2010, 3, 24}, 229.37 }, {{2010, 3, 25},226.65 }, {{2010, 3, 26}, 230.9 }, {{2010, 3, 29}, 232.39 }, {{2010, 3, 30},235.85 }, {{2010, 3, 31}, 235. }, {{2010, 4, 1}, 235.97 }, {{2010, 4, 5},238.49 }, {{2010, 4, 6}, 239.54 }, {{2010, 4, 7}, 240.6 }, {{2010, 4, 8},239.95 }, {{2010, 4, 9}, 241.79 }, {{2010, 4, 12}, 242.29 }, {{2010, 4, 13},242.43 }, {{2010, 4, 14}, 245.69 }, {{2010, 4, 15}, 248.92 }, {{2010, 4, 16},247.4 }, {{2010, 4, 19}, 247.07 }, {{2010, 4, 20}, 244.59 }, {{2010, 4, 21},259.22 }, {{2010, 4, 22}, 266.47 }, {{2010, 4, 23}, 270.83 }, {{2010, 4, 26},269.5 }, {{2010, 4, 27}, 26204}, {{2010, 4, 28}, 261.6 }, {{2010, 4, 29},268.64 }, {{2010, 4, 30}, 261.09 }};Get data from the Wolfram Alpha API:wdata WolframAlpha["AAPL from 2010/1/4 to ta", 1}, "TimeSeriesData"}];Backtesting Trading Strategies Using Wolfram Finance PlatformTM 5
Check the dimensionality:Dimensions[#] & /@ {data, wdata}Since the dimensions of the dataset are different, we use TemporalData to synchronize them forcomparison:td TemporalData[{data, wdata}];slices td["SliceData", #]& /@ td["PathTimes", 1]Then we can check if our data is consistent with Wolfram Alpha source data:compare (Round[#[[1]], 0.01] Round[QuantityMagnitude[#[[2]]], 0.01])& /@slices;FreeQ[compare, False]Locate where data is not consistent and remove it:newdata Delete[data, Position[compare, False]]Data Synchronization and CachingSynchronizing the time series is an essential task when simulating strategies on a portfolio of assets.To do this, we use Wolfram Finance Platform functions that manage calendars to create a uniquetimeline, taking into account holidays and business days. We then use this timeline to synchronizethe time series used in the simulation:cacheDates DayRange[cacheFromDate, tillDate, "BusinessDay",CalendarType Ø CALENDARTYPE,HolidayCalendar Ø HOLIDAYCALENDAR,IncludeEndPoints Ø {True,True}];The TemporalData function is another useful tool for managing time stamps. We simply put timestamp value pairs in TemporalData for one or multiple datasets, and its many properties can bequeried for use later on.To avoid having to recalculate every time a simulation is run, all results are stored in binary files ofsynchronized data series. When the dataset is updated with new data, only the last part of the cacheis updated, thus reducing the computational burden.Trading Logic and Portfolio ConstructionAfter data is cleaned and correctly formatted, the next step is to apply trading logic to construct aportfolio, develop trading strategies, and generate buy and sell signals.After developing several strategies, they are mixed into a single portfolio. This is accomplished bywriting money management rules balancing risk and return.6 Backtesting Trading Strategies Using Wolfram Finance PlatformTM
Creating trading strategiesThe high-level language underlying Wolfram Finance Platform provides all the necessary mathematicalfunctions to write trading strategies. Using the different programming paradigms offered by thislanguage, we can write very compact code to generate buy and sell signals. The sample strategybelow generates a matrix of random weights whose columns are assets in the portfolio and whoserows are dates.Using this sample trading strategy, we can generate random positions (-100% or 100%) on thedifferent assets in our investment universe:Options[RandomStrategy] {Inputs - {}, MaxBarsBack - maxBarsBack};RandomStrategy[Universe List, btDates List, opts : OptionsPattern[]] : Module[{inputs, mBarsBack, positions},inputs OptionValue[Inputs];mBarsBack OptionValue[MaxBarsBack];positions {};If[NumberQ[mBarsBack] && CheckInputs[inputs, Universe, btDates, mBarsBack],positions EquiWeightLS[#] & /@ Array[RandomInteger[{-1, 1}] &,{Length[btDates], Length[Universe]}];];Return[positions]];Mixing trading strategiesA money manager function generates a final matrix of weights by mixing the matrices generated byall the strategies. In the sample below we use an equiweighted scheme to mix the strategies into afinal portfolio. Each strategy’s weight is one divided by the number of strategies.Building on the trading strategies, the money manager generates a portfolio resulting from anequiweighted mix of the previously mentioned strategies:Options[EquiWeightLS] {Inputs- {}, MaxBarsBack Ø 21};EquiWeightLS[weights List, opts: OptionsPattern[]] : Module[{expS, expL, newWS,newWL, newW},expS Plus@@Select[weights, # 0&];expL Plus@@Select[weights, # 0&];If[expS ¹ 0,newWS 1/expS //N;,newWS 0.;];If[expL ¹ 0,newWL 1/expL //N;,newWL 0.;];newW If[# 0, newWL, If[# 0, newWS, 0.]]& /@ weights;Return[newW]];Backtesting Trading Strategies Using Wolfram Finance PlatformTM 7
Financial indicators as signals for strategiesWolfram Finance Platform comes with a wide range of financial indicators that can be used as thebasis of any number of trading strategies. There are 98 such indicators all llator, AccelerationBands,AccumulationDistributionLine, AccumulativeSwingIndex,Aroon, AroonOscillator, MovementIndexRating, AverageTrueRange,BollingerBands, ChaikinMoneyFlow, ChaikinOscillator,ChaikinVolatility, ChandeMomentumOscillator, Close,CloseLocationValue, CloseLocationValueVolume, CommodityChannelIndex,CommoditySelectionIndex, DemandIndex, DetrendedPriceOscillator,DirectionalMovement, x, EaseOfMovement, ExponentialMovingAverage,FastStochastic, ForceIndex, ForecastOscillator, FullStochastic,High, HighestHigh, Inertia, IntradayMomentumIndex, KeltnerChannels,KlingerOscillator, LinearRegressionIndicator, LinearRegressionSlope,LinearRegressionTrendlines, Low, LowestLow, MarketFacilitation,MassIndex, MedianPrice, MESAPhase, MESASineWave, Momentum,MoneyFlowIndex, velopes, NegativeVolumeIndex, OnBalanceVolume,Open, ParabolicStopAndReversal, or, Performance, PolarizedFractalEfficiency,PositiveVolumeIndex, PriceChannels, PriceVolumeTrend,ProjectionBands, ProjectionOscillator, QStick, RaffRegressionChannel,RandomWalkIndex, RangeIndicator, RateOfChange, RelativeMomentumIndex,RelativeStrengthIndex, RelativeVolatilityIndex, RSquared,SimpleMovingAverage, SlowStochastic, StandardDeviation,StandardDeviationChannels, StandardError, StandardErrorBands,StochasticMomentumIndex, SwingIndex, TimeSegmentedVolume,TimeSeriesForecast, rage, TRIX, TrueRange, TypicalPrice,UltimateOscillator, VariableMovingAverage, VerticalHorizontalFilter,VolatilitySystem, Volume, VolumeRateOfChange,WeightedClose, WeightedMovingAverage, ion, WilliamsPercentR Default parameter values for an indicator can be alIndicator@BollingerBands, 20, 2DSee the notes section for an interactive example illustrating the default parameter values used byany indicator and how they display for a wide range of securities.Using interoperability to build more complex strategiesWolfram Finance Platform interfaces with other programming languages like C , Java, and R. Forexample, we could write trading rules that reuse some existing R code or existing toolboxes, asdemonstrated in the document titled “Identifying Business Cycles Using RLink in Wolfram FinancePlatform.” The same could be achieved with Java programs. For example, we could access themachine-learning algorithms provided by the Weka toolbox.8 Backtesting Trading Strategies Using Wolfram Finance PlatformTM
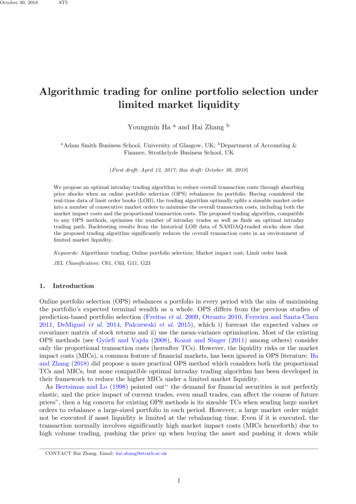
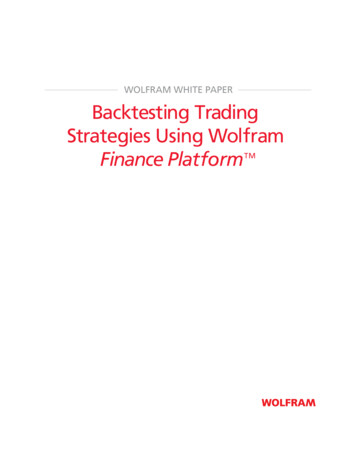
Bringing It All TogetherThe above examples provide high-level structures for constructing trading strategies, but do notaddress how to incorporate such strategies into Finance Platform code for the purposes of backtesting the results. See the notes section for implementation of an example of a BackTestingfunction demonstrated below.Simulating trading results using a trading simulatorApplying trading signals to historical asset prices produces an equity curve representing the evolution of a trading account balance.We can write a generalized trading simulator function that runs the simulation and calculates tradingresults. A possible function signature could be:results TradingSimulator[Universe, BTPeriod, Strategies, "close",FullStrategiesCalculations Ø True,InitialAccountSize Ø PortfolioSize,AccountCurrency Ø PortfolioCurrency,ExecutionPrices Ø "open",ExecutionLag Ø 1,QuantitiesAtExecutionPrice Ø True,AllowNetting Ø False,Fees Ø 0.00,Slippage Ø 0.,StrategiesPerformance Ø strategiesPerformance,FxRates Ø {},MaxBarsBack Ø maxBarsBack,DaysToRefresh Ø daysToRefresh,DataSources Ø DataSeries,DataTransformations Ø DataTransforms,MoneyManagementFunction Ø MoneyManager,MoneyManagementTimeWindow Ø 21,DataCachePath Ø dataCachePathName,InitialStrategyWeights Ø Table[1/Length[Strategies]//N, {Length[Strategies]}]];The following commands plot the equity curve of strategy:{d,s,c,equityCurve} ct Ø {"Portfolio"},ColumnsToExtract Ø {"Equity Curve"}];equityCurve Transpose[{d, equityCurve[[1, 1]]}];DateListPlot[equityCurve, Joined Ø True, PlotLabel Ø StringJoin["EquityCurve - ",s[[1]]]]Backtesting Trading Strategies Using Wolfram Finance PlatformTM 9
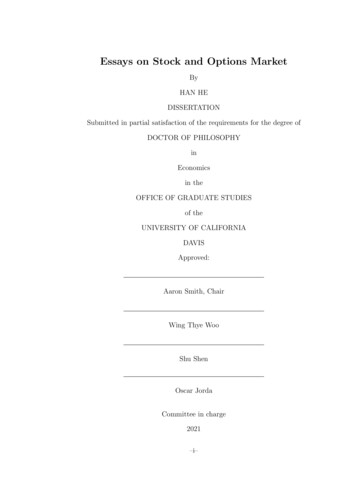
EquityCurve - Portfolio3.5 µ 1083.0 µ 1082.5 µ 1082.0 µ 1081.5 µ 1081.0 µ 1082006200820102012Example of a backtesting functionIn the following examples, we take the example BackTesting function (implemented in the notessection) and introduce some data and a financial indicator or signal, forming the basis of a simpletrading strategy. First, we import daily data for Apple Inc. for the first half of 2010.DataIn[1]: data FinancialData@"AAPL", "OHLCV", 882010, 1, 1 , 82010, 6, 1 D;We consider only the closing values:In[2]: close data@@All, 2, 4DD;SignalWe can use any of Wolfram Finance Platform’s 100 financial indicators as a signal to create thestrategy. These are listed at ndicators.html. Weselect the Exponential Moving Average (EMA) indicator with threshold 0.1:In[3]: sig ExponentialMovingAverage@close, 0.1D;10 Backtesting Trading Strategies Using Wolfram Finance PlatformTM
We plot the closing prices and the EMA indicator and observe that opportunities for trading occurwhere the two curves intersect:ListLinePlot@8close, sig D26025024023022021020019020406080100Modeling and strategyHere we consider a very simple strategy to buy when the closing price surpasses EMA, indicating thatthe current price has become greater than the long-run average:tmp Sign@close - sigD80, 1, - 1, - 1, - 1, - 1, - 1, - 1, - 1, - 1, 1, - 1, - 1, - 1, - 1, - 1, - 1, - 1,- 1, - 1, - 1, - 1, - 1, - 1, - 1, - 1, - 1, - 1, 1, 1, 1, 1, 1, - 1, - 1, 1,1, 1, 1, 1, 1, 1, 1, 1, 1, 1, 1, 1, 1, 1, 1, 1, 1, 1, 1, 1, 1, 1, 1, 1,1, 1, 1, 1, 1, 1, 1, 1, 1, 1, 1, 1, 1, 1, 1, 1, 1, 1, 1, 1, 1, 1, 1, 1,1, - 1, - 1, 1, 1, 1, 1, - 1, - 1, - 1, - 1, - 1, - 1, - 1, - 1, - 1, 1, 1, 1 buypos Position@Partition@tmp, 2, 1D, 8- 1, 1 D8810 , 828 , 835 , 887 , 8100 Then our strategy is to sell when the closing price drops below the EMA, indicating that the currentprice has become less than the long-run average:sellpos Position@Partition@tmp, 2, 1D, 81, - 1 D882 , 811 , 833 , 885 , 891 We now line up the buy positions (1) and sell positions (-1) to correspond to each of the days in thetrading period, and this becomes the strategy we test:strategy PadRight@Normal@SparseArray@Join@Thread@buypos Ø 1D, Thread@sellpos Ø - 1DDDD,Length@tmpD, 0D80, - 1, 0, 0, 0, 0, 0, 0, 0, 1, - 1, 0, 0, 0, 0, 0, 0, 0, 0, 0, 0, 0, 0, 0, 0, 0,0, 1, 0, 0, 0, 0, - 1, 0, 1, 0, 0, 0, 0, 0, 0, 0, 0, 0, 0, 0, 0, 0, 0, 0, 0, 0,0, 0, 0, 0, 0, 0, 0, 0, 0, 0, 0, 0, 0, 0, 0, 0, 0, 0, 0, 0, 0, 0, 0, 0, 0, 0,0, 0, 0, 0, 0, 0, - 1, 0, 1, 0, 0, 0, - 1, 0, 0, 0, 0, 0, 0, 0, 0, 1, 0, 0, 0 Backtesting Trading Strategies Using Wolfram Finance PlatformTM 11
SimulationFinally, we can take the data and the strategy as defined above and indicate which of the two outputoptions we want: either the raw data of buy and sell days and the prices at which the trade takesplace, or the full report output giving the days, prices, equity plot, gross profit and loss, net profit,and current position:BackTesting@data, strategy, Method Ø "RawData"D88882010, 1, 14 , 204.341 , 882010, 1, 15 , 205.143 ,8882010, 2, 10 , 190.509 , 882010, 2, 18 , 196.096 ,8882010, 2, 22 , 196.787 , 882010, 5, 4 , 255.674 ,8882010, 5, 6 , 246.862 , 882010, 5, 12 , 252.128 BackTesting@data, strategy, Method Ø "Report"DEquity plot:number of trades: 8cost per trade: 4.5total transaction costs: 36.largest winning trade: 3062.13largest losing trade: 0gross profits: 3639.5gross loss: 0net profits: 3635.current position:BuyDate82010, 1,82010, 2,82010, 2,82010, 5,14 10 22 6 BuyDateBuyPrice:82010, 5, 25 e82010, 1,82010, 2,82010, 5,82010, 5,15 18 4 12 12 Backtesting Trading Strategies Using Wolfram Finance PlatformTMSellPrice205.143196.096255.674252.128
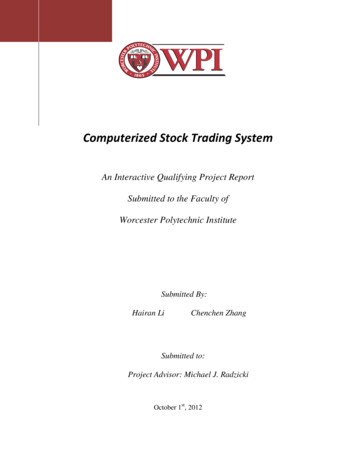
Dynamic simulationWe can generalize this approach to treat many of the variables in the above example as parametersin a Manipulate simulation. Instead of choosing ExponentialMovingAverage as the signal to beused in the strategy, we can use the information obtained from the section “Financial Indicators assignals for strategies” for strategies and choose from a range of averaging financial indicators. Eachaverages over a number of periods in a different fashion. For instance, the indicator“ExponentialMovingAverage” has a smoothing constant of2n 1for n periods. In the following, wecan choose from a wide range of these indicators and dynamically visualize how such indicatorscompare with the closing prices to create possible trading opportunities:With@8indicators 8"SimpleMovingAverage","ExponentialMovingAverage", lMovingAverage", "WeightedMovingAverage","TriangularMovingAverage", "VariableMovingAverage","WildersMovingAverage", "TimeSeriesForecast" ,Manipulate@ListLinePlot@8close,Join@Take@close, Switch@indicator, "VariableMovingAverage",1, "WildersMovingAverage", periods - 1, , 0DD,FinancialIndicator@indicator, periodsD@dataDD D,88periods, 5, "Periods" , 3, 20, 1, Appearance Ø "Labeled" ,88indicator, "SimpleMovingAverage", "Indicator" , indicators,ControlType Ø PopupMenu , SaveDefinitions Ø 023022021020019020406080100Backtesting Trading Strategies Using Wolfram Finance PlatformTM 13
We now put all of the above code together to create an interactive report on choosing differenttrading strategies for different stocks and indices over different time periods:Module@8indicators 8"SimpleMovingAverage","ExponentialMovingAverage", lMovingAverage","WeightedMovingAverage", "TriangularMovingAverage","VariableMovingAverage", "WildersMovingAverage" ,data, close, sig, tmp, buypos, sellpos, strategy ,Manipulate@data FinancialData@dataName, "OHLCV",DatePlus@- NumbOfDaysDD; close data@@All, 2, 4DD;sig Join@Take@close, Switch@indicator, "VariableMovingAverage",1, "WildersMovingAverage", periods - 1, , 0DD,FinancialIndicator@indicator, periodsD@dataDD;tmp Sign@close - sigD; buypos Position@Partition@tmp, 2, 1D, 8- 1, 1 D;sellpos Position@Partition@tmp, 2, 1D, 81, - 1 D;strategy PadRight@Normal@SparseArray@Join@Thread@buypos Ø 1D, Thread@sellpos Ø - 1DDDD, Length@tmpD, 0D;Quiet@BackTesting@data, strategy, "Method" Ø method,"InitialPosition" Ø initPosn, "TransactionCost" Ø transCost,"InitialInvestment" Ø initInvestmentDD,88initPosn, "Short", "Initial Position" ,8"Short", "Long" , ControlType Ø Setter ,88method, "Report", "Method" , 8"Report", "Raw Data" ,ControlType Ø Setter , 88dataName, "AAPL", "Data Name" ,Join@indices, stocksUS, stocksForeignD, ControlType Ø PopupMenu ,88NumbOfDays, 90, "Number of Days" , 60,700, 1, Appearance Ø "Labeled" ,88initInvestment, 10 000, "Initial Investment" ,10 000, 10 6, 1000, Appearance Ø "Labeled" ,88transCost, 4.5, "Transaction Cost" , 1, 5,0.5, Appearance Ø "Labeled" ,88indicator, "ExponentialMovingAverage", "Signal" ,indicators, ControlType Ø PopupMenu ,88periods, 12, "Periods" , 3, 15, 1, Appearance Ø "Labeled" ,ControlPlacement Ø Left, SaveDefinitions Ø TrueDD14 Backtesting Trading Strategies Using Wolfram Finance PlatformTM
Evaluating and analyzing simulation performanceThe final step of the research process is evaluating the performance of our simulation. This is accomplished by studying different statistics and assessing the strategy’s risk and return profile. The fullpower of Finance Platform, with its symbolic and report generation capabilities, simplifies thisprocess.Automatically generating performance reportsUsing Wolfram Finance Platform’s built-in report generation functionality, you can automaticallycreate reports containing interactive charts and dynamic computations. Data for the report cancome from a variety of sources, such as the result of a computation, a database query, FinancePlatform’s integrated computation data source, or a structured dataset. The appearance and style ofthe report is set by a customizable template document with easy-to-configure variables.Automatically generated reports can include built-in interfaces for interactively manipulating dataand can be saved as Computable Document FormatTM (CDF) and shared with anyone using the freeWolfram CDF PlayerTM . Other supported document formats include PDF, HTML, and TeX.Watch the “Generating Finance Reports” overview video for more details at www.wolfram.com/broadcast/video.php?channel 249&video 1502. Report generation examples are available in theWolfram Finance Platform Infokit under Interactive Reports and Apps.Backtesting Trading Strategies Using Wolfram Finance PlatformTM 15
SummaryThe power of backtesting is dependent upon the reliability and uniformity of data, the flexibility ofcomputational tools, and the ease of reporting and analysis. We have shown the agility of WolframFinance Platform in all three areas: first, in providing several methods for obtaining, processing, andsynchronizing data; second, in powerful portfolio construction through interoperability and high-levellanguage; and third, in generating simulations and reports that inform the decision-making processfor developing trading strategies and enabling continued analysis.When every step is streamlined, seamless, and efficient, users such as portfolio managers can focusmore of their time on doing real analysis. Wolfram Finance Platform is a completely integratedsolution that achieves this goal.NotesInteractive example using FinancialIndicatorAs mentioned in our discussion of financial indicators, we can create an interactive example to getthe default parameter values used by any indicator and display results for a wide range of securities:Module@8indic, par1, par2, par3, par4, name ,Manipulate@indic FinancialIndicator@indicatorD;par1 If@Length@indicD 1, indic@@2DD, NullD;par2 If@Length@indicD 2, indic@@3DD, NullD;par3 If@Length@indicD 3, indic@@4DD, NullD;par4 If@Length@indicD 4, indic@@5DD, NullD;name If@MatchQ@FinancialData@DataSymbol, "Name"D, Missing@"NotAvailable"DD, DataSymbol, FinancialData@DataSymbol, "Name"DD;Quiet@TradingChart@8DataSymbol, DatePlus@- NumbOfDaysD ,8FinancialIndicator@indicator, param1, param2, param3, param4D ,PlotLabel Ø Row@8"Last ", NumbOfDays, " days of ", name," with ", indicator, "H", param1, ",", param2, ",",param3, ",", param4, "L" D, ImageSize Ø 8600, 480 DD,88DataSymbol, "SP500", "Data Symbol" , Join@indices,stocksUS, stocksForeignD, ControlType Ø PopupMenu ,88NumbOfDays, 60, "Number of Days" , 2, 720, 1, Appearance Ø "Open" ,88indicator, "MovingAverageConvergenceDivergence", "Indicator" ,FinancialIndicator@AllD, ControlType Ø PopupMenu ,88param1, par1, "Parameter 1" , InputField ,88param2, par2, "Parameter 2" , InputField ,88param3, par3, "Parameter 3" , InputField ,88param4, par4, "Parameter 4" , InputField , SaveDefinitions Ø True,SynchronousUpdating Ø False, ContinuousAction Ø FalseDD16 Backtesting Trading Strategies Using Wolfram Finance PlatformTM
Implementing an example BackTesting functionHere we present some straightforward code implementing the means for any strategy to be input asan argument into a function, allowing us to test the strategy with any given dataset. The codeconsists of one general function, BackTesting, and its options and calls another function,Simulation, with the same arguments that apply the strategy to the given dataset. It then calls yetanother function, BackTestingReport, which generates the final report consisting of the buy andsell data points and the corresponding equity plot. Examples of its application are discussed in thesection Bringing It All Together:In[4]: Options@BackTestingD 8"TransactionCost" Ø 4.5, "InitialInvestment" Ø 10 000 ;BackTesting@d , strategy , o : OptionsPattern@DD : Module@8open, high, low, close, volume, dates, flagTD, bkfun ,dates d@@All, 1DD;8open, high, low, close, volume Transpose@d@@All, 2DDD;Simulation@d, strategy, oDDBacktesting Trading Strategies Using Wolfram Finance PlatformTM 17
In[6]: Options@SimulationD 8"Method" Ø "Report", "InitialPosition" Ø "Short" ;Simulation@rdata , sdata , o : OptionsPattern@DD : Module@8buy, sell, pos, profits, net, method, buydate, selldate,list, commission, principal, security, power, equity, dates,open, high, low, close, volume, max, min, win, los, cur, length ,8method, pos, commission, principal Quiet üOptionValue@8Simulation, BackTesting , Flatten@8o D, 8"Method","InitialPosition", "TransactionCost", "InitialInvestment" D;8dates, open, high, low, close, volume 8rdata@@All, 1DD, rdata@@All, 2, 1DD, rdata@@All, 2, 2DD,rdata@@All, 2, 3DD, rdata@@All, 2, 4DD, rdata@@All, 2, 5DD ;H*initial*Lbuy 0;sell 0;profits 0;list 8 ;net 8 ;security 0;power principal;equity power;max 0;min 0;win 0;los 0;H*testing*Llength Min@Length êü 8rdata, sdata D;MapIndexed@Which@pos "Short",If@Ò 1, buy open@@First@Ò2DDD;buydate dates@@First@Ò2DDD;security If@power 0, Floor@Hpower - commissionL ê buyD, 0D;power Mod@Hpower - commissionL, buyD;equity security * buy power;pos "Long"D,pos "Long",If@Ò - 1,sell open@@First@Ò2DDD;selldate
all the strategies. In the sample below we use an equiweighted scheme to mix the strategies into a final portfolio. Each strategy's weight is one divided by the number of strategies. Building on the trading strategies, the money manager generates a portfolio resulting from an equiweighted mix of the previously mentioned strategies: