Transcription
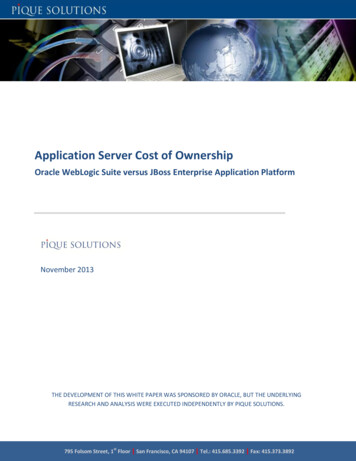
Application Server Cost of OwnershipOracle WebLogic Suite versus JBoss Enterprise Application PlatformNovember 2013THE DEVELOPMENT OF THIS WHITE PAPER WAS SPONSORED BY ORACLE, BUT THE UNDERLYINGRESEARCH AND ANALYSIS WERE EXECUTED INDEPENDENTLY BY PIQUE SOLUTIONS.st795 Folsom Street, 1 Floor San Francisco, CA 94107 Tel.: 415.685.3392 Fax: 415.373.3892
ContentsExecutive Summary . 3Introduction: Complexity and the Application Server Life Cycle . 4A Five-Year Cost of Ownership Comparison . 6Research Methodology . 6Comparing the Cost of the “Core” Application Server Deployment . 7Initial Cost: The Tip of the Iceberg . 9Hardware and Software . 9Installation and Configuration . 10Initial Application Deployment . 10Ongoing Costs: The Real Driver of Cost of Ownership . 11Vendor Support . 12Ongoing Application Deployment . 12Administration and Management . 12Monitoring, Diagnostics and Tuning . 13Responding to Downtime . 13The Major Upgrade . 14Increasing Complexity: The Cost Impact of Data-Intensive and Cloud Scenarios . 15Database Scenario . 15Virtualization and Cloud. 16Conclusion and Key Takeaways . 17Appendix A: Estimating “People Cost”—a Skill-Adjusted Effort . 18Oracle, Java, WebLogic, WebLogic Server and Oracle WebLogic Server are registered trademarks of Oracleand/or its affiliates.JBoss is a registered trademark of Red Hat.Other names may be trademarks of their respective owners. 2013 Pique Solutions. All rights reserved.2
Executive SummaryOpen source application server and middleware vendors perceive software licensing and acquisitioncost as the “root of all evil” in the ownership experience. While their cost of ownership calculatorsaccurately account for software and subscription cost, these partialanalyses address only roughly 20% of the long-term cost of ownership.Labor, or “people cost,” comprises the largest portion of cost of ownershipthrough the application server life cycle. This cost is highly dependent on“Up-front costs are onethe quality of the engineering of the hardware and software solution, thething, but the bulk of costsdepth of integration of the components and the maturity of the tools tomanage ongoing operations. Cost of ownership has never been moreare management labor,important as application server deployments become more complex,administration andrequiring in-memory data grids, database-intensive scenarios,downtime. People think openvirtualization and elastic cloud deployments.Pique Solutions studied both the Oracle WebLogic Suite and JBossEnterprise Application Platform (EAP) to identify the differences in longterm cost of ownership, with particular focus on the long-term applicationserver life cycle. The study involved detailed, activity-based data collectionand in-depth interviews with IT managers, directors and VPs experiencedin buying, implementing, managing and upgrading application serverplatforms. As illustrated in Figure 1, the study results show that: source is free, but you needto look at total cost ofownership.”Principal, Operations and ResourceManagementTechnology ProviderOver five years, JBoss application server deployments withcapabilities including an in-memory data grid are 38% more costlythan those of WebLogic. While WebLogic is more costly initially, the JBoss deploymentbecomes more costly in the second year and each of the subsequent years. The top reasons forthe significant difference in cost are the higher skill levels required, the deeper need forintegration effort and the greater effort required throughout each stage of the five-yearapplication server life cycle. Study participants using JBoss cited a less complete platform andless mature tooling as those for Oracle WebLogic.As the application server environments increase in complexity, the JBoss costs growdisproportionately, as compared to WebLogic. For a scenario with intensive use of Oracledatabases, the JBoss “cost premium” goes up to 49%. For a larger cloud deployment withvirtualization and clustering, the cost premium jumps to 72%.The time and effort for a major release upgrade with JBoss was 48% more than that ofWebLogic because Oracle does a thorough job of engineering backward compatibility andthere is less cost associated with porting or recoding applications from version to version ofthe application server.Figure 1. The Cost Impact of Increasing Application Server Deployment ComplexityJBoss EAP Five-Year Cost Premium over WebLogic Suite80%60%40%20%0%72%38%Core App Server Deployment 2013 Pique Solutions. All rights reserved.49%DatabaseVirtualization & Cloud3
Introduction: Complexity and the Application Server Life CycleA significant portion of cost of ownership is driven by labor costs experienced and accrued through theapplication server life cycle after the initial acquisition of the software. Therefore, it is important tounderstand the key stages of the longer-term application server life cycle, as illustrated in Figure 2. Eachof these stages represents labor, in the form of both time and skill, by numerous teams and individualsin an organization. In an enterprise deployment, this would include developers, system administratorsand operations people.Figure 2. The Application Server Life CycleInstallation &ConfigurationMajor UpgradeIntegration &InfrastructureTestingMonitoring,Diagnostics andTuningApplicationDeploymentManagement &AdministrationIn the past, when application server requirements were more basic, the activities through the life cyclefocused primarily on the basic application server itself. For example, the life-cycle activities for serving apackaged application or a basic Java application were straightforward, with few dependencies andinteractions with other enterprise infrastructure.Application server platforms have evolved over the last several releases to incorporate capabilities thatwere once considered add-ons for more advanced deployments. This is certainly true for the currentreleases of the Oracle WebLogic Suite and JBoss Enterprise Application Platform. These capabilitiesfigure largely in the changing nature of application server deployments, wherein there is deeperinteraction among all elements of the application-to-disk technology stack.As both product capabilities and application server deployments advance, the level of complexityinherently increases. In terms of the nature of application server deployments, three relevant scenariosfor the cost of ownership discussion are illustrated in Figure 3: The “core” application server deployment, which now commonly includes the applicationserver and an in-memory data grid for data-intensive applicationsThe database layer, which refers to the fact that since most applications require a database tokeep persistent data, the ability to take advantage of the native capabilities of the database inan application server is critical 2013 Pique Solutions. All rights reserved.4
Larger private and public cloud deployments, which rely heavily on clustering and virtualizationand are highly elastic so that they can scale up or down as neededFigure 3. Application Server Deployment ScenariosWhile both Oracle and JBoss support those scenarios in customer deployments, the question is howwell they support them and whether the differences in platform architecture, product capability, andmanagement and development tooling result in substantive cost differences throughout the completeapplication server life cycle.It is important to understand the cost of ownership implications as deployments become increasinglycomplex. At the end of the day, the cost profile in the core application server scenario is magnified asmore advanced capabilities are introduced. Even small differences in skill or effort can result insignificant differences in cost as deployments become larger and more complex. 2013 Pique Solutions. All rights reserved.5
A Five-Year Cost of Ownership ComparisonPique Solutions’ approach to cost of ownership highlights major cost areas, focusing on areas wherethere are substantive differences between application server platforms. For cost of ownershipcomparisons, Pique uses a proven framework based on numerous studies in this area. The frameworkincludes key cost categories that are relevant over the life cycle of an application server platformdeployment and that should be considered by executives and IT managers. These categories arepresented in Figure 4. While initial cost is important, it is really just the “tip of the iceberg”: ongoingcosts over the long term are what drive 80% of cost of ownership.Figure 4. Cost of Ownership Analysis ElementsResearch MethodologyThe primary research phase consisted of an in-depth, data-collection and multiphase interview process,which resulted in 10 complete customer data collections. The roles of the interviewees included IT VPs,IT directors, development managers and operations managers. The research process involved an initialscreening to ascertain the interviewees’ usage of the relevant Oracle and JBoss products and ability torespond fully to cost and business value questions. For companies that passed the screening, an initialinterview took place to capture the following data: Company typeApplication server workloadsSize of application server deployments (servers, CPUs, application server instances)Type(s) of development projectsNumber of developers and administrators 2013 Pique Solutions. All rights reserved.6
Following the interview, each company was given a detailed data-collection instrument, whichcontained 70 unique, quantitative data elements along with a provision for qualitative descriptions ofthe responses. The questions and entries spanned the life cycle of the deployment from purchase tomajor upgrade cycle.The companies that were interviewed represented a range of industries, including health care, businessservices, financial services, technology providers, education services, media and telecommunications.The composite profile used for the cost of ownership analysis, based on all of the companiesinterviewed in the study, is provided in Table 1.Table 1. Composite Profile for Cost of Ownership Analysis(average of all study participants)240 physical application servers (hosts)4 CPUs/servers3 application server instances per host20 unique application(s) modules served (custom, packaged, etc.)6,086 total end users of applications9 full-time developers/architects (72% employee vs. contractor)6 full-time administrators (81% employee vs. contractor)Comparing the Cost of the “Core” Application Server DeploymentThis section defines the baseline comparison of cost for the core deployment, including: Application serversJava SE supportManagement toolsIn-memory data gridReal-time environmentThis section analyzes the cost of ownership over five years of two modest-size deployments of fivephysical application servers, with apples-to-apples hardware and software configuration. The servershave two multicore processors and host an average of four virtual application server instances. Table 2outlines the pro forma costs for the deployment scenario for the core application server configurations.The acquisition and ongoing support costs reflect current list prices, less an average discount of 25%,while the people costs for implementation, deployment, testing, administration and management arebased on the primary research data collected. All costs are listed in US dollars.As illustrated in Table 2, Pique research shows that while JBoss initial costs are 22% lower than those ofWebLogic, the overall JBoss cost is 38% higher over five years, driven by the higher cost of ongoingadministration and management, response to downtime and the major upgrade cycle. In fact, JBosscosts are 56% higher for the overall ongoing cost, which comprises 80% of the five-year cost.Table 2. Five-Year Cost SummaryCategoryWebLogic SuiteJBoss EAPDifference as % of WebLogic CostInitial cost 656,247 511,11622% lowerOngoing five-year cost 2,151,560 3,336,91256% higherCost over five years 2,807,807 3,878,028JBoss is 38% higher over five years 2013 Pique Solutions. All rights reserved.7
Figures 5a and 5b show the five-year cost comparison for WebLogic Suite versus JBoss EAP, both interms of the five-year summary and the initial and ongoing costs on an annual basis. While WebLogic ismore costly initially, in the second year the JBoss cumulative cost curve intersects the WebLogic costcurve, and JBoss becomes more costly in each of the subsequent years.Figure 5a. WebLogic Suite vs. JBoss EAP Five-Year Cost SummaryInitial Cost5-Year Ongoing CostWhile WebLogic is morecostly initially, in thesecond year the JBosscumulative cost curveintersects the WebLogiccost curve, and JBossbecomes more costly ineach of the subsequentyears. 4,500,000 4,000,000 3,500,000 3,000,000 2,500,000 3,366,912 2,000,000 1,500,000 2,151,560 1,000,000 500,000 656,247 511,116WebLogic SuiteJBoss EAP 0Figure 5b. Five-Year Cumulative Cost ComparisonWebLogic SuiteJBoss EAP 4,500,000 3,878,028 4,000,000 3,500,000 2,839,400 3,000,000 2,500,000 2,137,395 2,000,000 1,460,627 1,500,000 1,000,000 656,247 500,000 511,116 872,456 2,807,807 2,149,466 1,712,568 1,287,079 807,895 0Initial CostYear 1 (End) 2013 Pique Solutions. All rights reserved.Year 2Year 3Year 4Year 58
Initial Cost: The Tip of the IcebergPerforming an accurate comparison of the initial costs of an application server platform can be achallenging task, but it is crucial to understanding the foundation of total cost. IT professionals choosingan application server platform must do their due diligence, gaining a thorough understanding of what isincluded in each offering and what needs to be added or developed separately to provide similarperformance and functionality. In turn, they also must understand the cost associated with making thepurchased components work together in the initial implementation.As detailed in Figure 6, the initial costs considered in this white paper are: Hardware and softwareInstallation and configuration: the people cost of installing hardware and configuring thesoftware to fit business needsIntegration and infrastructure testing: the people cost of integrating the solution with theexisting systems and architectureInitial application deploymentPeople costs include both internal resources and consultants.Figure 6. Initial Cost Comparison 700,000 600,000 500,000 400,000Initial ApplicationDeployment 98,312 186,221 116,676 9,215Installation &Configuration 300,000 200,000 362,500 100,000Integration &Infrastructure Testing 340,185Hardware & Software 14,255 40,000 0WebLogic SuiteJBoss EAPHardware and SoftwareWebLogic cost is 362,500 vs. 40,000 for JBoss; JBoss is 89% lower.The difference in the cost of hardware and software is based on the fundamental difference in vendorapproach to pricing. WebLogic Suite is most often licensed via a perpetual licensing model based on thenumber of cores. JBoss, on the other hand, does not charge for license fees but rather offers asubscription pricing model based on the number of cores packaged in 16 and 64 core increments. Theinitial cost for the JBoss application server platform is the hardware required. The subscription fees areincluded in vendor support fees. Also included is the license fee for Java SE support as this is generallyrequired to support business-critical applications. 2013 Pique Solutions. All rights reserved.9
Installation and ConfigurationWebLogic cost is 9,215 vs. 14,255 for JBoss; JBoss is 55% higher.For basic installation of the application server, management tools and back-end database connection,study participants found that the cost of JBoss was 26% lower than WebLogic in terms of skill-adjustedeffort. That said, study participants cited a significant difference in the installation of the in-memorydata grid software, with Oracle Coherence taking 51% less time than JBoss Data Grid. In terms ofconfiguration activities, WebLogic required on average 54% to 68% less effort for cluster configuration,cluster domain configuration, policy conformance and virtual instance creation. Scripting/automationtool development was another area that resulted in additional cost for JBoss; administrators spenttriple the time as their WebLogic counterparts on this activity. Lastly, configuration of the in-memorydata grid was also a significant factor in the cost difference, with 55% less effort required for OracleCoherence than for JBoss Data Grid. When an organization runs a data grid on several hundred servers,management is no longer a “nice to have” feature; it becomes critical. Participants cited the CoherenceGUI for significant ease of configuring the clusters and the distributed data grid.Integration and Infrastructure TestingWebLogic cost is 186,221 vs. 340,185 for JBoss; JBoss is 83% higher.Integration and infrastructure testing were areas that studyparticipants cited as a significant difference in terms of effort andcost when comparing WebLogic to JBoss. While the effort requiredfor infrastructure testing was pretty even, there was a very large“We find JBoss verydifference in the level of effort and skill required for integrationchallenging to integrate withactivities. WebLogic participants required 28% less time on averageour core infrastructure andfor integration with other middleware components and 58% lesstime for integration with existing infrastructure and applications.applications, most of whichThey pointed out that because Oracle provides an alreadyare not open source.”integrated platform and management, less time is required forprovisioning and integration, whereas JBoss relies on many openManager, ITsource and other third-party components. The average skill levelTelecommunications Firmfor these activities was 0.9 for WebLogic and 1.17 for JBoss.Overall, the result was over 49% less cost for WebLogic. An ITmanager for a telecommunications company related, “Unless weare talking about light workloads where there is integration to other open source tools, we find JBossvery challenging to integrate with our core infrastructure and applications, most of which are not opensource.”Initial Application DeploymentWebLogic cost is 98,312 vs. 116,676 for JBoss; JBoss is 19% higher.The cost of application deployment includes both developer and administrator time for deployingapplications to production environments. While deployment is a straightforward activity with justdevelopment and production environments, the activity becomes more complex as environments fortesting and staging are added. Also, the tiers of the deployment, including the applications, databases,data grids and web servers, also add complexity. A lot of automation is possible in Oracle deploymentbecause of tools and prebuilt virtual machine templates, which contain certified installations for theautomatic building of application assemblies. Study participants indicated fairly similar effort and cost 2013 Pique Solutions. All rights reserved.10
for developers deploying applications on the two platforms butidentified significant time savings for administrators in deployingapplications. On average, study participants cited a savings of over30% because of the WebLogic tools, which they found easy to useand which offer a high degree of automation. According to a directorof IT for a health care company, “WebLogic allows us to simplify andautomate pretty much everything we need to do, specificallyapplication deployment.”“WebLogic allows us tosimplify and automatepretty much everything weneed to do, specificallyapplication deployment.”Ongoing Costs: The Real Driver of Cost of OwnershipDirector, ITOngoing costs are the recurring costs associated with the applicationHealth Care Companyserver platform, including the annual support fees paid to thevendor and the people cost over each of the five years considered inthe cost of ownership analysis. In other words, ongoing costs includeall of the costs after the initial purchase and implementation through the fifth year. Ongoing costs areless obvious because they are not explicit cost items in the capital expense (CAPEX) statement.However, they constitute the bulk of the total cost of ownership. These costs, listed in Table 3, include: Vendor support feesApplication deploymentAdministration and managementPerformance monitoring, diagnostics and tuningResponding to downtimeMajor upgradeTable 3. Ongoing CostsCategoryWebLogic SuiteJBoss EAPDifference as % ofWebLogic CostVendor support fees 495,000 276,75044% lowerApplication deployment 393,246 466,70419% higherAdministration and management 460,462 1,194,199159% higherPerformance monitoring,diagnostics and tuning 545,407 980,75880% higherResponding to downtime 47,980 138,376188% higherMajor upgrade 209,465 310,12548% higherCost over five years 2,151,560 3,366,912JBoss cost is 56%higher over five yearsAs Table 3 shows, JBoss costs are lower for the vendor support fees but are significantly higher in eachof the other ongoing cost categories. That is primarily due to JBoss’s lack of comprehensive andautomated management tools for configuration, patch automation, monitoring, diagnostics, and tuning.The result is a 56% higher ongoing cost for JBoss over five years, or over 1.2 million, based on thisdeployment of application servers and in-memory data grid. 2013 Pique Solutions. All rights reserved.11
Vendor SupportWebLogic cost is 495,000 vs. 276,750 for JBoss; JBoss is 44% lower over five years.These costs for Oracle WebLogic are calculated based on the software license, with Oracle charging anannual support fee of 22% of software list price to provide product updates/upgrades, vendor supportand premium access to support content. JBoss vendor support fees are the annual subscription fees forthe right to use the software and support from Red Hat. These fees are based on the number of cores inthe deployment and include both the JBoss Enterprise Application Platform and JBoss Data Grid. Inaddition, the cost of support for JBoss also included the ongoing support cost for Java SE. Based on thesize of the deployment, JBoss vendor support fees are 44% lower than WebLogic over five years.Ongoing Application DeploymentWebLogic cost is 393,246 vs. 466,704 for JBoss; JBoss is 19% higher over five years.Similar to the initial cost analysis, there is an ongoing cost component for deploying applicationsincluding both developers and administrators. The cost savings delta is the same with JBoss 19% higherin years 2 through 5 due primarily to the difference in effort and cost for administrator involvement inapplication deployment. JBoss study participants cited the need to develop and manage scripts overtime versus the more automated nature of activities for their WebLogic counterparts. Further, theaverage skill factor for administrators’ role in application deployment was 0.9 for WebLogic vs. 1.1 forJBoss.Administration and ManagementWebLogic cost is 460,462 vs. 1,194,199 for JBoss; JBoss is 159% higher over five years.This was an area of significant depth in the study and also an area where there was a considerabledifference between WebLogic and JBoss. Study participants provided timeand effort data for 20 activities related to the application servers and inmemory data grid servers. There was a considerable advantage forWebLogic, with a 44% lower cost for the application server and a 63%“The management andlower cost for in-memory data grid management. The common factor wasadministration area fundamental difference in the tooling between environments: Oracleprovides a much more complete management capability, including crosssignificantly higher for JBosstier management, through Oracle Enterprise Manager. In contrast, JBossdue to less maturity of themanagement requires more extensive manual work, resulting insignificant human capital and time costs.platform and the tooling.”An IT manager for a telecommunications firm said, “The management andManager, ITadministration are significantly higher for JBoss due to less maturity of theTelecommunications Firmplatform and the tooling.” Finally, study participants cited a big differencein the skill level required in the JBoss environment. They found it mucheasier overall to do activities in WebLogic, without having to develop scripts to perform administration.In rating the overall skill factor required for application server activities, participants gave WebLogic anaverage of 0.71 on a scale of 0.5 to 1.5, compared to a rating of 1.23 for JBoss. Minor upgrades andpatching were two activities noted as being very easy to do in WebLogic, each with a skill index rating of0.6. An IT director for a health care provider said, “Enterprise Manager is a single product that managesthe database, middleware and apps all in one place. Each of our administrators is able to manage allaspects of the deployment versus having specialized skills for different pieces of our infrastructure.” 2013 Pique Solutions. All rights reserved.12
Monitoring, Diagnostics and TuningWebLogic cost is 545,407 vs. 980,758 for JBoss; JBoss is 80% higher over five years.This was another area of extensive data collection; between the application server and the in-memorydata grid, 12 activities were evaluated. Again, the data from the respondents suggested a significantadvantage for WebLogic versus JBoss, particularly when it comes to the in-memory data grid. WhileWebLogic required on average 20% less effort for the application server, that difference grows to 61%for monitoring, diagnostics and tuning for the in-memory data grid. The single largest area of differencewas in the area of diagnosing performance problems and determining where the performancebottleneck lies. JBoss respondents indicated they spent on average 18 hours per month on this activitywhile their WebLogic counterparts spent only 4.4 hours. For the WebLogic participants, this savings wasattributed largely to advanced tooling such as Oracle JRockit Mission Control system, Java VirtualMachine Diagnostics (JVM Diagnostics), WebLogic Operations Control, and the Oracle Process Managerand Notification server (OPMN), which enabled them to automate diagnostics, memory leak detectionand notification. They liked that Oracle JVM Diagnostics can detect and diagnose Java-related problemsand bottlenecks without any instrumentation, while JBoss’s Java Diagnostics requires elaborate bytecode instrumentation (BCI), resulting in significant effort to resolve problems and adding the risk ofadditional downtime due to inserting diagnostics code into user applications in production.Responding to DowntimeWebLogic cost is 47,980 vs. 138,376 for JBoss; JBoss is 188% higher over five years.In addition to routine administration activities, the Pique study also explored the impact of unplanneddowntime. Considering that the deployments in the study were relatively advanced—nearly all involvedclustering and failover—downtime rarely caused prolonged end-user outages. Rather, the cost ofownership impact involved the response required by administrators to resolve major and minordowntime-related incidents in the application server deployments. As shown in Figure 7, the resultsindicate that WebLogic has fewer major and minor incidents and the effort required to resolve anyincidents is lower. In the JBoss environment, the higher frequency of incidents plus the greater amountof time required to resolve them, multiplied by the number of administrators involved in resolution,results in a cost impact for JBoss that is nearly three times higher than that of WebLogic. A vicepresident of engineering, global operations and infrastructure for an education services provider toldus, “When downtime-related issues arise in our JBoss deployment, it takes our admin team longer toidentify the root cause and reach resolution. In many cases, the lack of comprehensive tooling is abarrier.”Figure 7. Responding to DowntimeWebLogic86.5663.242JBoss14.41.61.12.10Avg #/monthAvg resolution effortMajor Incidents
Administration and Management . People think open source is free, but you need to look at total cost of ownership." Principal, Operations and Resource Management in Technology Provider Executive Summary Open source application server and middleware vendors perceive software licensing and acquisition cost as the "root of all evil" in the ownership experience. While their cost of .