Transcription
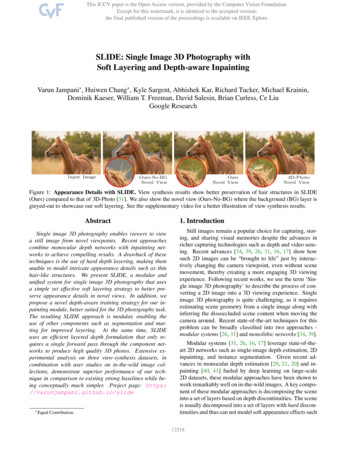
Principals and Elements of Image Interpretation1
Fundamentals of PhotographicInterpretation Observation and inference depend oninterpreter’s training, experience, bias,natural visual and analytical abilities. Human visual or manual interpretation is stilla dominant approach to day-to-dayapplications of remote sensing. Observation and understanding of the basicelements of photo interpretation are critical.Why photo/image interpretation? Aerial/Regional Perspective:– Examination of the Earth from an aerialperspective allows us to identify objects,patterns, and man-land interrelationships.– Remotely sensed image provides “spatialterrain” information.2
Why photo/image interpretation? The ability to obtain a historical image record todocument change:– The photographs or images are valuable historicalrecords of the spatial distribution of natural and manmade phenomena.– The study of change increases our understandingabout the natural and human-induced processes inthe landscape.Why photo/image interpretation? Three-Dimensional Depth Perception:– We can obtain a 3-dimensional view of the terrain byviewing the two images of the terrain from two slightlydifferent vantage points at the same time.– Stereoscopic analysis process provides us theinformation of object’s height, depth, and volume.3
Deriving Information from DataHeads-up digitizingDigital image classifications– Unsupervised– Supervised4
Digital Image Classification?Information Extraction from Pixels5
Principals and Elements ofVisual Image InterpretationFundamentals of PhotographicInterpretationPhoto Interpretation:The examination of aerial photographs/images forthe purpose of identifying objects and judging theirsignificance.Observation & Inference:Observation provides the raw data for interpretation.Inference is the logical process by which observationand interpretation are made.6
Photo interpretation – Observation - InferenceWhere to draw the line?7
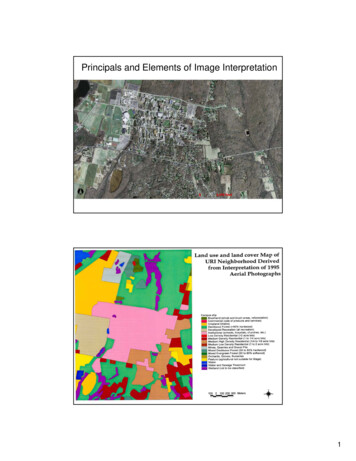
Image interpretation for Land Use MappingUSGS Land Use and Land CoverClassification SystemAnderson, J. R., E. E. Hardy, and J. T. Roach,1976. A Land Use and Land Cover ClassificationSystem for Use with Remote Sensor Data,Washington, DC: U.S. Geological SurveyProfession Paper 964, 28 pp.8
USGS Land Use and Land CoverClassification SystemLevel I1 Urban or built-uplandLevel II11 Residential12 Commercial and Services13 Industrial14 Transportation, Communications,and Utilities15 Industrial and CommercialComplexes16 Mixed urban or Built-up land17 Other Urban or Built-up LandUSGS Land Use and Land CoverClassification SystemLevel ILevel II2 Agricultural land 21 Cropland and pasture22 Orchards, groves, vineyards,nurseries, and ornamentalhorticultural areas23 Confined feeding operations24 Other agricultural land9
USGS Land Use and Land CoverClassification SystemLevel I3 Rangeland4 Forest landLevel II31 Herbaceous rangeland32 Shrub and brush rangeland33 Mixed rangeland41 Deciduous forest land42 Evergreen forest land43 Mixed forest landUSGS Land Use and Land CoverClassification SystemLevel I5 Water6 WetlandLevel II51 Streams and canals52 Lakes53 Reservoirs54 Bays and estuaries61 Forested wetland62 Nonforested wetland10
USGS Land Use and Land CoverClassification SystemLevel I7 Barren landLevel II71 Dry salt flats72 Beaches73 Sandy areas other thanbeaches74 Bare exposed rock75 Strip mines, Quarries, andgravel pits76 Transitional areas77 Mixed barren landExample of Sub-categorization ofResidential Land (Level III)Level ILevel IILevel III1. Urban or Built-up 1.1. Residential 1.1.1. Single-family Units1.1.2. Multi-family Units1.1.3. Group Quarters1.1.4. Residential Hotels1.1.5. Mobile Home Parks1.1.6. Transient Lodgings1.1.7. Other11
Representative Image InterpretationFormats for Various Land Use/Land CoverClassification LevelsLand Use/LandCover ClassificationLevelIIIIIIIVRepresentative Format for ImageInterpretationLow to moderate resolution satellitedata (e.g., Landsat MSS)Small-scale aerial photographs;moderate resolution satellite data (e.g.,Landsat TM)Medium-scale aerial photographs; highresolution satellite data (e.g., IKONOS)Large-scale aerial photographs(USGS Level II)12
(USGS Level I)13
Elements of Image Interpretation x,y LocationSizeShapeShadowTone/ColorTexture Pattern Height/Depth Site (elevation, slope,aspect) Situation AssociationElements of Image InterpretationElementx,y locationSizeShapeCommon Adjectives(Quantitative and qualitative)x,y coordinate: longitude and latitude or meterseasting and northing in a UTM map gridLength, width, perimeter, area (m2)small, medium (intermediate), largeAn object’s geometric characteristics: linear,curvilinear, circular, elliptical, radial, square,rectangular, triangular, hexagonal, pentagonal,star, amorphous, etc.14
Elements of Image nCommon Adjectives(Quantitative and qualitative)Caused by solar illumination from the sideGray tone: light (bright), intermediate (gray),dark (black)Color: HIS intensity, hue (color), saturation;RGB red, green, blue; MunselCharacteristic placement of objects on theground: systematic, random, linear, curvilinear,rectangular, circular, etc.Spatial arrangement of objects on the ground:systematic, random, linear, curvilinear,rectangular, circular, etc.Elements of Image ctSite/situation/associationCommon Adjectives(Quantitative and qualitative)z-elevation (height), depth (bathymetry),volume (m3), slope o, aspect oSite: elevation, slope, aspect, exposure,adjacency to water, transportation, utilitiesSituation: objects are placed in a particularorder or orientation relative to one anotherAssociation: related phenomena are usuallypresent15
The size of an object is one of the most distinguishingcharacteristics and one of the most important elementsof image interpretation.Many natural and man-made features on the groundhave very unique shapes that can be referenced inphoto and image interpretation.The electromagnetic radiation (EMR) recorded byremote sensing system can be displayed in shades ofgray ranging from black to white – tone.We may use additive color-combining techniques tocreate color composite images.Gray TonePseudo Color Image16
Texture is the characteristic placement and arrangementof repetitions of tones or color in an image.Pattern is the spatial arrangement of objects in thelandscape.Both texture and pattern are scale independent.TexturePatternThe shadow in the image provides real clue to anobject’s identification, e.g., height.The ability to visually appreciate or measure theheight (elevation) or depth (bathymetry) of an objector landform is one of the most diagnostic elements ofimage interpretation.17
Site, situation, and association characteristics arevery important when trying to identify an object oractivity. They are always used together.Site:- physical (elevation, slope,aspect, type of surface cover)- socioeconomic (value of theland, adjacency to water)Situation:How objects are organized andoriented relative to one another.Association:When you find a certain activityor phenomena, you almostinvariably encounter related orassociated features or activities.On-line reviewRIGIS land use/land cover map datahttp://www.edc.uri.edu/rigis/18
RIGIS Land Use Land Cover Map DataLand use/land cover from1987 aerial photographycoded to Andersonmodified level 3 with ½acre minimum polygonresolution.1995 Land use/land coverupdated using 1987 landuse as a base.Where to draw the line?19
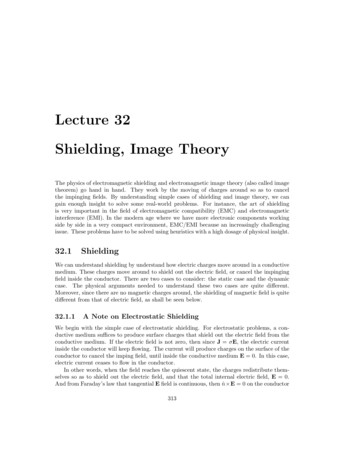
Delineation of polygonsand placement of labelsBAA: Error in matching boundariesB: Error in labeling parcels20
The Photo-OverlayLeft: aerial photographRight: land cover boundaries as interpreted fromthe photographs; numbers corresponded toAnderson Level II classification system.The delineation of a land use polygon includes the entirearea devoted to a particular use. In this example the entirearea inside the boundaries of an airfield is represented onthe land use map as a single polygon, even though it iscomposed of several recognizable components.21
22
Land-Use Map The use of land by humans,usually with emphasis onthe functional role of land ineconomic activities Land use forms anabstraction, not alwaysdirectly observable even bya closest inspection ABSTRACTLand-Cover Map Designates the visibleevidence of land usefeatures. Directly observablephysical or biophysicalcover on the earth’ssurface CONCRETEThe definition establishes a direct link between landcover and the actions of people in their environment.23
An Example of Land-Use Map vs. Extracted Impervious Surface WaterWetlandOpenlandUrban GrassQuonsetStateAirportNarragansett BayAn Example of Land-Use Map vs. Extracted Impervious Surface WaterWetlandOpenlandUrban Grass24
Use of color as symbols for land useclasses by USGS system Level ICategoryUrban/Built-up LandAgricultural LandRangelandForest LandWaterWetlandBarren LandTundraPerennial Snow or IceSymbol123456789ColorRedLight BrownLight OrangeGreenDark BlueLight BlueGrayGreen-GrayWhite25
From oblique aerial photographto measurable information?26
Human visual or manual interpretation is still a dominant approach to day-to-day applications of remote sensing. Observation and understanding of the basic elements of photo interpretation are critical. Why photo/image interpretation? Aerial/Region