Transcription
Introduction to Structural EquationModeling Using StataChuck HuberStataCorpchuber@stata.comUniversity College LondonOctober 16, 2019
Outline What is structural equation modeling?Structural equation modeling in StataContinuous outcome models using semMultilevel generalized models using gsemDemonstrations and Questions
What is Structural Equation Modeling? Brief historyPath diagramsKey concepts, jargon and assumptionsAssessing model fitThe process of SEM
Brief History of SEM Factor analysis had its roots in psychology.– Charles Spearman (1904) is credited with developing the common factormodel. He proposed that correlations between tests of mental abilitiescould be explained by a common factor representing ability.– In the 1930s, L. L. Thurston, who was also active in psychometrics,presented work on multiple factor models. He disagreed with the idea of aone general intelligence factor underlying all test scores. He also used anoblique rotation, allowing the factors to be correlated.– In 1956, T.W. Anderson and H. Rubin discussed testing in factor analysis,and Jöreskog (1969) introduced confirmatory factor analysis andestimation via maximum likelihood estimation, allowing for testing ofhypothesis about the number of factors and how they relate to observedvariables.
Brief History of SEM Path analysis and systems of simultaneous equationsdeveloped in genetics, econometrics, and latersociology.– Sewall Wright, a geneticist, is credited with developing path analysis. Hisfirst paper using this method was published in 1918 where he looked atgenetic causes related to bone sizes in rabbits. Rather than estimating onlythe correlation between variables, he created path diagrams to thatshowed presumed causal paths between variables. He compared what thecorrelations should be if the variables had the presumed relationships tothe observed correlations to evaluate his assumptions.– In the 1930s, 1940s, and 1950s, many economists including Haavelmo(1943) and Koopmans (1945) worked with systems of simultaneousequations. Economists also introduced a variety of estimation methodsand investigated identification issues.– In the 1960, sociologists including Blalock and Duncan applied pathanalysis to their research.
Brief History of SEM In the early 1970s, these two methods merged.– Hauser and Goldberger (1971) worked on including unobservables intopath models.– Jöreskog (1973) developed a general model for fitting systems of linearequations and for including latent variables. He also developed themethodology for fitting these models using maximum likelihood estimationand created the program LISREL.– Keesling (1972) and Wiley (1973) also worked with the general frameworkcombining the two methods. Much work has been done since then in to extend thesemodels, to evaluate identification, to test model fit, andmore.
What is Structural Equation Modeling? Structural equation modeling encompasses abroad array of models from linear regression tomeasurement models to simultaneous equations. Structural equation modeling is not just anestimation method for a particular model. Structural equation modeling is a way of thinking,a way of writing, and a way of estimating.-Stata SEM Manual, pg 2
What is Structural Equation Modeling? SEM is a class of statistical techniques that allows us to testhypotheses about relationships among variables. SEM may also be referred to as Analysis of CovarianceStructures. SEM fits models using the observed covariancesand, possibly, means. SEM encompasses other statistical methods such ascorrelation, linear regression, and factor analysis. SEM is a multivariate technique that allows us to estimate asystem of equations. Variables in these equations may bemeasured with error. There may be variables in the modelthat cannot be measured directly.
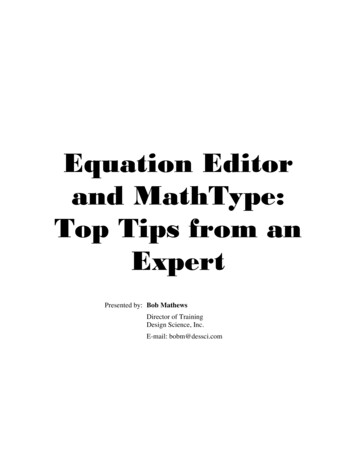
Structural Equation Models areoften drawn as Path Diagrams:
Jargon Observed and Latent variablesPaths and CovarianceEndogenous and Exogenous variablesRecursive and Nonrecursive models
Observed and Latent Variables Observed variables are variablesthat are included in our dataset.They are represented by rectangles.The variables satv, satq, and hsgpaare observed variables in this pathdiagram. Latent variables are unobservedvariables that we wish we hadobserved. They can be thought of asthe underlying cause of theobserved variables. They arerepresented by ovals. The variableAptitude is a latent variable in thispath diagram.
Paths and Covariance Paths are direct relationships between variables. Estimated pathcoefficients are analogous to regression coefficients. They arerepresented by straight arrows. Covariance specify that two latent variables or error termscovary. They are represented by curved arrows.
Exogenous and Endogenous Variables Exogenous variables are determined outside the system ofequations. There are no paths pointing to it. The variables satv,satq, hsgpa, and credithrs are exogenous. Endogenous variables are determined by the system ofequations. At least one path points to it. The variablesscholarships and fygpa are endogenous.
Observed Exogenous: a variable in a datasetthat is treated as exogenous in the model Latent Exogenous: an unobserved variablethat is treated as exogenous in the model. Observed Endogenous: a variable in a datasetthat is treated as endogenous in the model Latent Endogenous: an unobserved variablethat is treated as endogenous in the model.
Recursive and Nonrecursive Systems Recursive models do not have any feedback loops or correlatederrors. Nonrecursive models have feedback loops or correlated errors.These models have paths in both directions between one ormore pairs of endogenous variables
Notation Observed endogenous: yObserved exogenous: xLatent endogenous: ηLatent exogenous: ξError of observed endogenous: e.yError of latent endogenous: e.ηAll endogenous: Y y ηAll exogenous: X x ξAll error: e.y e.η
𝑌 𝐵𝑌 Γ𝑋 𝛼 𝜁We estimate: The coefficients B and 𝚪The intercepts, 𝜶The means of the exogenous variables 𝜿 𝐸(𝑿)The variances and covariances of the exogenousvariables, 𝜱 𝑉𝑎𝑟(𝑿) The variances and covariances of the errors 𝚿 𝑉𝑎𝑟(𝜻)
Assumptions Large Sample Size Multivariate Normality Correct Model Specification
Assumptions Large Sample Size– ML estimation relies on asymptotics, and large samplesizes are needed to obtain reliable parameter estimates.– Different suggestions regarding appropriate sample sizehave been given by different authors.– A common rule of thumb is to have a sample size of morethan 200, although sometimes 100 is seen as adequate.– Other authors propose sample sizes relative to the numberof parameters being estimated. Ratios of observations tofree parameters from 5:1 up to 20:1 have been proposed.
Assumptions Multivariate Normality– The likelihood that is maximized when fittingstructural equation models using ML is derivedunder the assumption that the observed variablesfollow a multivariate normal distribution.– The assumption of multivariate normality canoften be relaxed, particularly for exogenousvariables.
Assumptions Correct Model Specification– SEM assumes that no relevant variables are omittedfrom any equation in the model.– Omitted variable bias can arise in linear regression ifan independent variable is omitted from the modeland the omitted variable is correlated with otherindependent variables.– When fitting structural equation models with ML andall equations are fit jointly, errors can occur inequations other than the one with the omittedvariable.
What is Structural Equation Modeling? Brief historyPath diagramsKey concepts, jargon and assumptionsAssessing model fitThe process of SEM
Assessing Model Goodness of Fit Model Definitions– The Saturated Model assumes that all variablesare correlated.– The Baseline Model assumes that no variablesare correlated (except for observed exogenousvariables when endogenous variables arepresent).– The Specified Model is the model that we fit
Likelihood Ratio 𝜒 2 (baseline vs saturated models)2𝜒𝑏𝑠 2 𝑙𝑜𝑔 𝐿𝑠 𝑙𝑜𝑔𝐿𝑏Likelihood Ratio 𝜒 2 (specified vs saturated models)2𝜒𝑚𝑠 2 𝑙𝑜𝑔 𝐿𝑠 𝑙𝑜𝑔𝐿𝑚where:𝐿𝑏 is the loglikelihood for the baseline model𝐿𝑠 is the loglikelihood for the saturated model𝐿𝑚 is the loglikelihood for the specified model𝑑𝑓𝑏𝑠 𝑑𝑓𝑠 𝑑𝑓𝑏𝑑𝑓𝑚𝑠 𝑑𝑓𝑠 𝑑𝑓𝑚
Assessing Model Goodness of Fit 2 )Likelihood Ratio Chi-squared Test (𝜒𝑚𝑠Akaike’s Information Criterion (AIC)Swartz’s Bayesian Information Criterion (BIC)Coefficient of Determination (𝑅2 )Root Mean Square Error of Approximation (RMSEA)Comparative Fit Index (CFI)Tucker-Lewis Index (TLI)Standardized Root Mean Square Residual (SRMR)Satorra-Bentler adjustmentSee also: http://davidakenny.net/cm/fit.htm
Assessing Model Goodness of FitLikelihood Ratio 𝜒 2 (baseline vs saturated models)2𝜒𝑏𝑠 2 𝑙𝑜𝑔 𝐿𝑠 𝑙𝑜𝑔𝐿𝑏where:𝐿𝑠 is the loglikelihood for the saturated model𝐿𝑚 is the loglikelihood for the specified model𝑑𝑓𝑚𝑠 𝑑𝑓𝑠 𝑑𝑓𝑚Good fit indicated by: p-value 0.05
Assessing Model Goodness of FitAkaike’s Information Criterion (AIC)AIC 2 𝑙𝑜𝑔 𝐿𝑚 2𝑑𝑓𝑚Swartz’s Bayesian Information Criterion (BIC)BIC 2 𝑙𝑜𝑔 𝐿𝑚 ln(𝑁)𝑑𝑓𝑚Good fit indicated by: Used for comparing two models Smaller (in absolute value) is better
Assessing Model Goodness of FitCoefficient of Determination (𝑅2 ) 𝑑𝑒𝑡Ψ2𝑅 1 𝑑𝑒𝑡 Σ Good fit indicated by: Values closer to 1 indicate good fit
Assessing Model Goodness of Fit Root Mean Square Error of Approximation Compares the current model with the saturated model The null hypothesis is that the model fits𝑅𝑀𝑆𝐸𝐴 2𝜒𝑚𝑠 𝑑𝑓𝑚𝑠𝑁 1 𝑑𝑓𝑚𝑠Good fit indicated by: Hu and Bentler (1999): RMSEA 0.06 Browne and Cudeck (1993) Good Fit (RMSEA 0.05) Adequate Fit (RMSEA between 0.05 and 0.08) Poor Fit (RMSEA 0.1) P-value 0.05
Assessing Model Goodness of Fit Comparative Fit Index (CFI) Compares the current model with the baseline model2𝜒𝑚𝑠 𝑑𝑓𝑚𝑠𝐶𝐹𝐼 1 2𝜒𝑏𝑠 𝑑𝑓𝑏𝑠Good fit indicated by: CFI 0.95 (sometimes 0.90)
Assessing Model Goodness of FitTucker-Lewis Index (TLI) Compares the current model with the baseline model2 Τ2 Τ𝜒𝑏𝑠𝑑𝑓𝑏𝑠 𝜒𝑚𝑠𝑑𝑓𝑚𝑠𝑇𝐿𝐼 1 2 Τ𝜒𝑏𝑠𝑑𝑓𝑏𝑠 1Good fit indicated by: TLI 0.95
Assessing Model Goodness of FitStandardized Root Mean Square Residual (SRMR) SRMR is a measure of the average difference betweenthe observed and model implied correlations. This willbe close to 0 when the model fits well. Hu and Bentler(1999) suggest values close to .08 or below.Good fit indicated by: SRMR 0.08
The Process of SEM Specify the modelFit the modelEvaluate the modelModify the modelInterpret and report the results
Outline What is structural equation modeling?Structural equation modeling in StataContinuous outcome models using semMultilevel generalized models using gsemDemonstrations and Questions
Structural Equation Modeling in Stata Getting your data into StataThe SEM BuilderThe sem syntaxThe gsem syntaxDifferences between sem and gsem
Getting Data Into Stata Can import data using– insheet– infile– import excel Can open observation level data with use Can open summary data with ssd
Getting Data Into Stataclearssd init fygpa grants scholarships stipendssd set obs100ssd set means 2.406.43ssd set .85\1.54/////////Note that we will not be able to use gsem with summary data
Getting Data Into Stata. ssd listObservations .85Variances implicitly defined; they are the diagonal ofthe covariance shipsstipend90.99-8.984.0193.29.251.54
Structural Equation Modeling in Stata Getting your data into StataThe SEM BuilderThe sem syntaxThe gsem syntaxDifferences between sem and gsem
We can draw path diagrams using Stata’s SEM BuilderChange to generalized SEMSelect (S)Add Observed Variable (O)Add Generalized Response Variable (G)Add Latent Variable (L)Add Multilevel Latent Variable (U)Add Path (P)Add Covariance (C)Add Measurement Component (M)Add Observed Variables Set (Shift O)Add Latent Variables Set (Shift L)Add Regression Component (R)Add Text (T)Add Area (A)
Drawing variables in Stata’s SEM BuilderObserved continuous variable (SEM and GSEM)Observed generalized response variable (GSEM only)Latent variable (SEM and GSEM)Multilevel latent variable (GSEM only)
We can draw path diagrams using Stata’s SEM Builder
Structural Equation Modeling in Stata Getting your data into StataThe SEM BuilderThe sem syntaxThe gsem syntaxDifferences between sem and gsem
sem syntaxsem paths [if] [in] [weight] [, options] Paths are specified in parentheses and correspondto the arrows in the path diagrams we sawpreviously. Arrows can point in either direction. Paths can be specified individually, or multiplepaths can be specified within a single set ofparentheses.
sem syntax examplessemsemsemsem(y - x1 x2 x3)(x1 x2 x3 - y)(y - x1) (y - x2) (y - x3)(x1 - y) (x2 - y) (x3 - y)
sem syntax examplessem (L1 - x1 x2 x3), latent(L1)sem (x1 x2 x3 - L1), latent(L1)sem (L1 - x1) (L1 - x2) (L1 - x3), latent(L1)
sem syntax examplessem (L1 - x1 x2 x3) (L2 - x4 x5 x6), standardizedsem (L1 - x1@1 x2 x3) (L2 - x4@1 x5 x6)sem (L1 - x1@a x2 x3) (L2 - x4@a x5 x6)sem (latent1 - x1 x2 x3) (latent2 - x4 x5 x6), ///latent(latent1 latent2) nocapslatentsem (L1 - x1 x2 x3) (L2 - x4 x5 x6), group(female)
Structural Equation Modeling in Stata Getting your data into StataThe SEM BuilderThe sem syntaxThe gsem syntaxDifferences between sem and gsem
gsem syntax examplesgsem (y - x1 x2 x3, family(bernoulli) link(logit))gsem (y - x1 x2 x3, logit)
Families and Link PoissonDnegative normalD
gsem syntax examplesgsem(y - x1 x2 x3)(y - M1[classroom]),latent(M1)//////
gsem syntax examplesgsem(M1[classroom] - x1 x2 x3)(Student - x1 x2 x3),latent(Student M1)//////
gsem syntax examplesgsem (M1[classroom] - x1 x2 x3, family(poisson) link(log)) ///(Student - x1 x2 x3, family(poisson) link(log)),///latent(Student M1)
Structural Equation Modeling in Stata Getting your data into StataThe SEM BuilderThe sem syntaxThe gsem syntaxDifferences between sem and gsem
Differences Between sem and gsem sem features not available with gsem:– Estimation methods MLMV and ADF– Fitting models with summary statistics data (SSD)– Specialized syntax for multiple-group models– Satorra-Bentler adjustment– estat commands for goodness of fit, indirecteffects, modification indices, and covarianceresiduals
Differences Between sem and gsem gsem features not available with sem:– Generalized-linear response variables– Multilevel models– Factor-variable notation may be used– Equation-wise deletion of observations withmissing values– contrast, and pwcompare command may be usedafter gsem
Differences Between sem and gsem You may obtain different likelihood values whenfitting the same model with sem and gsem.– The likelihood for sem is derived including estimation ofthe means, variances, and covariances of the observedexogenous variables.– The likelihood for the model fit by gsem is derived asconditional on the values of the observed exogenousvariables.– Normality of observed exogenous variables is neverassumed with gsem.
Outline What is structural equation modeling?Structural equation modeling in StataContinuous outcome models using semMultilevel generalized models using gsemDemonstrations and Questions
Continuous Outcome Models Using sem Example DataMeansCorrelationLinear RegressionMultivariate RegressionPath Analysis and MediationConfirmatory Factor Analysis (CFA)Structural Equation Models (SEM)Multi-group SEMSEM For Complex Survey Data
Example Data. use cair.dta, clear(Example data for the California Association for Institutional Research Workshop). describestoragedisplayvaluevariable nametypeformatlabelvariable tification Numberuniversitybyte%9.0gUniversity IDcollegebyte%11.0gcollegePrimary college of majorprivatebyte%9.0gprivatePrivate or public university?fygpadouble %4.2fFirst-year GPAret yr1byte%8.0gYesNo* First-year retentioninstatebyte%12.0ginstate * In state residencymalebyte%8.0gmaleMalegreekbyte%8.0gYesNo* Member of a Greek societywithdrawndouble %3.0f* Credits withdrawn or incompletecredithrsdouble %3.0f* Average number of credits hoursattempted per termptindexdouble %3.0f* % courses taken in 1st year frompart time facultygrantsdouble %5.1f* Grant money (x1000 dollars)scholarshipsdouble %5.1f* Scholarship money (x1000 dollars)stipenddouble %5.1f* Student work income (x1000 dollars)* indicated variables have ------------------------------------Sorted by: id
Example Data. summarizeVariable ObsMeanStd. Dev.MinMax------------- -----id 129586479.53740.797112958university 1295810.459565.735442120college 129583.0520911.49568715private 12958.4972218.500011601fygpa 128752.398844.727457704------------- -----ret yr1 12958.8924217.309859101instate 12958.730977.443469101male 12958.4069301.491280601greek 12958.2218707.415520601withdrawn 129473.86495110.266190100------------- -----credithrs 1294715.623931.025208924ptindex 1294744.085118.115520100grants 129586.3999589.520231049.558scholarships 129585.3195979.637058069.288stipend 12958.84260651.237821010.79976
Example Data. notes dtadta:1. Data from Bryce Mason at UC Riverside2. Data set of new freshmen (starting college) across a number of years at amid-sized, private, moderately selective university3. It focuses only on the first year of enrollment and first-year retention (orGPA) as the outcome of interest. notes ret yr1ret yr1:1. So-called first-year retention. Measures whether the student was enrolled inthe fall term of what would have been their second year of studies
Example Datahistogram fygpa, title(Histogram of First Year GPA)
Example Datagraph pie, over(ret yr1)///plabel( all percent, size(large))///title(Proportion of Students Enrolled For Year 2)
Example Datagraph box fygpa, over(ret yr1)///title(First Year GPA by Enrollment Status for Year 2)
Example Datatwoway (scatter fygpa grants),///title(First Year GPA by Grant Money Received)
Example Datagraph matrix grants scholarships stipend,///title(Scatterplot Matrix of Financial Aid Variables)
Continuous Outcome Models Using sem Example DataMeansCorrelationLinear RegressionMultivariate RegressionPath Analysis and MediationConfirmatory Factor Analysis (CFA)Structural Equation Models (SEM)Multi-group SEMSEM For Complex Survey Data
Sample Mean Path Diagram
Sample Mean SyntaxSyntax using mean:mean fygpaSyntax using sem:sem fygpa
Sample Mean ResultsResults using means:Mean estimationNumber of obsMeanfygpa2.398844 12875Std. Err.[95% Conf. Interval].00641112.3862772.411411Results using sem:Coef.OIMStd. 0065951LR test of model vs. saturated: chi2(0)z374.18 P z [95% Conf. Interval]0.0002.3862792.411409.516384.5422390.00, Prob chi2 .
Continuous Outcome Models Using sem Example DataMeansCorrelationLinear RegressionMultivariate RegressionPath Analysis and MediationConfirmatory Factor Analysis (CFA)Structural Equation Models (SEM)Multi-group SEMSEM For Complex Survey Data
Correlation Path Diagram
Correlation SyntaxSyntax using correlate:correlate grants scholarships stipendSyntax using sem:sem grants scholarships stipend, standardized
Correlation ResultsResults using correlate:grants schola 00.0225stipend1.0000Results using sem:StandardizedCoef.OIMStd. Err.z[95% Conf. 913384.5704982.6998528.mean(grants)mean(scholars 4303.0097496var(grants)var(scholarsh rants,scholarships)cov(grants,stipend)cov(scholars s,stipend)LR test of model vs. saturated: chi2(0)69.1258.5469.82P z 0.00, Prob chi2 .
Continuous Outcome Models Using sem Example DataMeansCorrelationLinear RegressionMultivariate RegressionPath Analysis and MediationConfirmatory Factor Analysis (CFA)Structural Equation Models (SEM)Multi-group SEMSEM For Complex Survey Data
Linear Regression Path Diagram
Linear Regression SyntaxSyntax using regress:regress fygpa grants scholarships stipendSyntax using sem:sem fygpa - grants scholarships stipend
Linear Regression ResultsResults using 03563.0072665.044392.345305Std. 257.98P t 0.0000.0000.0000.000[95% Conf. 1.0085657.0550942.363125Results using sem:Coef.Structuralfygpa grantsscholarshipsstipendconsvar(e.fygpa)OIMStd. 02P z 0.0000.0000.0000.000[95% Conf. 4.0085653.05509132.36312.5081189.5335601
Continuous Outcome Models Using sem Example DataMeansCorrelationLinear RegressionMultivariate RegressionPath Analysis and MediationConfirmatory Factor Analysis (CFA)Structural Equation Models (SEM)Multi-group SEMSEM For Complex Survey Data
Multivariate Regression Path Diagram
Multivariate Regression SyntaxSyntax using mvreg:mvreg grants scholarships satv satq hsgpaSyntax using sem:sem (grants scholarships - satv satq hsgpa),cov(e.scholarships*e.grants)///sem (grants - satv satq hsgpa)(scholarships - satv satq hsgpa),cov(e.scholarships*e.grants)//////
Multivariate Regression ResultsResults using mvreg:Coef.Std. Err.tP t [95% Conf. 52-.33280864.72363.4690524.3619666.07415485.226942
Multivariate Regression ResultsResults using sem:Coef.OIMStd. Err.zP z [95% Conf. Interval]Structuralgrants .218951.1398329.1696499.29570676.716182scholars s e.scholar 7.8151842-10.55633-7.360866-10.990.000
Continuous Outcome Models Using sem Example DataMeansCorrelationLinear RegressionMultivariate RegressionPath Analysis and MediationConfirmatory Factor Analysis (CFA)Structural Equation Models (SEM)Multi-group SEMSEM For Complex Survey Data
Path Analysis Diagram
Path Analysis Resultssem (fygpa - hsgpa scholarships) (scholarships - hsgpa)Coef.OIMStd. Err.zP z [95% Conf. Interval]Structuralfygpa ars s 7695var(e.fygpa)var(e.scholar s)
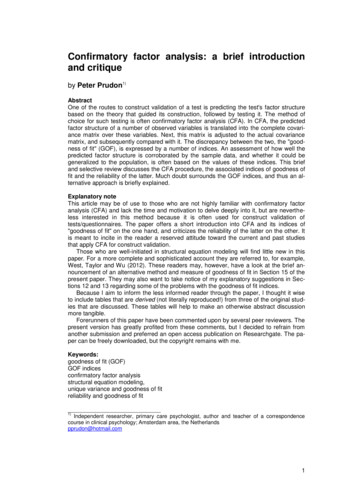
Mediation AnalysisTotal Effect (c) of highschool GPA on first year GPAIndirect Effect (a & b) of highschool GPA on first year GPAthrough the mediator scholarshipsDirect Effect (c’) of highschool GPA on first year GPA′𝑐 𝑐 𝑎𝑏
estat teffects, compactDirect effectsCoef.OIMStd. Err.zP z [95% Conf. Interval]Structuralfygpa scholars s rect effectsCoef.OIMStd. Err.zP z [95% Conf. Interval]Structuralfygpa olars s -Total effectsCoef.OIMStd. Err.zP z [95% Conf. Interval]Structuralfygpa scholars s hsgpa.099537.08390231.190.235-.0649085.2639826
Continuous Outcome Models Using sem Example DataMeansCorrelationLinear RegressionMultivariate RegressionPath Analysis and MediationConfirmatory Factor Analysis (CFA)Structural Equation Models (SEM)Multi-group SEMSEM For Complex Survey Data
Confirmatory Factory Analysis Path Diagram
Confirmatory Factory Analysis Path Diagramsem (Aptitude - satv satq hsgpa), latent(Aptitude)Coef.OIMStd. Err.zP z [95% Conf. ).0093794122.02LR test of model vs. saturated: chi2(0) 0.00, Prob chi2 .
Confirmatory Factory Analysis Path Diagramsem (Funding - grants c@1 scholarships c stipend c) ///(Aptitude - satv@1 satq hsgpa),///latent(Funding Aptitude)///cov( Funding*Aptitude)
Coef.OIMStd. Err.Measurementgrants c Fundingcons1.002366scholars c Fundingcons1.250233-.009954.0223636.0087752stipend c Fundingcons.8652328-.0112386.0152112.0089581satv Aptitudecons11.170703satq Aptitudecons.9835765.8074195.0161097.0090827hsgpa rants c)var(e.scholar c)var(e.stipend 7P z [95% Conf. 9.626878-.0165213.0067381LR test of model vs. saturated: chi2(8)-0.82 0.4105.16, Prob chi2 0.7408
Continuous Outcome Models Using sem Example DataMeansCorrelationLinear RegressionMultivariate RegressionPath Analysis and MediationConfirmatory Factor Analysis (CFA)Structural Equation Models (SEM)Multi-group SEMSEM For Complex Survey Data
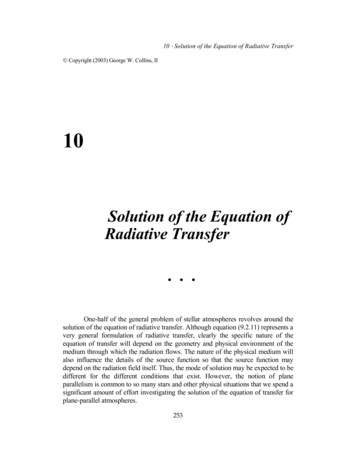
Structural Equation Model Path Diagramsem (Funding - grants c@1 scholarships c stipend c) ///(Aptitude - satv@1 satq hsgpa)///(Funding Aptitude - fygpa),///latent(Funding Aptitude)
Structural Equation Model Path Diagramsem (Funding - grants c@1 scholarships c stipend c)(Aptitude - satv@1 satq hsgpa)(Funding Aptitude - fygpa)(instate male credithrs ptindex - fygpa),latent(Funding Aptitude)////////////
Structural Equation ModelsGetting complex models to converge can sometimes be challenging.It may help to fit the full model in stages using the results of eachsimpler model as the starting values for more complex models:sem (Funding - grants c@1 scholarships c stipend c)(Aptitude - satv@1 satq hsgpa)(Funding Aptitude - fygpa),latent(Funding Aptitude)/////////matrix b e(b)sem (Funding - grants c@1 scholarships c stipend c)(Aptitude - satv@1 satq hsgpa)(Funding Aptitude - fygpa)(instate male credithrs ptindex - fygpa),latent(Funding Aptitude)from(b)///////////////
Structural Equation Models. estat gof, stats(all)Fit statisticValueDescriptionLikelihood ratiochi2 ms(28)p chi2chi2 bs(49)p chi2411.4570.00022294.0010.000Population errorRMSEA90% CI, lower boundupper boundpclose0.0330.0300.0351.000Information criteriaAICBIC410228.932410490.138Baseline comparisonCFITLI0.9830.970Comparative fit indexTucker-Lewis indexSize of residualsSRMRCD0.0130.961Standardized root mean squared residualCoefficient of determinationmodel vs. saturatedbaseline vs. saturatedRoot mean squared error of approximationProbability RMSEA 0.05Akaike's information criterionBayesian information criterionThe goodness of fit statistics indicate that our models fits well
Structural Equation Models. estat residuals, format(%4.1f)Residuals of observed variablesMean 00.00.00.00.0Covariance residualsgrants cscholarshi cstipend csatvsatqhsgpafygpainstatemalecredithrsptindexThe residuals are small or zero
. estat mindicesModification in
Outline What is structural equation modeling? Structural equation modeling in Stata Continuous outcome models using sem Multilevel generalized models using gsem Demonstrations and Questions