Transcription
WORKBOOKMAP Growth Basics
KEY CHARACTERISTICSMAP Growth assessments dynamically measure what students know and inform what they’re readyto learn next. These personalized assessments:Measure growth over time Are given three to four times each year Use an equal-interval scale Provide growth projections for goal settingAdapt to each student Offer unique, appropriately challenging tests for each student Are not limited by grade level Provide real-time interactive reportsInform instruction Connect to skills and concepts likely within students’ zones of proximal development Identify areas of strength and possible areas of focus Support planning for differentiation and scaffolding for access and extensionSupport continuous improvement Present data at the student, class, grade, or district level Provide projections aligned with state assessments Provide projections related to college and career readiness 2021 NWEA. NWEA and MAP are registered trademarks, and MAP Growth is a trademark,of NWEA in the US and in other countries.MAP Growth Basics 2
MAP Growth BasicsGet ready for a successful implementation, gain a solid understanding of what makes MAP Growth unique,and dive into resources that can help inform the process. Learn how to administer the assessments andbegin to understand the importance of engaging students and leveraging data to inform instruction.Table of contents4 What Are the Purpose and Value of the MAP Growth Assessments?5 How Do the MAP Growth Assessments Work?6 What Does MAP Growth Tell Me About My Primary Students?9 What Does MAP Growth Tell Me About My Students?13 How Do We Prepare for and Administer the MAP Growth Assessments?16 What Resources Are Available to Help With MAP Growth?19 Planning Forward20 Key Ideas and Takeaways21 Normative Data ChartsResourcesMAP Growth Basics Padlet MAP reports siteNormative dataMAP Growth Reports PortfolioNWEA Professional Learning OnlineMAP Help Center Quick ReferencesTeach. Learn. Grow. blogNWEA.org 2021 NWEA. NWEA and MAP are registered trademarks, and MAP Growth is a trademark,of NWEA in the US and in other countries.MAP Growth Basics 3
What Are the Purpose and Value of theMAP Growth Assessments?If you were riding an elevator with someone unfamiliar with MAP Growth, how might you explain itspurpose and value? Formulating an elevator speech helps you confidently explain MAP Growth tocolleagues, students, and families.What keywords or ideas are most important in understanding MAP Growth assessments and data?KEYWORD OR IDEA #1KEYWORD OR IDEA #2KEYWORD OR IDEA #3KEYWORD OR IDEA #4Write a short paragraph connecting two or more big ideas to help synthesize your understandingof MAP Growth.YOUR ELEVATOR SPEECH 2021 NWEA. NWEA and MAP are registered trademarks, and MAP Growth is a trademark,of NWEA in the US and in other countries.MAP Growth Basics 4
How Do the MAP Growth Assessments Work?Practice setting up, administering, and taking a MAP Growth assessment.With a partner, decide who will begin as the proctor and who will begin as the student. You’ll need twoseparate devices.Setting up testing: Basic proctor steps1. On your device, log in to the MAP reports site using the sample username and password yourNWEA Professional Learning Consultant provided.2. Select Manage Test Sessions. Choose Help in the top-right menu. These instructions walk youthrough testing.3. With your partner, view the proctor videos Proctor Quick Start and Set Up Testing Session.4. Return to the MAP reports site. Create a test session by choosing Manage Test Sessions and thenTest My Class. You’ll have two students.5. Give the test session name and password to your student partner.6. Practice pausing and ending the test.Taking the test: Student experience1. Access the student login screen. Disable any pop-up blocker software tools before you begin. Note: Students can access the MAP Growth Practice Test questions here.2. Enter the test session name and password your partner or NWEA Professional Learning Consultantprovides and select the blue button with the arrow.3. Choose your sample student name and test from the drop-down lists. Select the blue button withthe arrow.4. Confirm that your information is correct by choosing the blue Yes button and wait for the proctor toconfirm your information. After it is confirmed, select the blue button with the arrow to proceed.5. Start the test. Select the blue button with the arrow (at the bottom) after answering each question.OBSERVATIONS AND NOTES 2021 NWEA. NWEA and MAP are registered trademarks, and MAP Growth is a trademark,of NWEA in the US and in other countries.MAP Growth Basics 5
What Does MAP Growth Tell Me About MyPrimary Students?Learn more about the Screening, Skills Checklist, and MAP Growth assessments and what you can learnabout your students.Making Connections Worksheet for MAP Growth K–2SCREENINGSKILLS CHECKLISTMAP GROWTHDescriptionYNYNYNInstructional levelor diagnostic?ILDILDILDNormative data?YNYNYNAdaptive?Tests availableScoresAudienceTesting intervalsHow can I use these? 2021 NWEA. NWEA and MAP are registered trademarks, and MAP Growth is a trademark,of NWEA in the US and in other countries.MAP Growth Basics 6
WHAT DOES MAP GROWTH TELL ME ABOUT MY PRIMARY STUDENTS?, CONTINUEDAs you read the scenario below and complete the associated activities, you’ll learn more about theScreening, Skills Checklist, and MAP Growth assessments.After each part, record any questions or notes on the Making Connections Worksheet for MAP Growth K–2on page 6.SAMPLE STUDENTGRADE LEVELSUBJECTScenario Part 1: Screeningis a student in your class. Since starting kindergarten, your student has taken the threedifferent types of MAP Growth K–2 assessments—Screening, Skills Checklist, and Growth—that make upthe MAP Growth assessment system in Reading and Math.In kindergarten, your student took two MAP Growth K–2 assessments: The Screening: Reading Early Literacy, which assesses a student’s abilities related to rhyming, letteridentification, and concepts of print The Screening: Mathematics Early Numeracy, which assesses a student’s ability to count, identifynumbers, and do basic computationsIn these tests, how the student responds to an initial set of questions determines the level of difficulty forthe next set of questions.Refer to the MAP Growth K–2 Student report for Screening: Reading Early Literacy in the MAP GrowthReports Portfolio.1. Locate your student’s MAP Growth K–2 Screening:Reading Early Literacy report. How did your studentANSWERSperform on the Visual Discrimination/Phonics portionof the assessment?2. In looking at your student’s screening assessment,what inferences can you make that would helpANSWERSyou design instruction to meet your student’sindividual needs? 2021 NWEA. NWEA and MAP are registered trademarks, and MAP Growth is a trademark,of NWEA in the US and in other countries.MAP Growth Basics 7
WHAT DOES MAP GROWTH TELL ME ABOUT MY PRIMARY STUDENTS?, CONTINUEDScenario Part 2: Skills ChecklistThis year, your student has taken several of the 10 Reading and 28 Math SkillsChecklist assessments.You use these tests throughout the school year, as often as needed, withindividual students, small instructional groups, or your whole class wheneveryou need additional information about students’ progress. The Reading SkillsChecklist assessments randomly present all the test questions to each student,A list of the SkillsChecklist tests isavailable underEarly Learning TestSelection on the MAPHelp Center QuickReferences website.but the Math Computation Skills Checklist assessments end after the first 10questions if the student has not answered 60% or more correctly.You decide to assign the same test to all of your students as a pretest. Every student takes a ReadingSkills Checklist test called Reading Decoding Patterns-Word Families. Select Early Learning Test Selectionon the MAP Help Center Quick References website to see a list of the Skills Checklist tests.Refer to the MAP Growth K–2 Student Report: Screening and Skills Checklist in the MAP GrowthReports Portfolio.3. What information about your students1. What percentage of the word families didcan these assessments provide that youyour student know?presently lack?2. As the teacher, how could you use thisinformation to plan instruction foryour student?Scenario Part 3: MAP Growth K–2Continue exploring the MAP Growth K–2 assessments on the following pages, as time allows.Use the MAP Growth K–2 Class Profile report and Class Breakdown reports in the MAP Growth ReportsPortfolio to complete the additional scenarios. 2021 NWEA. NWEA and MAP are registered trademarks, and MAP Growth is a trademark,of NWEA in the US and in other countries.MAP Growth Basics 8
What Does MAP Growth Tell Me AboutMy Students?Learn more about the data MAP Growth provides and what you can learn about your students.Making Connections Worksheet for MAP GrowthAdaptive assessmentYOUR QUESTIONS AND NOTES Adapts to a student’s current level based onthe student’s responses to each question Gives accurate data for students at all levelsof achievementRIT scoreYOUR QUESTIONS AND NOTES Is on an equal-interval scale to measure growth Is not tied to grade level Correlates to skills the student is likely readyto learnNormative dataYOUR QUESTIONS AND NOTES Identifies typical (average) scores for each gradelevel, subject, and seasonInstructional levelYOUR QUESTIONS AND NOTES Indicates what students are ready to learn Provides a road map for students towardachieving mastery 2021 NWEA. NWEA and MAP are registered trademarks, and MAP Growth is a trademark,of NWEA in the US and in other countries.MAP Growth Basics 9
WHAT DOES MAP GROWTH TELL ME ABOUT MY STUDENTS?, CONTINUEDAs you read the scenario below and complete the associated activities, you’ll learn more about theMAP Growth assessments.After each part, record any questions or notes on the Making Connections Worksheet for MAP Growth onpage 9.Scenario Part 1: Class Profile Report Test DetailsYour class is taking computer-adaptive assessments called MAP Growth to measure their academic growthand find their level of instructional readiness. They may take the assessment up to four times per year.The Test Details tab on the Class Profile report provides information about your class’s most recent testevent.Refer to the Class Profile report in your MAP Growth Reports Portfolio.1. What kinds of information are available on the Test Details tab?2. How will your school decide when a studentshould retest?The Rapid Guessing Percentile identifies wherestudents progressed through a question muchmore quickly than is typical. The Class Profilereport identifies any students whose resultsindicate that they may have been guessing enoughto impact their score. 2021 NWEA. NWEA and MAP are registered trademarks, and MAP Growth is a trademark,of NWEA in the US and in other countries.MAP Growth Basics 10
WHAT DOES MAP GROWTH TELL ME ABOUT MY STUDENTS?, CONTINUEDScenario Part 2: Class Profile Achievement DetailsThe MAP Growth assessment determines which questions to ask each student based on their answers toprevious questions. If they answer a question correctly, the test then asks them a more difficult question.Likewise, if a student answers a question incorrectly, they receive an easier question next time. Aftercompleting the assessment, each student receives an overall RIT score for the subject in which theywere tested.The Achievement Details tab of the Class Profile report provides information about how your studentsperformed on each MAP Growth assessment.1. What is the national average RIT score forthis grade level and subject?The national average, the Norm Grade Level MeanRIT, is the RIT score for the subject, season, andgrade level. See Normative Data Charts on page 21of this workbook for norm grade-level mean scoresfor all grades, subjects, and test seasons.2. How does your class average compare tothe national average?Comparing a class average to the national averageprovides context about the overall achievement ofthe class.3. What does the Achievement Percentiles chart tell you about this group of students? 2021 NWEA. NWEA and MAP are registered trademarks, and MAP Growth is a trademark,of NWEA in the US and in other countries.MAP Growth Basics 11
WHAT DOES MAP GROWTH TELL ME ABOUT MY STUDENTS?, CONTINUEDScenario Part 3: Student ProfileThe Student Details section of the Class Profile report provides information for each student in the classwho has completed the test. Select a column header to sort students alphabetically, by overall RIT score,or by instructional area.Select the name of a student to open their Student Profile, which provides more detailed informationabout the student. The Student Profile provides data about the student’s achievement, growth,comparison to others, projected growth, and possible areas of instructional strength and areas of focus.1. In the Comparisons section, what is thestudent’s achievement percentile?2. Does the Instructional Areas sectionThe achievement percentile compares this studentto other students in the same subject and gradelevel using NWEA national norms.If a student has an instructional area scoresignificantly higher than the overall RIT score, thatidentify areas of strength or focus forarea is identified as an area of strength. If an area isthe student?significantly lower, it’s identified as an area of focus.3. In the Growth Goals section, what is thestudent’s projected RIT growth?Projected growth is based on the average RITgrowth shown by other students in the samegrade level and subject and with the samestarting RIT score. 2021 NWEA. NWEA and MAP are registered trademarks, and MAP Growth is a trademark,of NWEA in the US and in other countries.MAP Growth Basics 12
How Do We Prepare for and Administer the MAPGrowth Assessments?Before giving the MAP Growth assessments, prepare students, teachers, and proctors so they know whatto expect. Clarify the tasks each person will complete before, during, and after testing.Preparing studentsVisit Student Resources to find resources that youcan share with students to help them understandthe following:Discuss with colleagues: Common student questions anddiscussion points How the test works Your experience taking the test Which tools are available within the test How you plan to use the data with students Why it’s important to take their time and dotheir bestHere are a few common student questions and possible responses: What are MAP Growth tests?MAP Growth assessments are achievement tests in Math, Reading, Language Usage, and Science, takenon a computer. How do these tests work?The computer displays one test question at a time on the screen. You select an answer using the mouseor the keyboard. The difficulty of each test adjusts based on how you perform on the questions thatyou answer. Your test is unique, built just for you. Why are we taking MAP Growth?The MAP Growth assessments show me your performance so I can better know what you are ready tolearn in class. They also help me understand which areas need improvement.Communicating with students and familiesWhat do theyWho will communicateHow will it beneed to know?the information?communicated?When? 2021 NWEA. NWEA and MAP are registered trademarks, and MAP Growth is a trademark,of NWEA in the US and in other countries.MAP Growth Basics 13
HOW DO WE PREPARE FOR AND ADMINISTER THE MAP GROWTH ASSESSMENTS?, CONTINUEDPreparing proctorsFrom the MAP Help Center, select Proctor Quick Start to explore the video tutorials and guidance documents.Follow these steps for a successful testing experience.Before the testing session Understand MAP Growth Determine steps for troubleshooting workstationproblems when issues arise Understand the testing process Create and modify student profiles if necessary (the Data Guide students through the MAP Growth Practice Test Gather materials for the testing environmentAdministrator imports the profiles) List of any student accommodations Access and confirm the test schedule and location(s);many schools use portable devices in classrooms Scratch paper and pencils Headphones for any MAP Growth K–2 students Check headphones and headphone volume as needed Collaborate with teaching staff to identify and prepareaccommodations for students with special needs Access Testing Tips (a script to read to students) on theProctor Quick Start page Create test sessions for students and assign Develop a process for providing feedback to theselected testsAssessment Coordinator and/or School AdministratorDuring the testing session Read the directions to students before instructing Pause, suspend, or terminate tests if neededthem to begin Invalidate tests if needed Monitor student behavior and testing progress inthe MAP systemAfter the testing session Prepare computers for the next group to test: close theNWEA Secure Testing App screen if there will be morethan a few minutes between testing sessions (if not,refresh the NWEA Secure Testing App screen) Determine which students need to be scheduled formakeup tests and inform the classroom instructor whenthat will occurAfter testing day Give makeup tests as soon as possible (tests must be After the testing window closes, communicatecompleted within the testing window) Communicate any testing issues or scheduling concerns tothe School Administrator and/or Assessment Coordinatorany procedural recommendations to the SchoolAdministrator and/or Assessment Coordinator to informthe next testing window 2021 NWEA. NWEA and MAP are registered trademarks, and MAP Growth is a trademark,of NWEA in the US and in other countries.MAP Growth Basics 14
HOW DO WE PREPARE FOR AND ADMINISTER THE MAP GROWTH ASSESSMENTS?, CONTINUEDPreparing teachersFrom the MAP Help Center, select Proctor Quick Start to explore the video tutorials and guidance documents.Follow these steps for a successful testing experience.Before the testing session Understand MAP Growth Prepare accommodations for students with special needs Develop a working definition of the RIT scale Have students access the MAP Growth Practice Testand what it means Understand the concept of instructionallevel versus mastery Receive an initial login to the MAP reports site Talk with students about MAP Growth;set clear expectations Determine seating assignments for the test Plan for communicating with families and students Have students bring a book or an assignment to work onin case they finish early Reinforce expectations for the testing environment Ensure that students understand the importanceof taking time to fully read and understand eachquestion before answeringDuring the testing session Remind students not to begin until instructed Remain in the testing session to monitor students Encourage students to take their time and use scratchpaper if necessary Alert the proctor to any issuesAfter the testing session Debrief the testing experience with students Celebrate successes Work with the proctor to ensure that absent studentsand those who did not complete the test in thescheduled time have adequate time to complete testing Note how you’ll improve the process next timeAfter testing day Assess reports immediately Create a plan to collaborate with colleagues Check reports to verify that all students Learn how to access additional resourceshave a valid score Analyze report data: class and student Discuss scores with individual students and families Use data to plan instruction; implement necessaryinstructional modifications Learn how to determine growth projections Work with the district MAP Growth Leadership Teamto assess the testing process (strengths, changes,and next steps) Communicate professional learning needsto the Administrator 2021 NWEA. NWEA and MAP are registered trademarks, and MAP Growth is a trademark,of NWEA in the US and in other countries.MAP Growth Basics 15
What Resources Are Available to Help WithMAP Growth?Explore and consider possible uses for the MAP reports site, Help Center, and reports.MAP reports site and Help CenterLog in to the MAP reports site with the username and password you received (passwords are casesensitive). If you don’t have a username and password, use the sample one provided for you.On the homepage, explore the following and note what you find: What’s new in MAP Suite? (select linked image) Quick References—links to resources such as: Early Learning Test Selection (MAP Growth K–2) Assessment Coordination GuideSelect Help in the upper-right corner to explore the following: Video Tutorials Report Details What’s New Type “parent guidance” in the search boxList the three most important resources you found:Class Profile reportHow might we use this report?The Class Profile report is a great place to startwhen you want to look at the academic diversity inyour class and plan for instruction.1. From the left navigation menu on the MAPreports site, select View Reports, then MAPGrowth Reports. Choose Class Profile report.2. Use the options at the top of the screen to selectthe Class, Subject, and Course. 2021 NWEA. NWEA and MAP are registered trademarks, and MAP Growth is a trademark,of NWEA in the US and in other countries.MAP Growth Basics 16
WHAT RESOURCES ARE AVAILABLE TO HELP WITH MAP GROWTH?, CONTINUEDClass Breakdown reportsThe Class Breakdown reports give you a visual representation of the academic diversity of your class.1. Go back to MAP Growth Reports and selectClass Breakdown by RIT, Instructional Area, orHow does this report differ from the ClassProjected Proficiency.Profile report? How might we use this report?2. Select Term Rostered, Term Tested, School,Instructor, and Class from the drop-down lists,if applicable.3. Under Report Options, choose Class Breakdownby RIT, then select View Report Online.This generates a report that shows studentsseparated by 10-point RIT bands in eachsubject tested.4. Choose Math: K–12 in the Subject column. Noticethat the title at the top of the page changes toClass Breakdown by Instructional Area.Learning ContinuumThe Learning Continuum describes skills and concepts connected to the content of your state standardsthrough the NWEA Instructional Areas.1. Go back to MAP Growth Reports and selectLearning Continuum. This is an interactive reportThe Class View groups students by RIT bandswith two views—Class View and Test View.of 10 to show the skills and concepts likely2. Take some time to explore both the Class Viewand the Test View reports.3. Learn more about the Learning Continuum: From within the Learning Continuum, selectHelp in the upper-right corner to access itsinformation page in the MAP Help Center. Explore the descriptions, display options,frequently asked questions, and relatedresources.within their zones of proximal development.This report can also be directly accessed fromthe Class Breakdown by Instructional Areareport by selecting an instructional area, RITband, or student’s name.The Test View is a general look at the subject.The RIT bands are listed from left to right,showing how skills and concepts increase indifficulty in higher RIT bands. 2021 NWEA. NWEA and MAP are registered trademarks, and MAP Growth is a trademark,of NWEA in the US and in other countries.MAP Growth Basics 17
WHAT RESOURCES ARE AVAILABLE TO HELP WITH MAP GROWTH?, CONTINUEDStudent Profile reportThe Student Profile report provides a complete picture of a student’s growth and performance.1. Go back to MAP Growth reports and selectStudent Profile.How might we use this report?2. Choose Term Rostered, School, Instructor, Class, andStudent from the drop-down lists. Then chooseView Student Profile.3. Take some time to explore the many features ofthis report.4. To watch a short video about the Student Profile report: Select Help in the upper-right corner. Navigate to Top 5 Benefits and watch the video.NOTES 2021 NWEA. NWEA and MAP are registered trademarks, and MAP Growth is a trademark,of NWEA in the US and in other countries.MAP Growth Basics 18
Planning ForwardIn your role, what will you do with theHow will you implement your plan?information you learned today to supportstudent growth?With your students:Within your school or district:Who will collaborate with you or support thisWhen will you reevaluate your plan?work? Who needs to be informed? 2021 NWEA. NWEA and MAP are registered trademarks, and MAP Growth is a trademark,of NWEA in the US and in other countries.MAP Growth Basics 19
Key Ideas and TakeawaysIdeaWhat is this?Why does it matter?What will you do with it? 2021 NWEA. NWEA and MAP are registered trademarks, and MAP Growth is a trademark,of NWEA in the US and in other countries.MAP Growth Basics 20
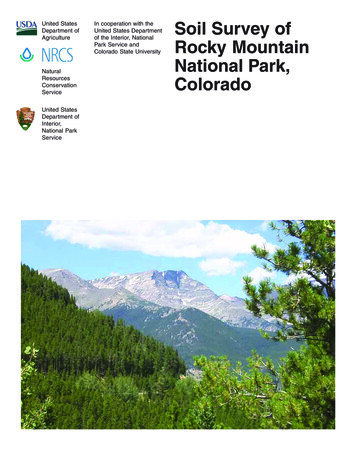
Student achievement normsThe norms in the tables below have a very straightforward interpretation. For example, inNormative Data Chartsthe achievement norms for reading, grade 2 students in the fall had a mean score of 172.35and a standard deviation of 15.19. To get a sense of how much variation there was, the SDof 15.19 can be subtracted from the mean and added to the mean to produce a range ofThe anges inabout157–188.Sincethe normsareallowbasededucatorson the bell tocurve,we knowthat 68% of allgrade 2achievement(growth)—tostudents’performance in the same grade at a comparable stage of thereadingscores statusare expectedto fall withinthis range.school year or across two test events within or across school years. For more information, explore the2020 NWEA MAP Growth Normative Data Overview.2020 Reading Student Achievement 2.662172.3532020 Mathematics Student Achievement 23.07234.1924.632020 Language Usage Student Achievement NormsFallWinter2020 General Science Student Achievement 94221.8614.98222.3315.53* These science status norms describe the distributions ofachievement in general science academic skills and content*These science status norms describe the distributions of achievement in generalscience academicskills andstudentcontentpopulationsknowledge forrelevantknowledgefor the relevantforthethesestudent populations for these grades and are useful for screening and placementgradespurposes.not be usedevaluate performanceandTestare resultsuseful shouldfor screeningandtoplacementpurposes.where science content is more specialized, such as in topically differentiated ultsshouldnot be(e.g.,usedbiology,to evaluateperformancewhere science content is more specialized, such as in topicallydifferentiated high school science courses (e.g., biology,chemistry, physics).The names of other companies and their products mentioned are the trademarks of their respective owners.3We are providing links to the third-party website(s) contained in this material only as a convenience, and the inclusion of links to the linked sitedoes not imply any endorsement, approval, investigation, verification, or monitoring by us of any content or information contained within oraccessible from the linked site. NWEA does not control the accuracy, completeness, timeliness, or appropriateness of the content or informationon the linked site. If you choose to visit the linked site, you will be subject to its terms of use and privacy policies, over which NWEA has nocontrol. In no event will NWEA be responsible for any information or content within the linked site or your use of the linked site. By continuing tothe linked site, you agree to the foregoing.2020 NWEA MAP Growth normative data 2021 NWEA. NWEA and MAP are registered trademarks, and MAP Growth is a trademark,of NWEA in the US and in other countries.July 2021 MG105MAP Growth Basics 21
but the Math Computation Skills Checklist assessments end after the first 10 questions if the student has not answered 60% or more correctly. You decide to assign the same test to all of your students as a pretest. Every student takes a Reading Skills Checklist test called Reading Decoding Patterns-Word Families. Select Early Learning Test .