Transcription
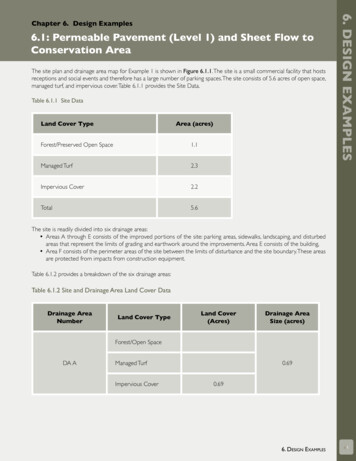
6.1: Permeable Pavement (Level 1) and Sheet Flow toConservation AreaThe site plan and drainage area map for Example 1 is shown in Figure 6.1.1. The site is a small commercial facility that hostsreceptions and social events and therefore has a large number of parking spaces.The site consists of 5.6 acres of open space,managed turf, and impervious cover. Table 6.1.1 provides the Site Data.Table 6.1.1 Site DataLand Cover TypeArea (acres)Forest/Preserved Open Space1.1Managed Turf2.3Impervious Cover2.2Total5.66. Design examplesChapter 6. Design ExamplesThe site is readily divided into six drainage areas: Areas A through E consists of the improved portions of the site: parking areas, sidewalks, landscaping, and disturbedareas that represent the limits of grading and earthwork around the improvements. Area E consists of the building, Area F consists of the perimeter areas of the site between the limits of disturbance and the site boundary. These areasare protected from impacts from construction equipment.Table 6.1.2 provides a breakdown of the six drainage areas:Table 6.1.2 Site and Drainage Area Land Cover DataDrainage AreaNumberLand Cover TypeLand Cover(Acres)Drainage AreaSize (acres)Forest/Open SpaceDA AManaged TurfImpervious Cover0.690.696. Design Examples6.1
6. Design examplesDrainage AreaNumberLand Cover(Acres)Drainage AreaSize (acres)Managed Turf0.140.66Impervious Cover0.52Land Cover TypeForest/Open SpaceDA BForest/Open SpaceDA CManaged TurfImpervious Cover0.300.30Forest/Open SpaceDA DManaged Turf0.02Impervious Cover0.410.43Forest/Open SpaceDA EManaged TurfDA F10.28Impervious Cover0.28Forest/Open Space1.10Managed Turf2.103.205.565.56Impervious CoverTotalDrainage Area F represents the perimeter undisturbed areas of the site. This area would typically be broken into sub-areas basedon the drainage patterns, and could be managed (if needed) along with BMPs in the adjacent drainage areas (A through E).16.2West Virginia Stormwater Management & Design Guidance Manual
Refer to Chapter 2.3: General Compliance Procedure for New Development and Redevelopment Projects; andRefer to Chapter 4.1: “Self-Crediting” Better Site Design Practices.The reader should note that the perimeter undisturbed area (DA F) is considered to be self crediting since leaving itas undisturbed will generate less runoff. Additional self-crediting can be achieved if portions of this perimeter area canbe designated as open space. This will require some form of easement or protective covenant to prevent the typicalturf management practices of fertilization, mowing, etc.This example will address the parking lot designated on Figure 6.1.1 as Drainage Area A.STEP 2: Evaluate BMP OptionsReference to Chapter 3.3 BMP Selection.Drainage Area A consists entirely of impervious cover.Drainage Area A Characteristics/Feasibility (Table 3.6 of Chapter 3) Soil type: Soils consist of HSG B & C soils, and are mapped as HSG B soil complex. The parking area is in slightcut at the southern end and transitions to slight fill in the northern end. The bottom of the permeable pavementsection across the entire parking lot is in cut. Water Table: Soil survey and field verification indicates the seasonal water table to be a depth greater than 5 feetbelow existing grade. Bedrock: Soil survey and field verification indicates the bedrock to be a depth greater than 5 feet below existinggrade. Hydraulic Head: Based on the existing and proposed grades, there appears to be at least three to four feet ofavailable hydraulic head to discharge under drains and the drainage system. Slopes: mild slopes Drainage Area size: Drainage area A 29,940 ft2 Available space: space is available under the pavement and at the perimeter of the parking area6. Design examplesSTEP 1 Site Assessment/Narrative:Select Level 1 Permeable Pavement discharging to a Conservation Area with partial A/B and C/D soils (locatedalong the northwest edge of the parking lot.STEP 3: Determine BMP Drainage Areas and Treatment Volume (Tv)Drainage Area Descriptions: Drainage Area A consists entirely of a parking lot (impervious cover) that will be managedusing permeable pavement in seven distinct drainage sub-areas itemized in Table 6.1.3, and shown in Figure 6.1.2.,labeled as sub-areas 1 through 7. The drainage areas consist of the paved areas only as the grading allows the adjacent pervious areas to drainaway from the pavement. (This is a critical design element of permeable pavement – any contributingdrainage area to the permeable pavement should be 100% impervious.)6. Design Examples6.3
6. Design examplesFigure 6.1.1. Drainage AreasEquationsTreatment Volume for Drainage Area A Designfrom the SiteData Tab 6.1in the West Virginia Compliance SpreadsheetExampleor the following equation:Equation 3.1 (Chapter 3): Equation 3.1 (Chapter 3) 12Where:Equation3.1 reduces to:Tv Target Treatment Volume, in acre-feet(ac.-ft.)EquationsP Depth of target rainfall event 1”1 1 Design 6.1 (unit-less)1 0.95RvI Volumetric Runoff Coefficientfor Exampleimpervious cover 2 %I Percent of site in12impervious cover (fraction) 1RvT Volumetric Runoff Coefficient, turf or disturbed soils (unit-less)1 0.2%T Percent of site in turf Equationcover (fraction)03.1 (Chapter3)RvF Volumetric Runoff Coefficient for forest cover (unit-less)1 0.03%F Percent of site in forest cover (fraction) 0 area SA Total site29,940ft2 0.69acres 1Refer to Table 3.1012Equation3.1 3.1reducesto: to:Equationreduces 6.41 1 2 12West Virginia Stormwater Management & Design Guidance Manual
DrainageSub-AreaLabelArea ofPermeablePavement(AP) (ft2)Contributing Impervious DrainageArea (AI) (ft2)Total SubArea (ft2)DesignTreatmentVolume 06,84054272,5203,0005,50043529,9402,3702Drainage Area A Total6. Design examplesTable 6.1.3. Drainage Area A Sub-Area TabulationThe parking islands on the upstream side of sub-areas 3 and 5 are proposed to be impervious (decorative pavers or similar) andcan be eliminated in favor of a continuous section of permeable pavement with wheel-stops to facilitate pavement construction.2Difference of 9 ft3 from calculated value from rounding.1STEP 4: BMP Sizing and DesignThe sub-areas are very similar in terms of size and the selected strategy of utilizing permeable pavement.The two designvariants are the sections that have no external contributing area. The design of the permeable pavement section forsub-areas 1 and 6 will be provided here. The remaining sections follow a similar design.Design Steps:Permeable Pavement: Determine the depth of the stone reservoir – Sub-Area 1. Equation 4.1 from Chapter 4.2.4provides the required depth of the stone reservoir to manage the runoff volume form the one-inch rainfall. This alsoincludes the adjacent contributing drainage area.6. Design Examples6.5
6. Design examplesEquation 4.1Equation PP.1dstonePAIRvIAPߟr݀௦௧ ൌሺܲ ൈ ܣ ூ ൈ ܴ ݒ ூ ሻ ሺܲ ൈ ܣ ሻߟ ൈ ܣ Depth of the stone reservoir layer (ft)Equation PP‐1 Rainfall depth (1”) for the design Treatment Volume 0.083 ft.2 Contributing impervious)ሺܲ ൈ ܣ ூ ൈ drainageܴ ݒ ூ ሻ ሺܲareaൈ (ܣ ft ሻ݀ൌ௦௧ Runoff Coefficient for impervious cover 0.95 Volumetricߟ ൈ ܣ Area of permeable pavement (ft2) porosity of reservoir layer (0.4)݀௦௧ ሺ௦௨ ି ଵሻ ൌሺͲǤͲͺ ൈ Ͳ ൈ ͲǤͻͷሻ ሺͲǤͲͺ ൈ ʹͷʹͲሻൌ ͲǤʹͳ ݂ ݐ Ǣ Ͳ ݁ݏݑ Ǥͷ ݂ ݐ ǤͲǤͶ ൈ ʹͷʹͲNOTE: The minimum stone depth based on the design Treatment Volume is defined by Equation 4.1. However, the minimum stone depth for permeable pavement will often be dictated by the pavement section designas a function of the anticipated traffic loading, pavement type (asphalt, concrete, or interlocking pavers), andthe strength of the sub-grade soils. Clays and highly expansive soils may require additional design of the subgrade – either the use of an extra depth of stone, or a geo-grid designed for the specific conditions.In the absence of a minimum design factor basedon the structural design of the pavement, the reservoir depth should be a minimum of 6 inchesabove the underdrain or choker layer. The annualrunoff reduction volume credit is limited to thecredit applied to the design treatment volumebased on contributing drainage area, regardlessof the reservoir depth. Additional volume reduction credit is not provided for oversized reservoirstorage.Permeable Pavement: Determine the depth ofthe stone reservoir – Sub-Area 6. Sub-area 6 islarger, and therefore has a larger dstone , howeverthe recommended minimum of 6 inches of stoneabove the underdrain governs.Figure 6.1.2. Drainage Area A with Sub-Areas1 thru 7 Delineated6.6West Virginia Stormwater Management & Design Guidance Manual
Equation PP‐1݀௦௧ ൌ݀௦௧ ሺ௦௨ ି ଶሻ ൌሺܲ ൈ ܣ ூ ൈ ܴ ݒ ூ ሻ ሺܲ ൈ ܣ ሻߟ ൈ ܣ ሺͲǤͲͺ ൈ ǡ ͲͲ ൈ ͲǤͻͷሻ ሺͲǤͲͺ ൈ ǡʹͶͲሻൌ ͲǤͶ ݂ ݐ Ǣ Ͳ ݁ݏݑ Ǥͷ ݂ ݐ ǤͲǤͶ ൈ ǡʹͶͲThe recommended minimum of six inches of reservoir depth above the underdrain is adequate to achieve the 45%(0.45 watershed-inches) runoff reduction credit. The Level 1 permeable pavement design section for sub-areas 1 and6 are shown in Figure 6.1.3.6. Design examplesEquaiton PP-1Discharge from the permeable pavement underdrains is directed to Conservation Area by way of two outfalls: oneserving sub-areas 1, 2, 3, 4, 5, and 7; and the second serving sub-area 6. (Figure 6.1.2)Sheet Flow to Conservation Areas: The conservation area designated for the discharge from the permeable pavementunderdrains and overflow inlets is a partially wooded buffer area that already has a very flat slope, and adequate vegetation. Inspections may note the need for spot enhancements to help avoid channeling, however, the primary design elementwill be the construction of level spreaders. Several different designs are illustrated in BMP Specification 4.2.1.Conservation Areas for Sub-Areas 1, 2, 3, 4, 5, and 7 (Outfall 1):1. Determine the peak discharge for the design off the Level Spreader with by-pass structure: Determine peak Q10 and peak QTv for combined sub areas 1, 2, 3, 4 and 5:- Q10 : Rational Method Q CIA; C 0.8 (WVDOH Drainage Manual, Table 4-4); I10 6.1”/hr(WVDOH Drainage Manual Chart 4-2, Appalachian Plateau; Tc 5 min);Q10 0.8*6.1*0.531 2.6 cfs;- QTV: Two methods are referenced – NRCS method in Appendix F; and Rational Method using1”/hr in sizing the level spreader rigid lip in Design Specification 4.2.1 Vegetated Filter Strips andConservation Areas (use the larger, more conservative value):NRCS Method: QTV 0.6 cfsRational Method: QTV 0.8*1*0.531 0.4 cfs Design by-pass structure to divert 0.6 cfs to the level spreader; and safely bypass 2.6 cfs to a stable outfallconveyance.2. Design Level Spreader and designate Conservation Area minimum width: From Specification 4.2.1, 40 feet of level spreader length is to be provided for every 1 cfs of inflow (witha total maximum length of 130 ft.) when the spreader discharges to a Conservation Area consisting offorested or reforested buffer. This outfall is equipped with a by-pass structure so the level spreader is sizedfor 0.6 cfs:- Minimum length of level spreader rigid lip 0.6 cfs*40 l.f./cfs 24 ft.- In order achieve maximum credit, a rigid lip of 60 l.f. is provided since the receiving conservationarea is sufficient to accept a wider sheet flow. The maximum dimensions of the conservation area should be verified in the field based on the topographyand vegetation. Field verification indicates that the conservation area adjacent to the level spreader servingOutfall 1 extends 140 feet from the level spreader.6. Design Examples6.7
6. Design examplesConservation Area for Sub-Areas 6 (Outfall 2):1. Determine the peak discharge for the design off the Level Spreader with by-pass structure: Determine peak Q10 and peak QTv for sub-area 6:- Q10 : Rational Method Q CIA; C 0.8 (WVDOH Drainage Manual, Table 4-4); I10 6.1”/hr(WVDOH Drainage Manual Chart 4-2, Appalachian Plateau; Tc 5 min);Q10 0.8*6.1*0.531 0.8 cfs;- QTV: Two methods are referenced – NRCS method in Appendix F; and Rational Method using1”/hr in sizing the level spreader rigid lip in Design Specification 4.2.1 Vegetated Filter Strips andConservation Areas.NRCS Method: QTV 0.2 cfsRational Method: QTV 0.8*1*0.531 0.1 cfs There is no bypass structure for the outfall from sub-area 6.2. Design Level Spreader and designate Conservation Area minimum width: From Specification 4.2.1, 40 feet of level spreader length is to be provided for every 1 cfs of inflow (witha total maximum length of 130 ft.) when the spreader discharges to a Conservation Area consisting offorested or reforested buffer. This outfall is not equipped with a by-pass structure, so the level spreaderis sized for Q10 0.8 cfs:- Minimum length of level spreader rigid lip 0.8 cfs*40 l.f./cfs 32 ft.- In order achieve maximum credit, a rigid lip of 60 l.f. is provided since the receiving conservationarea is sufficient to accept a wider sheet flow. The maximum dimensions of the conservation area should be verified in the field based on the topographyand vegetation. Field verification indicates that the conservation area adjacent to the level spreaderserving Outfall 2 extends 70 feet from the level spreader. For purposes of measuring the runoff reduction credit, the first 40 feet of conservation area is in HydrologicGroup B soils, and the remaining 30 feet is in Hydrologic Group C soils.STEP 5: Verify CompliancePermeable Pavement:Similar sizing calculations for the remainder of the sub-areas yield similarly shallow permeable pavement sections. TheLevel 1 Permeable Pavement design provides 45% volume reduction (or 0.45 watershed inches). The typical Level 1cross section is shown in Figure 6.1.3 and the cross section through Drainage Area 1 is shown in Figure 6.1.4.Compliance as computed with the West Virginia Compliance Spreadsheet Drainage Area tab, or the following calculation for the entire drainage area (including all 7 sub-areas) can be summarized as follows:Total remaining Treatment Volume (Tv) 2,370 ft3 – (2,370 ft3 x 0.45) 1,304 ft3Remaining from Outfall 1: 1,006 ft3Remaining from Outfall 2: 298 ft3Conservation Areas:Outfall 1: Sheet flow to 60 ft. x 140 ft. Conservation Area in C/D soils provides a volume reduction credit of 4ft3 per 100 ft2 of conservation area.The credit derived from the Outfall 1 Conservation Area (60 ft * 140 ft)*(4 ft3/100ft2) 336 ft3Remaining Treatment Volume (Tv) at Outfall 1 1,006 ft3 – 336 ft3 670 ft3Outfall 2: Sheet flow to 60 ft x 40 ft. Conservation Area in A/B soils provides a credit of 9 ft3 per 100 ft2 of conservation area. Sheet flow to remaining 60 ft. x 90 ft. Conservation Area in C/D soils provides a volume reductioncredit of 4 ft3 per 100ft2 of conservation area.The credit derived from the Outfall 2 Conservation Area:(60ft*40ft)*(9ft3/100ft2) (60ft*90ft)*(4ft3/100ft2) 432 ft3Remaining Treatment Volume (Tv) at Outfall 2 298 ft3 – 432 ft3 0 ft36.8West Virginia Stormwater Management & Design Guidance Manual
6. Design examplesFigure 6.1.3.Typical Level 1 Permeable Pavement Section Sub-Areas 1 through 6Figure 6.1.4. Cross Section of Sub-Areas 1 through 5 and 7Overall Compliance Drainage Area 1:The overall Runoff Reduction BMP design for Drainage Area 1 is 670 ft3 short of the target design Treatment Volume.Specifically, the shortfall in treatment occurs in Outfall 1, draining sub-areas 1, 2, 3, 4, 5, and 7. The 134 ft3 of additionalvolume managed in the Conservation Area of Outfall 2 cannot be credited toward reducing this deficit. Therefore, theshortage must either be managed through a fee-in lieu payment if available through the local plan approving authority,or the designer can evaluate other BMP options.Since there is no space for additional BMPs downstream of the conservation areas, the designer should evaluateproviding Level 1 Permeable Pavement – Refer to Example 6.2).Example 6.2 provides the computations for sizing the infiltration sump.6. Design Examples6.9
This page blank
6.2 Design Example 2: Permeable Pavement(Level 2-Infiltration Sump)This Example will apply the Level 2 Infiltration Sump design to Drainage Area A in an effort to manage the 670 ft3 deficitcomputed in Example 6.1. The infiltration rates of the existing soils under the proposed permeable pavement must beverified in order to assess the applicability of an infiltration or infiltration sump design, and establish the depth of the stonereservoir or sump.A Level 2 Infiltration design provides a 100% (or one watershed-inch) runoff reduction credit for the volume of runoffabove the filter layer and existing soils.A Level 2 Infiltration Sump design provides a 45% (or 0.45 watershed-inches) runoff reduction credit for the volume of therunoff above the underdrain, and a 100% runoff reduction credit for the volume of runoff in the infiltration sump (below theunderdrain and above the filter layer). However, the combined volume reduction credit of the two storage volumes cannotexceed 100% (or one watershed-inch) for the contributing drainage area.6. Design examplesChapter 6. Design ExamplesSTEP 1 Site Assessment/Narrative:Refer to Chapter 2.3: General Compliance Procedure for New Development and Redevelopment Projects; and Chapter4.1: “Self-Crediting” Better Site Design PracticesSTEP 2: Evaluate BMP OptionsReference to Chapter 3.3 BMP Selection.Site Characteristics/Feasibility (Table 3.6) Soils: The parking area is in a B soil complex. Following the infiltration testing criteria of Appendix E, the soils inthis area have a verified infiltration rate of 0.5”/hr or greater (0.5”/hr will be used as the design value for thefield verified infiltration rate).The area is in cut at the southern end (sub-area 1) and transitions to slight fill inthe northern end (sub-area 7). The bottom of the permeable pavement section across the entire parking lotis in cut. The remaining site characteristics are repeated from Example 6.1.Select Level 2 Permeable Pavement Infiltration Sump Design with infiltration rate (i) equal to 0.5”/hr.STEP 3: Determine BMP Drainage Areas and Treatment Volume (Tv)Drainage Area Descriptions:The sub-areas and corresponding Treatment Volume for Drainage Area A are as noted in Table 6.1.3.STEP 4: BMP Sizing and DesignThe stone reservoir depth for sub-area 1 was determined in Example 7.1 to be 0.21 ft., and the stone reservoir depthfor sub-area 6 to be 0.43 ft., with the minimum recommended depth for both areas set at 0.5 ft.The maximum depth of the Infiltration Sump for all of the sub-areas of Drainage-Area 1 is determined using Equation4.2 from Chapter 4.2.4:6. Design Examples6.11
6. Design examplesEquationsDesign Example 6.2Equation PP-2Equation PP‐2Where:dISitd 1 212 Depth of the stone infiltration sump (ft) field‐verified infiltration rate for the sub‐grade soils 0.5 “/hr. design drain time of sump 48 hours 1 0.5 2 1.0 .12Equation 4.3 (depth of stone reservoir above the infiltration sump, dres) is not needed since the maximum depth ofthe infiltration sump (dIS 1.0 ft) exceeds the required stone reservoir depth for sub-area 1 (0.21 ft) and sub-area6 (0.43 ft). Therefore, setting the depth of the infiltration sump equal to or greater than the stone reservoir depthwill achieve a 100% runoff reduction credit for the contributing drainage area(s). An underdrain with the minimumrecommended cover of 6 inches of stone and a 0.21 ft and 0.43 ft stone sump in sub-areas 1 and 6 respectively willtherefore achieve a 100% volume treatment credit and provide for an underdrained system.The Level 2 permeable pavement infiltration sump design section for sub-areas 1 and 6 are shown in Figure 6.2.1.The structural design of the pavement may require additional depth of stone or a geotextile. The Sheet Flow toconservation area is not needed for Drainage Area 1 as full compliance is achieved with the permeable pavementdesign.Sub-Area 1Sub-Area 6Figure 6.2.1 Typical Level 2 Permeable Pavement Infiltration Sump Section6.12West Virginia Stormwater Management & Design Guidance Manual
6.3. Design Example 3: BioretentionThis example continues with the site plan introduced in Example 6.1 and addresses the treatment volume generated inDrainage Area B as shown in Figure 6.3.1.STEP 1 Site Assessment/Narrative:Refer to Chapter 2.3: General Compliance Procedure for New Development and Redevelopment Projects; and Chapter4.1: “Self-Crediting” Better Site Design PracticesSTEP 2: Evaluate BMP OptionsReference to Chapter 3.3 BMP Selection.Site Characteristics/Feasibility (Table 3.6 of Chapter 3) Soils: Soils consist of HSG B & C soils. The area is mapped as a HSG B soil complex. Water Table / Bedrock Hydraulic Head Slope: mild slopes Drainage Area size Available space6. Design examplesChapter 6. Design ExamplesThe available hydraulic head (the vertical distance from the inflow elevation and the invert of the outlet system) allowsfor a Level 2 Bioretention design: 2 feet of bioretention soil media and an underdrain.Select Level 2 Bioretention located in the central driveway island.Figure 6.3.1. Drainage Areas6. Design Examples6.13
6. Design examplesSTEP 3: Determine BMP Drainage Areas and Treatment Volume (Tv)Drainage Area Descriptions:Drainage Area B consists of parking, sidewalk, and driveway area, as well as some green space in the form of managedturf adjacent to the proposed building and a minor strip of cut/fill slope adjacent to the parking and sidewalk curb andgutters. In addition, the open space reserved for the proposed bioretention area in the interior of the large parkingisland of Drainage Area B is considered open space.There are several options for the treatment of the runoff from this drainage area. However, protecting the perimeterportions of the site from disturbance and maintaining them as open space will be a self-crediting measure. Also, thepresence of mature hardwood trees along the western edge of the parking lot serves to discourage any grading beyond the minor fill required for the parking and curb line. Further, the grading required to drain the area to the eastcreates outfall and earthwork challenges. Therefore, the large parking island is identified as the optimal location for abioretention basin.The sub-areas of Drainage Area B provide for two inflow points into the Bioretention Basin. Figure 6.3.2 shows theproposed grading and drainage divides, as well as the proposed stormwater entry points (curb cuts and overflowinlets) into the bioretention area.Table 6.3.1. Drainage Area B Land Cover DataLand CoverArea (ft2)Area (ac)Percent (%) of TotalForest/Open Space16,3500.1519Managed Turf6,0880.1417Impervious22,6600.5264Drainage Area B Total35,0980.81The Forest/Open Space land cover is applied to the area of the Bioretention Basin1EquationsThe Treatment Volume for Drainage Area B is takenfrom the Site Data Tab in the West Virginia ComplianceSpreadsheet or the following equation:Design Example 6.3Equation 3.1 (Chapter 3):Equation 3.1 (Chapter 3): 6.14 121 2 1 1 1 1 12West Virginia Stormwater Management & Design Guidance Manual
Bioretention Basin: From Chapter 4.3.2Step 1: Surface ponding – For ponding depths of less than 1 foot, surface storage should account for at least 50%of the required total design volume within the practice. For ponding depths of 1 foot or more (18 inchesmaximum), surface storage should account for at least 70% of the total design volume. Select 12” surface ponding depth; surface ponding volume 70% of design Tv 0.7*1,887 ft3 1,320 ft3Step 2: Soil media surface area and depth – The soil media and gravel layer provide the required remaining storagevolume within the void spaces to manage the design treatment volume. The minimum surface area of the soilmedia can be derived as a function of the bottom surface area of the surface ponding volume. The pondingsurface area can be larger than the surface area of the soil media as defined in Chapter 4.2.3:-Ponding depths 1 ft., ponding surface area can exceed the soil media surface area by up to 50%;Ponding depths 1 ft., ponding surface area can exceed the soil media surface area by up to 25%6. Design examplesSTEP 4: BMP Sizing and DesignIn order to provide the most economical design, the soil media surface area will be minimized to 25% less thanthe ponding surface area as measured at the soil surface: Use Equation 4.1 from Chapter 4.2.3 to determine the average ponding surface area:-Surface Ponding Volume SAavg-ponding*dponding 1,320 ft3 dponding 12”; SAavg-ponding 1,320 ft2- Approximate surface area at the bottom of the ponding depth 1,100 ft2 ; based on: 3:1 side slopes; 12” ponding depth. Soil media surface area (ponding surface area bottom)/( 1.25)Equations 1,100 ft2/1.25 880 ft2Design Example 6.3Step 3: Verify Total Design Treatment Volume Total storage volume of the practice: Equation 4.2 from Chapter 4.2.3: Total storage volume of the practice: Equation BR‐2 from Chapter 4.2.3: 0 2 0.25 0.75 0.4 ,320 2,024 ft3 5 ft3 Figure 6.3.2 provides the plan view of the proposed design showing the limits of: Surface Area of Ponding (average depth) minimum 1,320 ft2 Surface Area of soil media minimum 880 ft2Figure 7.3.3 provides the typical section of the Bioretention Basin. Ponding depth 1 ft Soil media depth 2 ft Gravel layer thickness 9 inches (including 4” underdrain)6. Design Examples6.15
6. Design examplesFigure 6.3.2. Bioretention Basin Plan ViewFigure 6.3.3. Bioretention Basin Section6.16West Virginia Stormwater Management & Design Guidance Manual
6. Design examplesStep 4: Design Features – Refer to Chapter 4.2.3; Design Step 4: Pre-Treatment Cells (or Forebays): Pre-treatment is essential for long term performance of BioretentionBasins (Refer to Section 4.3 of Chapter 4.2.3). Figure 7.3.2 shows the proposed drainage divides forForebay 1 and Forebay 2, as well as the proposed entry points (curb cuts) into the bioretention area. Thedesign volume for the forebays is approximated as 15% of the design treatment volume, inclusive:- Two curb cuts: approximately 36% of drainage area to curb cut #1; 65% to curb cut 2.- The 15% target volume will be proportioned between the two curb cuts. Forebay 1 Volume (0.36)*(0.15)*( 2,024 ft3) 109 ft3 Forebay 2 Volume (0.64)*(0.15)*( 2,024 ft3) 194 ft3 Geometry: The parking grading has been manipulated to position the inlet curb cuts at the farthest possiblelocation from the proposed outlet location. Landscaping plan: surface cover is mulch and landscaping (Section 4.17); 4-inch perforated underdrains with choker stone layer (no sump is provided) Outlet Structure sized to carry the 2-year design storm, and the overflow curb inlets are sized and designedto carry the 10-year design storm (or as required by the local plan approving authority).Step 5: Verify ComplianceThe Level 2 Bioretention provides 100% runoff reduction for the design Treatment Volume. Therefore, DrainageArea 2 meets the treatment requirements.6. Design Examples6.17
This page blank
6.4. Design Example 4: Water Quality Swale and GrassSwaleThis example continues with the site plan introduced in Example 6.1 and addresses the treatment volume generated inDrainage Area C as shown in Figure 6.4.1. Drainage Area C consists of parking lot that is gently sloped in one directioncreating a BMP location along the long edge of the parking lot. The available hydraulic head (the vertical distance betweenthe elevations of the inflow and the invert of the outlet) is severely limited in this area of the site, necessitating a minimaldepth BMP.STEP 1 Site Assessment/Narrative:Refer to Chapter 2.3: General Compliance Procedure for New Development and Redevelopment Projects; andChapter 4.1: “Self-Crediting” Better Site Design PracticesSTEP 2: Evaluate BMP OptionsReference to Chapter 3.3 BMP Selection.6. Design examplesChapter 6. Design ExamplesSite Characteristics/Feasibility (Table 3.6) was evaluated in Example 6.1. Several BMP options were considered for thisdrainage area: Vegetated Filter Strip: not enough space is available on either side of the parking area; Impervious Disconnection: small areas of commercial non-residential impervious can be treated withdisconnection. The longest flow path criterion is met ( 75’); however, there is insufficient space for thedisconnection (similar to the vegetated filter strip).Select Level 1 Water Quality Swale located adjacent to the long edge of the parking lot (between the parking lotand the building).Figure 6.4.1. Drainage Areas6. Design Examples6.19
6. Design examplesSTEP 3: Determine BMP Drainage Areas and Treatment Volume (Tv)Drainage Area Description:Drainage Area C consists of two rows of parking and drive aisle, and an adjacent sidewalk. Portions of the parkingarea are in fill in order to create proper drainage patterns, so all the adjacent pervious areas drain away from theparking. Therefore, the entire drainage area is impervious.Table 6.4.1. Drainage Area C Land Cover DataArea (ft2)Area (ac)Percent (%) ofTotalForest/Open Space000Managed Turf000Impervious12,9370.297100Drainage Area 3Total12,9370.297Land CoverThe parking area sheet flows across with the downhill edge of pavement serving as a level spreader into the waterquality swale. The Level 1 water quality swale only achieves 55% runoff volume reduction, so it will need to be oversized or additional r
Refer to Chapter 2.3: General Compliance Procedure for New Development and Redevelopment Projects; and Refer to Chapter 4.1: "Self-Crediting" Better Site Design Practices. The reader should note that the perimeter undisturbed area (DA F) is considered to be self crediting since leaving it as undisturbed will generate less runoff.