Transcription
LRFD Pile Design ExamplesIowa DOT Bridges and Structures Bureau March2022OverviewThese examples in customary U.S. (or English) units have been extracted and revised from thefollowing publication:Green, Donald, Kam W. Ng, Kenneth F. Dunker, Sri Sritharan, and Michael Nop. (2012).Development of LRFD Procedures for Bridge Pile Foundations in Iowa - Volume IV:Design Guide and Track Examples. IHRB Projects TR-573, TR-583, and TR-584.Institute for Transportation, Iowa State University, Ames, ents/researchreports/lrfd vol iv final w cvr.pdfIn general the revisions are intended to relate the examples specifically to Iowa Department ofTransportation (Iowa DOT), Bridges and Structures Bureau (OBS) policy in the Bridge DesignManual (BDM). A summary of the revisions from Volume IV follows. Move the contract length and resistance and the driving and construction control notesfrom Volume IV Articles 2.4.1-2.4.4 to BDM 13.8.2 listing (of Bridge SubstructureCADD Notes), E718, E719, E818, and E819. Edit and move all of the appendices except Appendix E (Derivation of Equations ) fromVolume IV to the Bridge Design Manual.o Appendix A to BDM 6.2.7 Nominal geotechnical resistanceso Appendix B to BDM 6.2.8 Soil categorieso Appendix C to BDM 6.2.9 Resistance factorso Appendix D to BDM 6.2.10 Cohesive soil setupo Appendix F to BDM 6.2.4.2 Pile lengtho Appendix G and H to various BDM articles Add structural design to Step 3 of all examples.Because the Iowa DOT pile load tests used in calibration were conducted at a time whenStandard Penetration Test hammers averaged about 60% efficiency and because the industry ismoving toward a 60% standard, in the future the Iowa DOT intends to use N60-values fromStandard Penetration Tests. Until N60-values are available the designer may use uncorrected Nvalues as shown in these examples. Uncorrected N-values from drilling rigs with modernautomatic trip hammers may increase pile contract length slightly and reduce target drivingresistance slightly but are not expected to have significant effects. (For typical design situationsthe Iowa DOT does not intend to use the overburden correction [AASHTO LRFD 10.4.6.2.4].)Setup in cohesive soils may be used to reduce the end-of-drive (EOD) driving target for steel H1
piles with WEAP construction control, as shown in several examples. However, at this timesetup should not be used with timber, steel pipe, or prestressed concrete piles or with Iowa DOTENR Formula construction control.There are eleven design examples, which are arranged in three tracks as listed in the table below.The tracks are intended to fit different design and construction practice in Iowa as noted.Track 1: Standard Iowa DOT design and standard construction control with waveequation (WEAP) for ordinary projects on state, county, or city highwaysTrack 2: Standard Iowa DOT design and alternate construction control with the IowaDOT ENR Formula (from the Iowa DOT Standard Specifications for Highway andBridge Construction, Series 2012 Revised for 2013, 2501.03, M, 2) for ordinary projectson county or city highways (but not on state highways)Track 3: Standard Iowa DOT design and alternate construction control with specialmethods for large and other special projects on state, county, or city highwaysOn the following page is a table summarizing characteristics of the examples, and following thetable are brief descriptions of the examples.2
Summary of characteristics of the track examplesTrackNumberPile TypeExampleNumber[Page]1 [1]2 [18]H-Pile3 uction ControlsPlannedDrivingRetapCriteria3 Daysafter EOD4 [41]PierNonCohesiveUplift5 [51]IntegralAbutmentCohesiveEndBearing inBedrockPipe Pile6 [60]Pile BentNonCohesiveScourPrestressedConcretePile7 [69]Pile BentNonCohesiveScourH-Pile1 [78]IntegralAbutmentCohesive---TimberPile2 [92]IntegralAbutmentNonCohesive---1 [102]IntegralAbutmentCohesive---PDA/CAPWAPandWEAP2 lTypeSpecialConsiderationsH-PileWEAPNoIowa DOTENRFormulaYesAbbreviations: CAPWAP, Case Pile Wave Analysis Program DOT, Department of Transportation ENR, Engineering News-Record EOD, end of drive PDA, Pile Driving Analyzer WEAP, Wave Equation Analysis of Pile Driving (and successor programs such asGRLWEAP by GRL Engineers, Inc.), often referred to simply as “wave equation”Each design example is a stand-alone document, but the first example in each track has the mostextensive explanations and notes. A brief description of each design example is provided below.3
Track 1, Example 1As the first example in the Design Guide, this example provides detailed calculations thatare not included in all other examples, such as: Selection of unit nominal resistance based on soil type and standard penetrationtest (SPT) N-value. Determination of setup factor for cohesive soil based on average SPT N-value. Determination of nominal driving resistance from blow count during construction. Determination of generalized soil category based on the ratio of pile penetrationin cohesive and non-cohesive layers. Incorporation of setup into driving resistance estimation for cohesive soils. Discussion on pile retap 24 hours after EOD for piles with driving resistance atEOD less than the required nominal driving resistance.Track 1, Example 2This example illustrates that for a friction pile subject to scour, the contribution to sideresistance from the soil above the scour interval should be neglected to estimate thenominal bearing resistance (Design Step 7), while this contribution should be included toestimate driving resistance (Design Step 8). The increase in the length of the friction pileto account for scour will result in additional driving resistance that must be accounted forwhen the piles are driven.Track 1, Example 3This example highlights the effects of downdrag on pile design: 1) the soil above theneutral plane does NOT contribute to side resistance; 2) downward relative movement ofsoil above the neutral plane exerts drag load to the pile. This example also demonstrateshow prebored holes can be used to relieve part of the downdrag load.Track 1, Example 4This design example includes an uplift resistance calculation, in addition to the routinepile axial compression resistance calculation. Resistance factors for uplift are taken as75% of the resistance factors for axial compression resistance.Track 1, Example 5This design example is for end bearing piles that are driven through cohesive soil andtipped out in rock. A resistance factor of 0.70 was used for end bearing in rock based onsuccessful past practice with WEAP analysis and the general direction of Iowa LRFDpile testing and research. This design example presents the procedures to calculate pileresistance from a combination of side friction in soil and end bearing in rock. It alsodemonstrates how to consider the partial setup effect from the side resistance in cohesivesoil.Track 1, Example 6This design example illustrates design of displacement pipe piles that develop frictionalresistance in non-cohesive soil at a pile bent that is exposed to possible scour.4
Track 1, Example 7This design example is a companion to Example 6 and is for prestressed concrete frictionpiles that are driven in non-cohesive soil at a pile bent that is exposed to possible scour.Track 2, Example 1This design example demonstrates how to use the Iowa DOT ENR (Engineering NewsRecord) Formula to estimate nominal pile driving resistance from observed blow countsduring pile driving. The only difference between this design example and Track 1,Example 1 is the construction control. It should be noted that the resistance factors usedin this design example are lower than those in Track 1, Example 1, since moreuncertainty is involved when using construction control based on the Iowa DOT ENRFormula instead of a wave equation analysis.Track 2, Example 2This design example is for timber piles that are driven in non-cohesive soil using theIowa DOT ENR Formula for construction control.Track 3, Example 1This design example is basically the same as Track 1, Example 1, with additionalconstruction control involving a pile driving analyzer (PDA) and CAPWAP analyses.The purpose of this design example is to demonstrate that when more strict constructioncontrol is applied, fewer uncertainties are involved, since the pile resistance can be fieldverified by PDA/CAPWAP tests. Therefore, higher resistance factors can be used; andthis results in shorter pile length.Track 3, Example 2This design example is basically the same as Track 1, Example 1, with additionalconstruction control involving pile retaps (or restrikes) at 3 days after EOD. It should benoted that the resistance factors with special consideration of pile setup are for 7-dayretap. This design example demonstrates how to estimate the nominal driving resistanceat 3 days after EOD using the setup factor chart. It also demonstrates that higherresistance factors can be used, when retap is planned, since the retap is used to verify theincrease in geotechnical pile resistance as a result of pile setup.In order to work through a design example the designer will need the AASHTO LRFDSpecifications to determine the factored load and several sections from the Bridge DesignManual to determine resistance factors, resistances, and appropriate plan notes: 6.2 Piles 6.5 Abutments 6.6 Piers 13 CADD NotesOn the next page is a summary of the load factors, resistance factors, and resistances at thestrength limit state and information sources for the four pile types that may be used by theBridges and Structures Bureau. The Bureau most commonly uses H-piles.5
Load factors, resistance factors, resistances at strength limit state and AASHTO and BDM information sources by pile typeFactorSteel H-pileTimber pilePrestressed concreteConcrete-filled pipepilepileStructural load factors, γ AASHTO 3.4.1AASHTO 3.4.1AASHTO 3.4.1AASHTO 3.4.1Structural load factor for BDM 6.2.4.3BDM 6.2.4.3BDM 6.2.4.3BDM 6.2.4.3downdrag, γDDγDD 1.0γDD 1.0γDD 1.0γDD 1.0Downdrag load, DDBDM Table 6.2.7-2BDM Table 6.2.7-2BDM Table 6.2.7-2BDM Table 6.2.7-2Structural resistancefactors, ϕStructural bearingresistance factor for pilebent, ϕStructural bearingresistance, RnStructural bearingresistance for integralabutment, RnStructural bearingresistance for pile bent,RnStructural lateralresistanceGeotechnical bearingresistance factor, ϕGeotechnical upliftresistance factor, ϕGeotechnical endresistance, RnGeotechnical frictionresistance, RnAASHTO 6.5.4.2AASHTO 8.5.2.2BDM Table 6.6.4.2.1.1,ϕ 0.70BDM 6.2.6.1SRL-1, SRL-2, SRL-3,SRL-4BDM Tables 6.5.1.1.1-1and 6.5.1.1.1-2BDM 6.2.6.380 kips, 100 kipsAASHTO 5.5.4.2AASHTO 6.5.4.2BDM Table 6.6.4.2.1.2,ϕ 0.75BDM Table 6.6.4.2.1.3,ϕ 0.80AASHTO Section 5AASHTO 6.9.5,6.12.2.3BDM Table 6.6.4.2.1.2or P10LBDM Table 6.6.4.2.1.3or P10LBDM 6.2.6.364 kipsBDM Table 6.6.4.2.1.1 orP10LBDM 6.2.6.118 kipsBDM 6.2.6.37 kipsBDM Table 6.2.9-1BDM Table 6.2.9-1BDM Table 6.2.9-1BDM Table 6.2.9-1BDM Table 6.2.9-2BDM Table 6.2.9-2BDM Table 6.2.9-2BDM Table 6.2.9-2BDM Table 6.2.7-1BDM Table 6.2.7-1BDM Table 6.2.7-1BDM Table 6.2.7-1BDM Table 6.2.7-2 and6.2.7 discussionBDM Table 6.2.7-2 and6.2.7 discussionBDM Table 6.2.7-2 and6.2.7 discussionBDM Table 6.2.7-2 and6.2.7 discussion1
Driving resistancefactor, ϕTARBDM Table 6.2.9-3Fig 6.2.10BDM Table 6.2.9-30.35 or 0.40BDM Table 6.2.9-3Fig 6.2.10BDM Table 6.2.9-3Fig 6.2.10CADD plan notesBDM 13.8.2:E718, E719, E818, E819BDM 13.8.2:E718, E719, E818, E819BDM 13.8.2:E718, E719, E818, E819BDM 13.8.2:E718, E719, E818,E8192
Track 1, Example 1Driven H-Pile in Cohesive Soil with Construction Control Based on Wave Equation and NoPlanned RetapGeneral design and construction steps to be modified for project conditionsDesign StepsStep 1Develop bridge situation plan (or TS&L, Type, Size, and Location). (1)Develop soils package, including soil borings and foundation recommendations.Step 2(1)Determine pile layout, pile loads including downdrag, and other designrequirements. (1) This step includes structural checks.Step 4Estimate nominal geotechnical resistance for friction and end bearing.Select resistance factor(s) to estimate pile length based on the soil profile andStep 5construction control.Step 6Calculate required nominal pile resistance, Rn .Estimate contract pile length, L, considering downdrag, scour, pile uplift, lateralStep 7loading, and unbraced length, if applicable.Step 8Estimate target nominal pile driving resistance, Rndr-T .Step 9Prepare CADD notes for bridge plans.Step 10Check the design. (2)Construction StepsRequest and check contractor’s hammer data, and prepare bearing graph forStep 11WEAP control or other necessary items for alternate methods of constructioncontrol.Observe construction, record driven resistance, and resolve any constructionStep 12issues.Step 3(1) These steps determine the basic information for geotechnical pile design and will vary dependingon bridge project and Bureau practice.(2) Checking will vary depending on bridge project and Bureau practice.Within the Bridges and Structures Bureau at the Iowa DOT, the design steps that determine thebasic information necessary for design of a steel H-pile generally follow as indicated in Steps 13. The steps involve communication among the preliminary design engineer, soils designengineer, and final design engineer. In other organizations the basic information may bedetermined differently, but that process generally should not affect the overall design of the pile.Step 1 - Develop bridge situation plan (or TS&L, Type, Size, and Location)For a typical bridge the preliminary design engineer plots topographical information, locates thebridge, determines general type of superstructure, location of substructure units, elevations offoundations, hydraulic information (if needed), and other basic information to characterize thebridge. The preliminary design engineer then prepares a TS&L sheet that shows a plan andlongitudinal section of the bridge.For this example for a state project, the TS&L gives the following information needed for design1
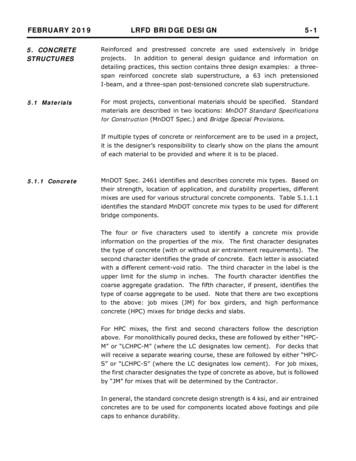
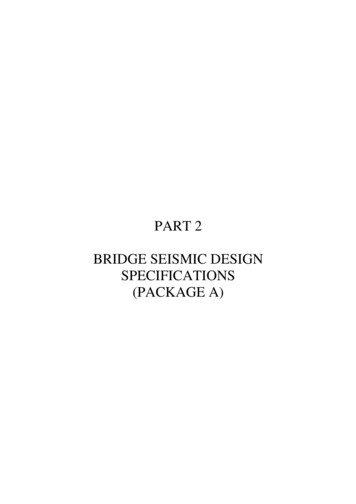
of abutment piles: 120-foot single span, prestressed concrete beam superstructureZero skewIntegral abutments (because these are standard practice for non-skewed concrete bridgesless than 575 feet in length with end or single spans not exceeding the length of standardprestressed concrete beams) [BDM 6.5.1.1.1]Pile foundations, no prebored holes (because the bridge length is less than 130 feet)[BDM 6.5.1.1.1]Bottom of west abutment footing elevation 433 feetStep 2 - Develop soils package, including soil borings and foundation recommendationsBased on location of the abutments the soils design engineer orders soil borings, typically at leastone per substructure unit. When the engineer receives the boring logs he/she arranges for them tobe plotted on a longitudinal section, checks any special geotechnical conditions on the site, andwrites a recommendation for foundation type with any applicable special design considerations.For this example, the recommendations are the following: Friction piles that tip out in the firm glacial clay layerSteel H-piles for the integral abutmentsStructural Resistance Level – 1 (which does not require a driving analysis by theConstruction and Materials Bureau during design [BDM 6.2.6.1])Normal driving resistance (This will lead to φc 0.60 for the structural check.)No special site considerations for stability, settlement, or lateral movement (Therefore theService I load will not be required for design.)Standard construction control based on WEAP analysis with no planned retapThe soil profile includes the following soil boring at the west abutment. Generally below thebottom of footing elevation there are three soil layers: 6 feet of soft silty clay, 9 feet of silty sand,and firm glacial clay to the bottom of the boring at 95 feet. Layer 3 is subdivided at a depth of 30feet because nominal friction resistance step-increases at that elevation [BDM Table 6.2.7-2]. Nogroundwater was encountered in the boring.2
Track 1, Example 1-soil profile at west abutment3
Step 3 - Determine pile layout, pile loads, and other design requirements. This step includesstructural checks.The final design engineer begins design of the abutment piles with the TS&L and the soils designpackage. Because the bridge has a prestressed concrete beam superstructure and integralabutments the engineer selects HP 10 57 piles, following Bridge Design Manual policy [BDM6.5.1.1.1].There is no uplift, downdrag, or scour. Because the bridge characteristics fall within integralabutment policy, the site has no unusual characteristics, the soils design engineer did not requirefurther analysis, and construction will not be accelerated or delayed, there will be no need forlateral load or special analysis of the abutment piles. They may simply be designed for verticalload.Notation: The same loads are designated in Step 3 with “P” (for structural checks) and in Steps 6and 8 with “Q” (for geotechnical and driving checks).For the west abutmentΣηγP γDDDD 895 0 895 kips PuThe soils package indicates normal driving resistance, thereforeφc 0.60The soils engineer recommends SRL-1 for whichPn 243 kips [BDM Table 6.2.6.1-1]Considering the TS&L and other project factors the final design engineer selects BTC beams[BDM Table 5.4.1.1.1]. For integral abutments with BTC beams and prebored holes for the piles,the maximum Pn is 365 kips [BDM Table 6.5.1.1.1-1]. With the short span, the prebored holesare not necessary and, for this project, 365 kips would be the limit per integral abutment pile.The SRL-1 value controls, however.Required number of pilesn Pu/φPn 895/(0.60)(243) 6.14, round to 7 pilesEach pile then must carryPu 895/7 128 kipsThe pile layout will be seven piles under the abutment plus one pile for each wing extension asshown below. (For the number of beams the designer checks the minimum number of piles, andfor the abutment dimensions the designer checks the pile spacing guidelines [BDM 6.2.4.1].4
Those checks are not shown here.) In this case the wing extension piles are added for abutmentstability and are moderately loaded so they need not be checked for structural resistance.Track 1, Example 1-pile layout at west abutmentStep 4 – Estimate nominal geotechnical resistance for frictionBased on the west abutment soil boring and BDM Table 6.2.7-2, the final design engineerestimates the following nominal unit resistances for friction bearing.Track 1, Example 1-estimated nominal unit geotechnical resistanceSoilStratumSoil DescriptionStratumThicknessAverageSPT NValue(ft)69(blows/ft)46Estimated UnitNominalResistance forFriction Pile(kips/ft)0.81.28112.865123.212Soft Silty ClaySilty Sandwithin 30 feet of3Anatural groundelevationFirmGlacialmore than 30Clayfeet below3Bnatural groundelevationAbbreviation: SPT, standard penetration testThe firm glacial clay stratum has been divided into two parts, to delineate the embedded pilelength that is within 30 feet of the natural ground surface as noted in the BDM geotechnicalresistance chart [BDM Table 6.2.7-2]. Application of the chart to estimate the nominal resistancevalues is illustrated on the next page. Note that the SPT N values are too small for use of endbearing in Layer 3B [BDM Table 6.2.7-1].5
Track 1, Example 1-geotechnical resistance chart [BDM Table 6.2.7-2]6
Step 5 - Select resistance factor to estimate pile length based on the soil profile andconstruction controlIn this step the final design engineer first characterizes the site as cohesive, mixed, or noncohesive based on soil classification in the table below and the soil profile.Track 1, Example 1-soil classification table [BDM Table 6.2.8]GenerSoil Classification MethodalizedAASHTUSDABDM 6.2.7 GeotechnicalOSoilTexturalResistance ChartsCategoryVery soft silty clayA-1, A-2and A-3Sandy clay loamSandy loamLoamy sandSandLoessGlacial ClayA-4, A-5,A-6 andA-7ClaySilty claySilty clay loamSiltClay loamSilt loamLoamSandy clayStiff silty clayFirm silty clayStiff siltStiff sandy clayFirm silty glacial clayFirm clay (gumbotil)Firm glacial clayAlluvium Or LoessNon-CohesiveCohesiveSoft silty clayFirm sandy glacial clayFirm-very firm glacial clayVery firm glacial clayVery firm sandy glacial clayCohesive or glacial materialStiff sandy siltSilty sandClayey sandFine sandCoarse sandGravely sandGranular material (N 40)Abbreviations: AASHTO, American Association of State Highway and Transportation Officials USDA, U.S. Department of AgricultureOnly the 9-foot Layer 2 of silty sand is classified as non-cohesive. The remainder of the profile isclassified as cohesive, and most likely will represent more than 70% of the pile embedmentlength. Thus the soil is expected to fit the cohesive classification, and the resistance factorselection from the three available choices below is 0.65 [BDM Table 6.2.9-1].7
φ 0.65 for cohesive soil, averaged over the full depth of estimated pile penetrationφ 0.65 for mixed soil, averaged over the full depth of estimated pile penetrationφ 0.55 for non-cohesive soil, averaged over the full depth of estimated pile penetrationStep 6 - Calculate required nominal pile resistance, RnThe required nominal pile resistance is:Rn where ηγQ γDD DD 128 0 197 kips/pile0.65φ ηγQ γQ 128 kips (Step 3)γDDDD 0 (no downdrag)φ 0.65 (Step 5)Step 7 – Estimate contract pile length, LBased on the nominal resistance values in Step 4, the cumulative nominal geotechnicalresistance, Rn-BB, per pile is calculated as follows, where D depth in feet below the bottom offooting.D0 0 ft, Rn-BB0 0D1 6 ft, Rn-BB1 Rn-BB0 (0.8 kips/ft) (6 ft) 4.8 kipsD2 6 9 15 ft, Rn-BB2 Rn-BB1 (1.2 kips/ft) (9 ft) 4.8 10.8 15.6 kipsD3 15 8 23 ft, Rn-BB3 Rn-BB2 (2.8 kips/ft) (8 ft) 15.6 22.4 38.0 kipsD4 23 65 88 ft, Rn-BB4 Rn-BB3 (3.2 kips/ft) (65 ft) 38.0 208.0 246.0 kipsA graphic presentation of the estimated nominal geotechnical resistance per pile versus depth ispresented below.8
Track 1, Example 1-a plot of nominal geotechnical resistance versus depthFrom the graph the depth below the footing necessary to achieve 197 kips is about 73 feet andmay be computed as follows:DL 23 (197-38.0)/3.2 72.7 feetThe contract pile length includes a 2-foot embedment in the footing [BDM Table 6.2.5] and a 1foot allowance for cutoff due to driving damage [BDM 6.2.4.2].L 72.7 2 1 75.7 feetThe length for steel H-piles is specified in 5-foot increments [BDM 6.2.4.2]. Therefore, thecontract pile length is 75 feet, with 72 feet embedded.At this point the embedded pile length is known, and it is necessary to check the resistancefactor.% cohesive soil [(72-9)/72] (100) 88% 70%Therefore, the resistance factor for cohesive soil is the correct choice. If the resistance factorwere incorrect the engineer would need to repeat Steps 6 and 7 (although in this example themixed soil classification would not result in numerical changes).9
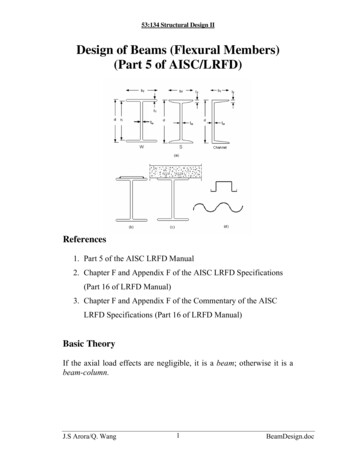
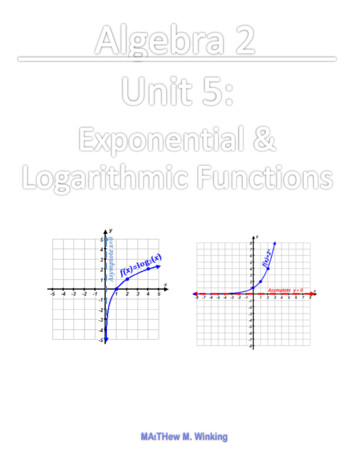
Step 8 - Estimate target nominal pile driving resistance, Rndr-TFor a driven H-pile with no planned retap and use of a WEAP analysis for construction control,the following resistance factors, φ, are recommended to estimate the target nominal pile drivingresistance [BDM Table 6.2.9-3].φEOD 0.65 for cohesive soil, averaged over the full depth of estimated pile penetrationφSETUP 0.20 for cohesive soil, averaged over the full depth of estimated pile penetrationφ 0.65 for mixed soil, averaged over the full depth of estimated pile penetrationφ 0.55 for non-cohesive soil, averaged over the full depth of estimated pile penetrationThe nominal pile resistance during construction, Rn, will be determined at end of drive by scalingback 7-day setup gain, and then adjusting retaps to account for setup.ΣηγQ γDDDD φRn where η load modifier 1.0 from BDM 6.2.3.1Let Rn RT nominal pile resistance at time T (days) after EOD.R EOD where ηγQ γDD DDφEOD φSETUP (FSETUP 1) ηγQ γQ 128 kips, (Step 2)γDDDD 0 (no downdrag)FSETUP Setup Ratio RT/REODTo determine the setup ratio the soil profile was used to calculate the average SPT N-value forthe cohesive soil layers penetrated by the driven pile over the contract pile length, as follows.Calculated average SPT N-value [(6′)(4) (8′)(11) (72′-23′)(12)]/(72′-9′) 11The average SPT N-value of 11 yields a Setup Ratio, FSETUP, of 1.47 for 1-day retap, 1.55 for 3day retap and 1.61 for 7-day retap from the graph shown below [BDM Figure 6.2.10].10
2.11-Day23-Day7-Day1.9FSETUP1.81.71.611.61.551.5 1.471.41.310110203040Average SPT N-value, NaTrack 1, Example 1-pile setup factor chart [BDM Figure 6.2.10]LetφTAR Resistance factor for target nominal resistance 1.00and φEOD φSETUP (FSETUP 1),Rndr-T REODThe target pile driving resistance at end of drive isR ndr T R EOD ηγQ γDD DDφTAR ηγQ γDD DDφEOD φSETUP (FSETUP 1)128 0128 (0.65) (0.20)(1.61 1) 0.77 166 kips 83 tons11Note that φTAR 1.00, OK50
The target nominal geotechnical resistance at 1-day retap then is:R1-day (166.0)(1.47) 244 kips 122 tons, but not more than R ndr T computed withφEOD , not considering setup.R1-day (128 0)/0.65 197 kips 99 tonsThe 99 tons controls and also will control 3-day and 7-day retaps (which otherwise wouldbe 129 tons and 134 tons, respectively).Step 9 – Prepare CADD notes for the bridge plansAt this point the final design engineer selects the appropriate CADD notes for the abutment andpier plan sheets and adds the specific pile load values to the notes [BDM 13.8.2].E818: Abutment piles, LRFD contract length and resistanceTHE CONTRACT LENGTH OF 75 FEET FOR THE WEST ABUTMENT PILES ISBASED ON A COHESIVE SOIL CLASSIFICATION, A TOTAL FACTORED AXIALLOAD PER PILE (PU) OF 128 KIPS, AND A GEOTECHNICAL RESISTANCEFACTOR (PHI) OF 0.65.THE NOMINAL AXIAL BEARING RESISTANCE FOR CONSTRUCTIONCONTROL WAS DETERMINED FROM A COHESIVE SOIL CLASSIFICATIONAND A GEOTECHNICAL RESISTANCE FACTOR (PHI) OF 0.77. PILES AREASSUMED TO BE DRIVEN FROM A START ELEVATION AT THE BOTTOM OFFOOTING.E819: Abutment piles, driving and construction controlTHE REQUIRED NOMINAL AXIAL BEARING RESISTANCE FOR WESTABUTMENT PILES IS 83 TONS AT END OF DRIVE. IF RETAPS ARENECESSARY TO ACHIEVE BEARING, THE REQUIRED NOMINAL AXIALBEARING RESISTANCE IS 99 TONS AT ONE-DAY OR LATER RETAPS. THEPILE CONTRACT LENGTH SHALL BE DRIVEN AS PER PLAN UNLESS PILESREACH REFUSAL. CONSTRUCTION CONTROL REQUIRES A WEAP ANALYSISWITH BEARING GRAPH.Step 10 – Check the designWithin the Bridges and Structures Bureau at the Iowa DOT a final design engineer other than thebridge designer is assigned to give the bridge design an independent check at the time final plansare complete. During the checking process a final design engineer will review the soils packageto ensure that all recommendations were followed and also will check structural, geotechnical,and drivability aspects of the design.12
Other design organizations may perform checks at various stages of design rather than upon -----END DESIGN ----------------------------------BEGIN CONSTRUCTION PHASE-------------------------------------Step 11 – Request and check contractor’s hammer data, and prepare bearing graph forWEAP controlAfter the bridge contract is let and prior to start of pile driving, the contractor completes HammerData sheets for the pile driving hammer that he/she plans to use. The Hammer Data sheetsinclude all pertinent information including the cap (helmet) number and hammer identificationinformation with details, hammer cushion, and pile cushion (where required), as well as pile size,pile length, and estimated pile driving resistance. The Construction and Materials Bureau usesthe data received to complete a WEAP analysis for construction control during pile driving.Results from the WEAP analysis are then used to prepare an LRFD Bearing Graph (without thefactor of safety used for allowable stress design). The Bearing Graph includes curves of nominaldriving resistance versus blows per foot, and identifies specific driving conditions, where drivingstress is a concern. The figure below is the LRFD Bearing Graph for the west abutment.13
Track 1, Example 1-general WEAP bearing graph14
Step 12 - Observe construction, record driven resistance, and resolve any constructionissuesDuring pile driving, the construction inspector records the hammer stroke and number of blowsto advance the pile an equivalent penetration of 1 foot, and then converts the recordedinformation with the Bearing Graph to record the driven resistance per pile at EOD. Thisinformation is shown for this example in the English Log of Piling Driven with Wave Equationbelow.If the recorded pile driving resistance at EOD is less than the target pile nominal drivingresistance, then the pile is retapped about 24 hours after EOD. (The retap is a remedial measurethat makes use of setup for an individual pile. If the 24-hour retap does not indicate enoughdriven resistance, an extension will be added. An extension is expensive, and the designer shouldnot overestimate the benefit of setup.)For example, at EOD for the planned pile embedment length at Pile 1, the construction inspectorrecorded a hammer stroke of 7-1/2 feet and a blow count of 30 blows per foot for the last foot ofpile penetration, as shown on the log below. Based on the Bearing Graph the constructioninspector recorded a driving resistance of 88 tons, which is greater than the target drivingresistance of 83 tons.Pile 4 illustrates the use of pile retaps. At EOD at Pile 4, the construction inspector recorded adriving res
As the first example in the Design Guide, this example provides detailed calculations that are not included in all other examples, such as: . This design example illustrates design of displacement pipe piles that developfrictional resistance in non-cohesive s


![20160924 修正版 System Keisoku ENG.ppt [互換モード]](/img/4/companyprofileinenglish.jpg)