Transcription
MATLAB commands in numerical PythonVidar Bronken Gundersen /mathesaurus.sf.netIDL commands in numerical PythonCopyright c Vidar Bronken GundersenPermission is granted to copy, distribute and/or modify this document as long as the above attribution is kept and the resulting work is distributed under a license identical to this one.Contributor: Gary RubenThe idea of this document (and the corresponding xml instance) is to provide a quick reference for switching from idlto an open-source environment, such as gdl, Python, R or Octave and Gnuplot for numeric processing and data visualisation.Time-stamp: - - T : : vidar1HelpDesc.Browse help interactivelyIDL?Pythonhelp()Help on using helpHelp for a functionHelp for a toolbox/library packageDemonstration examples?help?plot or man,’plothelphelp(plot) or ?plothelp(pylab)1.1Searching available documentationDesc.Search help filesList available packagesLocate functions1.2IDLPythonhelp(); modules [Numeric]help(plot)matlab/Octavelookfor plothelpwhich plotUsing interactivelyDesc.Start sessionAuto completionRun code from fileCommand historySave command historyEnd session2demomatlab/OctavedocOctave: help -i % browse with Infohelp help or doc dochelp plothelp splines or doc splinesdemoIDLidlde@"foo.idlbatch" or .run ’foo.pro’help,/recjournal,’IDLhistory’exit or CTRL-DPythonipython -pylabTABexecfile(’foo.py’) or run foo.pyhist -nCTRL-DCTRL-Z # windowssys.exit()matlab/OctaveOctave: octave -qOctave: TAB or M-?foo(.m)Octave: historydiary on [.] diary offexit or quitOperatorsDesc.Help on operator syntaxIDLPythonmatlab/Octavehelp - References: Hankin, Robin. R for Octave users ( ), available from - .txt (accessed . . ); Martelli, Alex. Python in a Nutshell (O’Reilly, );Oliphant, Travis. Guide to NumPy (Trelgol, ); Hunter, John. The Matplotlib User’s Guide ( ), available from http://matplotlib.sf.net/ (accessed . . ); Langtangen, Hans Petter. PythonScripting for Computational Science (Springer, ); Ascher et al.: Numeric Python manual ( ), available from http://numeric.scipy.org/numpy.pdf (accessed . . ); Moler, Cleve. NumericalComputing with MATLAB (MathWorks, ), available from http://www.mathworks.com/moler/ (accessed . . ); Eaton, John W. Octave Quick Reference ( ); Merrit, Ethan. Demo scripts forgnuplot version 4.0 ( ), available from http://gnuplot.sourceforge.net/demo/ (accessed . . ); Woo, Alex. Gnuplot Quick Reference ( ), available from http://www.gnuplot.info/docs/gpcard.pdf(accessed . . ); Venables & Smith: An Introduction to R ( ), available from http://cran.r-project.org/doc/manuals/R-intro.pdf (accessed . . ); Short, Tom. R reference card ( ), availablefrom http://www.rpad.org/Rpad/R-refcard.pdf (accessed . . ); Greenfield, Jedrzejewski & Laidler. Using Python for Interactive Data Analysis ( ), pp. – , available fromhttp://stsdas.stsci.edu/perry/pydatatut.pdf (accessed . . ); Brisson, Eric. Using IDL to Manipulate and Visualize Scientific Data, available from http://scv.bu.edu/Tutorials/IDL/ (accessed . . ).1
MATLAB commands in numerical PythonVidar Bronken Gundersen /mathesaurus.sf.net2.1Arithmetic operatorsDesc.Assignment; defining a er, abIDLa 1 & b 1a ba - ba * ba / ba bRemaindera MOD bIncrement, return new valueIncrement, return old valueIn place operation to save array creationoverheadFactorial, n! a or a 1a a 12.2a b or add(a,b,a)rem(a,b)Octave: aOctave: a Octave: a 1factorial(a)IDLa eqa lta gta lea gea nebbbbbbPythona b or equal(a,b)a b or less(a,b)a b or greater(a,b)a b or less equal(a,b)a b or greater equal(a,b)a ! b or not equal(a,b)matlab/Octavea ba ba ba ba ba bPythona and ba or blogical and(a,b) or a and blogical or(a,b) or a or blogical xor(a,b)logical not(a) or not amatlab/Octavea && ba ba & b or and(a,b)a b or or(a,b)xor(a, b) a or not(a)Octave: a or g10(a)math.log(a, 2(a)exp(a)Logical operatorsDesc.Short-circuit logical ANDShort-circuit logical ORElement-wise logical ANDElement-wise logical ORLogical EXCLUSIVE ORLogical NOTIDLa and ba or ba xor bnot aTrue if any element is nonzeroTrue if all elements are nonzero2.4matlab/Octavea 1; b 2;a ba - ba * ba / ba . bRelational operatorsDesc.EqualLess thanGreater thanLess than or equalGreater than or equalNot Equal2.3Pythona 1; b 1a b or add(a,b)a - b or subtract(a,b)a * b or multiply(a,b)a / b or divide(a,b)a ** bpower(a,b)pow(a,b)a % bremainder(a,b)fmod(a,b)root and logarithmDesc.Square rootLogarithm, base e (natural)Logarithm, base Logarithm, base (binary)Exponential functionIDLsqrt(a)alog(a)alog10(a)exp(a) aln a loge alog10 alog2 aea2
MATLAB commands in numerical PythonVidar Bronken Gundersen /mathesaurus.sf.net2.5Round offDesc.RoundRound upRound downRound towards zero2.6Pythonmath.pimath.e or s infminus infplus zerominus zeromatlab/OctaveNaNInfIDLcomplex(0,1)z complex(3,4)abs(z)real part(z)imaginary(z)Pythonz 1jz 3 4j or z complex(3,4)abs(3 4j)z.realz.imagconj(z)z.conj(); z.conjugate()matlab/Octaveiz 3 b,a)matlab/Octaveatan(a,b)IDL!piexp(1)Complex numbersDesc.Imaginary unitA complex number, 3 4iAbsolute value (modulus)Real partImaginary partArgumentComplex x(a)Missing values; IEEE-754 floating point status flagsDesc.Not a NumberInfinity, Infinity, Infinity, Plus zero, 0Minus zero, 02.7Pythonaround(a) or math.round(a)ceil(a)floor(a)fix(a)Mathematical constantsDesc.π 3.141592e 2.7182812.6.1IDLround(a)ceil(a)floor(a) 1TrigonometryDesc.Arctangent, arctan(b/a)Hypotenus; Euclidean distance2.9i phypot(x,y)Generate random numbersDesc.Uniform distributionIDLrandomu(seed, matlab/Octaverand(1,10)Uniform: Numbers between and 2 5*randomu(seed, 10)random.uniform(2,7,(10,))2 5*rand(1,10)Uniform: , and(6)Normal distributionrandomn(seed, 10)random.standard normal((10,))randn(1,10)x2 y 23
MATLAB commands in numerical PythonVidar Bronken Gundersen /mathesaurus.sf.net3VectorsDesc.Row vector, 1 n-matrixColumn vector, m 1-matrix3.1 . , . , . , . , . , , , , , , . , , , , Linearly spaced vector of n pointsReverseSet all values to same scalar valuePythonarange(1,11, dtype 0,0,-1)arange(10,0,-3)linspace(1,10,7)a[::-1] ora.fill(3), a[:] 1,10,7)reverse(a)a(:) 3IDL[a,a] or rebin(a,2,size(a))[indgen(3) ),a), axis 1)matlab/Octave[a a][1:4 a]IDLPythonconcatenate((a,a))a.repeat(3) ora.repeat(a) ormatlab/Octave[a ((a,b)).max()v,i a.max(0),a.argmax(0)matlab/Octavemax(a,b)max([a b])[v,i] max(a)reverse(a)Miss those elements outDesc.miss the first elementmiss the tenth elementlast elementlast two elements3.5IDLindgen(10) 1dindgen(10) 1dindgen(10)indgen(4)*3 1RepeatingDesc. , , , , , 3.4matlab/Octavea [2 3 4 5];adash [2 3 4 5]’;Concatenation (vectors)Desc.Concatenate two vectors3.3Pythona 2,3,4,5]).reshape(-1,1)r [1:10,’c’]SequencesDesc. , , , . , 3.2IDLa [2, 3, 4, 5]transpose([2,3,4,5])IDLMaximum and minimumDesc.pairwise maxmax of all values in two vectorsIDL4
MATLAB commands in numerical PythonVidar Bronken Gundersen /mathesaurus.sf.net3.6Vector multiplicationDesc.Multiply two vectorsVector cross product, u vVector dot product, u · ssp(u,v)MatricesDesc.IDLPythonmatlab/OctaveDefine a matrixa [[2,3],[4,5]]a array([[2,3],[4,5]])a [2 3;4 5]4.12435i 000000000000000 11199910040083411199901005015911199900100667211199 9111999 Concatenation (matrices); rbind and cbindDesc.Bind rowsIDLPythonmatlab/Octaveconcatenate((a,b), axis 0)[a ; b]vstack((a,b))concatenate((a,b), axis 1)[a , b]hstack((a,b))concatenate((a,b), axis 2)dstack((a,b))concatenate((a,b), axis None)[a(:), b(:)]concatenate((r [1:5],r [1:5])).reshape(2,-1)[1:4 ; 1:4]vstack((r [1:5],r [1:5]))[1:4 ; 1:4]’Desc.IDLPythonmatlab/Octave filled arraydblarr(3,5)zeros((3,5),Float)zeros(3,5) filled array of integersintarr(3,5)zeros((3,5)) filled arraydblarr(3,5) 1ones((3,5),Float)Any number filled arrayintarr(3,5) 9Identity matrixidentity(3)identity(3)eye(3)Diagonaldiag matrix([4,5,6])diag((4,5,6))diag([4 5 6])Bind columnsBind slices (three-way arrays)Concatenate matrices into one vectorBind rows (from vectors)Bind columns (from vectors)4.2hArray creationones(3,5) ones(3,5)*9 Magic squares; Lo ShuEmpty arraymagic(3)a empty((3,3)) 5
MATLAB commands in numerical PythonVidar Bronken Gundersen /mathesaurus.sf.net4.3Reshape and flatten matricesDesc.IDLPythonmatlab/OctaveReshaping (rows hape(2,3)reshape(1:6,3,2)’;Reshaping (columns first)arange(1,7).reshape(-1,2).transpose() reshape(1:6,2,3);Flatten to vector (by rows, like comics)a.flatten() ora’(:)Flatten to vector (by columns)a.flatten(1)a(:)Flatten upper triangle (by columns)4.4142536ih123456i 123456142536vech(a)IDLPythonb a.copy()matlab/Octaveb aIndexing and accessing elements (Python: slicing)Desc.IDLPythonmatlab/OctaveInput is a , arrayElement , (row,col)First rowa [[ 11, 12, 13, 14 ], [ 21, 22, 23, 24 ], [ 31, 32, 33, 34 ]]a(2,1)a(*,0)a array([[ 11, 12, 13, 14 ],[ 21, 22, 23, 24 ],[ 31, 32, 33, 34 ]])a[1,2]a[0,]a [ 11 12 13 14 .21 22 23 24 .31 32 33 34 ]a(2,3)a(1,:)First columna(0,*)a[:,0]a(:,1)a.take([0,2]).take([0,3], axis 1)a([1 3],[1 4]);a[1:,]a(2:end,:)Last two rowsa[-2:,]a(end-1:end,:)Strides: Every other rowa[::2,:]a(1:2:end,:)Third in last dimension (axis)a[.,2]Array as indicesAll, except first row ha(*,1:*)hhRemove one columna.take([0,2,3],axis 1)Diagonala.diagonal(offset 0)a(:,[1 3 4]) AssignmentDesc.IDLClipping: Replace all elements over a 90Clip upper and lower valuesa 2 5Pythona[:,0] 99a[:,0] array([99,98,97])(a 90).choose(a,90)a.clip(min None, max 90)a.clip(min 2, max 5)matlab/Octavea(:,1) 99a(:,1) [99 98 97]’a(a 90) 90;a11a21a31a 23 a11a11a21h a31a11a31 4.6 Shared data (slicing)Desc.Copy of a4.5ha12a22a32a13a23a33a14a24a34 a12a13a14 3a22a14a24a34a33ii a44 6
MATLAB commands in numerical PythonVidar Bronken Gundersen /mathesaurus.sf.net4.7Transpose and t(a) orlinalg.inv(a) orlinalg.pinv(a)norm(a)linalg.eig(a)[0]a.’ or ,w,U,Vlinalg.svd(a)svd(a)Cholesky eig(a)[1]chol(a)[v,l] eig(a)Rankrank(a)rank(a)Pythona.sum(axis 0)a.sum(axis 1)a.sum()a.trace(offset 0)a.cumsum(axis Pythonmatlab/OctaveNon-conjugate nvaluesSingular values4.8determ(a)invert(a)SumDesc.Sum of each columnSum of each rowSum of all elementsSum along diagonalCumulative sum total(a)SortingDesc.IDLExample dataa array([[4,3,2],[2,8,6],[1,4,7]]) a [ 4 3 2 ; 2 8 6 ; 1 4 7 ]Flat and sorteda.ravel().sort() orsort(a(:))a.sort(axis 0) or msort(a)sort(a)Sort each rowa.sort(axis 1)sort(a’)’Sort rows (by first row)a[a[:,0].argsort(),]sortrows(a,1)Sort, return indicesSort each column, return indicesSort each row, return indicesa.ravel().argsort()a.argsort(axis 0)a.argsort(axis 1) Sort each columnsort(a) 421136124221124384247348364483267248267487762 7
MATLAB commands in numerical PythonVidar Bronken Gundersen /mathesaurus.sf.net4.10Maximum and minimumDesc.max in each columnmax in each rowmax in arrayreturn indices, ipairwise maxIDLmax(a,DIMENSION 2)max(a,DIMENSION 1)max(a)maximum(b,c)max-to-min range4.11a.ptp(); ular, upperTriangular, lowerPythonfliplr(a) or a[:,::-1]flipud(a) or )Octave: kron(ones(2,3),a)triu(a)tril(a)Equivalents to ”size”Desc.Matrix dimensionsNumber of columnsNumber of elementsNumber of dimensionsNumber of bytes used in v i] max(a)max(b,c)cummax(a)Matrix manipulationDesc.Flip left-rightFlip up-downRotate degreesRepeat matrix: [ a a a ; a a a ]4.12Pythona.max(0) or amax(a [,axis 0])a.max(1) or amax(a, axis 1)a.max() orIDLsize(a)s size(a) & s[1]n elements(a)Pythona.shape or a.getshape()a.shape[1] or size(a, axis 1)a.size or size(a[, axis None])a.ndima.nbytesmatlab/Octavesize(a)size(a,2) or length(a)length(a(:))ndims(a)Matrix- and elementwise- multiplicationDesc.IDLElementwise operationsMatrix product (dot product)Inner matrix vector multiplication a · b0a # b or b ## atranspose(a) # bPythonmatlab/Octavea * b or multiply(a,b)a .* bmatrixmultiply(a,b)a * bh19h71551112341339hinner(a,b) or"Outer producta # bouter(a,b) or"Kronecker productMatrix division, b·a 1Left matrix division, b 1 ·a(solve linear equations)Vector dot productCross ,b)a / ba \ bvdot(a,b)cross(a,b)i516i1022i1125#23446869 128 12 16#22446864812 12 16Ax b8
MATLAB commands in numerical PythonVidar Bronken Gundersen /mathesaurus.sf.net4.14Find; conditional indexingDesc.Non-zero elements, nd(a)Non-zero elements, array indiceswhere(a NE 0)(i,j) a.nonzero()(i,j) where(a! 0)[i j] find(a)Vector of non-zero valuesa(where(a NE 0))v a.compress((a! 0).flat)v extract(a! 0,a)[i j v] find(a)Condition, indiceswhere(a GE 5.5)(a 5.5).nonzero()find(a 5.5)Return valuesa(where(a GE 5.5))a.compress((a 5.5).flat)where(a 5.5,0,a) or a * (a 5.5)a.put(2,indices)Zero out elements above . Replace values5Multi-way arraysDesc.Define a -way array6a .* (a 5.5)IDLPythonmatlab/Octavea array([[[1,2],[1,2]], [[3,4],[3,4]]])a cat(3, [1 2; 1 2],[3 4; 3 4]);a[0,.]a(1,:,:)File input and outputDesc.Reading from a file ( d)Reading from a file ( d)Reading fram a CSV file ( d)Writing to a file ( d)Writing to a file ( d)Reading from a file ( d)IDLread()Pythonmatlab/Octavef fromfile("data.txt")f load(’data.txt’)f load("data.txt")read()f load("data.txt")f load(’data.txt’)x read ascii(data start 1,delimiter ’;’)f load(’data.csv’, delimiter ’;’) x dlmread(’data.csv’, ’;’)save(’data.csv’, f, fmt ’%.6f’, delimiter ’;’)save -ascii data.txt ff.tofile(file ’data.csv’, format ’%.6f’, sep ’;’)f fromfile(file ’data.csv’, sep ’;’)9
MATLAB commands in numerical PythonVidar Bronken Gundersen /mathesaurus.sf.net7Plotting7.1Basic x-y plotsDesc.IDLPythonmatlab/Octave43210-1-2-3-4 d line plotplot, aplot(a)020406080100plot(a)4.54.03.53.02.52.04.0 d scatter plotplot, x(1,*), ’o’)76543214.0Two graphs in one plotOverplotting: Add new plots to currentsubplotsPlotting symbols and color7.1.1plot, x1, y1oplot, x2, y2!p.multi(0,2,1)plot, x,y, line 1, psym -1plot(x1,y1,’bo’, ��)show() # as normalsubplot(211)plot(x,y,’ro-’)plot(x1,y1, x2,y2)plot(x1,y1)hold /Octavegrid onaxis equalOctave:axis(’equal’)replotaxis([ 0 10 0 5 ])Axes and titlesDesc.Turn on grid lines : aspect ratioIDLPythongrid()figure(figsize (6,6))Set axes manuallyplot, x(1,*), x(2,*),xran [0,10], yran [0,5]plot, x,y, title ’title’,xtitle ’x-axis’, ytitle ’y-axis’axis([ 0, 10, 0, 5 ])xyouts, 2,25, ’hello’text(2,25,’hello’)Axis labels and titlesInsert ��y-axis’)10
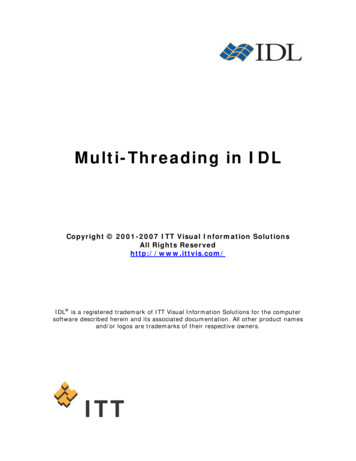
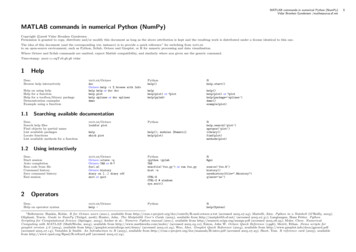
MATLAB commands in numerical PythonVidar Bronken Gundersen /mathesaurus.sf.net7.1.2Log plotsDesc.logarithmic y-axislogarithmic x-axislogarithmic x and y axes7.1.3IDLplot, x,y, /YLOG or plot io, x,yplot, x,y, /XLOG or plot oi, x,yplot oo, Octavefill(t,s,’b’, t,c,’g’, alpha 0.2)fill(t,s,’b’, t,c,’g’)Octave: % fill has a bug?Pythonmatlab/Octavef inline(’sin(x/3) - cos(x/5)’)Filled plots and bar plotsDesc.Filled plot7.1.4FunctionsIDL x3f (x) sin 0.5 f (x) 0.5 1.0 0.0 x5 cos1.0Desc.Defining functions 1.5 2.0 0Plot a function for given range7.2Desc.x arrayrange(0,40,.5)y sin(x/3) - cos(x/5)plot(x,y, ’o’)ezplot(f,[0,40])fplot(’sin(x/3) - cos(x/5)’,[0,40])Octave: % no ezplotPythontheta arange(0,2*pi,0.001)r sin(2*theta)matlab/Octavetheta 0:.001:2*pi;r sin(2*theta);102030xPolar plotsIDLρ(θ) sin(2θ)90135451800225315270polar(theta, rho)polar(theta, rho) 4011
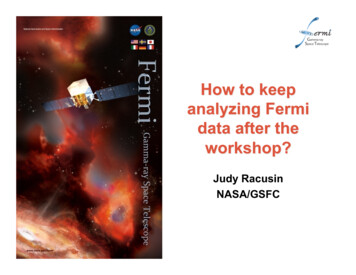
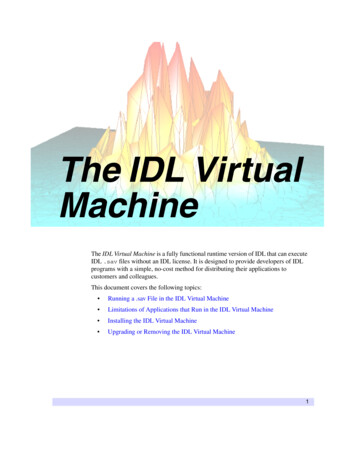
MATLAB commands in numerical PythonVidar Bronken Gundersen /mathesaurus.sf.netHistogram plotsDesc.7.47.4.1IDLplot, randn(1000,1))hist(randn(1000,1), -4:4)plot(sort(a))IDLPythonmatlab/Octave3d dataContour and image .0-1-0.2-2Contour plotcontour, z-2-1012-2-1012levels, colls contour(Z, V,contour(z)origin ’lower’, extent (-3,3,-3,3))clabel(colls, levels, inline 1,fmt ’%1.1f’, fontsize 10)210-1-2contour, z, nlevels 7, /fillcontourf(Z, V,contour, z, nlevels 7, /overplot, /downhillcmap cm.gray,origin ’lower’,extent (-3,3,-3,3))contourf(z); colormap(gray)Plot image datatv, zloadct,0image(z)colormap(gray)im imshow(Z,interpolation ’bilinear’,origin ’lower’,extent lled contour plot1.0-1-0.2-2-2Image with contoursDirection field vectors# imshow() and contour() as abovequiver()quiver()-101212
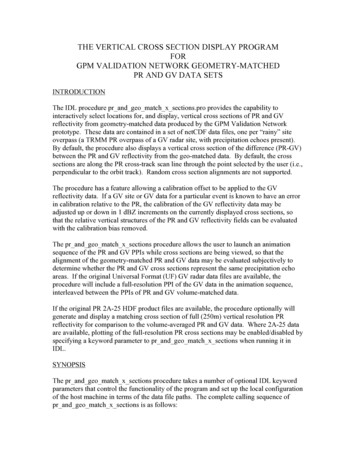
MATLAB commands in numerical PythonVidar Bronken Gundersen /mathesaurus.sf.net7.4.2Perspective plots of surfaces over the x-y planeDesc.IDLPythonmatlab/Octaven arrayrange(-2,2,.1)[x,y] meshgrid(n,n)z x*power(math.e,-x**2-y**2)n -2:.1:2;[x,y] meshgrid(n,n);z x.*exp(-x. 2-y. 2);2 y 2f (x, y) xe x0.40.2z0.02 0.21 0.4 2y0 10 1x12Mesh plotsurface, z 2mesh(z)0.40.2z0.02 0.21 0.4 2y0 10 1x12Surface plot7.4.3 2surf(x,y,z) or surfl(x,y,z)Octave: % no surfl()shade surf, zloadct,3Scatter (cloud) -2010-40 d scatter plot-60 0plot3(x,y,z,’k ’)13
MATLAB commands in numerical PythonVidar Bronken Gundersen /mathesaurus.sf.net7.5Save plot to a graphics fileDesc.PostScriptIDLset plot,’PS’device, file ’foo.eps’, /landplot x,ydevice,/close & set plot,’win’PDFSVG (vector graphics for www)PNG (raster png’)matlab/Octaveplot(1:10)print -depsc2 foo.epsOctave:gset output "foo.eps"gset terminal postscript epsplot(1:10)print -dpng foo.pngData analysisSet membership operatorsDesc.Create setsPythona array([1,2,2,5,2])b array([2,3,4])a set([1,2,2,5,2])b ea [ 1 2 2 5 2 ];b [ 2 3 4 ];Set unionunion1d(a,b)a.union(b)union(a,b)Set ct(a,b)Set )Set exclusionsetxor1d(a,b)a.symmetric difference(b)2 in asetmember1d(2,a)contains(a,2)setxor(a,b)Set uniqueTrue for set memberIDLunique(a)ismember(2,a) 125 14
MATLAB commands in numerical PythonVidar Bronken Gundersen n(a)Pythona.mean(axis 0)mean(a [,axis 0])median(a) or median(a [,axis 0])a.std(axis 0) or std(a [,axis 0])a.var(axis 0) or var(a)correlate(x,y) or corrcoef(x,y)cov(x,y)MedianStandard deviationVarianceCorrelation y)Linear least squares y ax bPython(a,b) polyfit(x,y,1)plot(x,y,’o’, x,a*x b,’-’)linalg.lstsq(x,y)matlab/Octavez polyval(polyfit(x,y,1),x)plot(x,y,’o’, x,z ,’-’)a x\yPolynomial matlab/Octave8.3Interpolation and regressionDesc.Straight line fit8.48.4.1IDLpoly fit(x,y,1)Non-linear methodsPolynomials, root findingDesc.PolynomialFind zeros of polynomialFind a zero near x 1IDLroots([1 -1 -1])f inline(’1/x - (x-1)’)fzero(f,1)solve(’1/x al([1 2 1 2],1:10)Solve symbolic equationsEvaluate polynomial8.4.2Differential equationsDesc.Discrete difference function and approximate derivativeSolve differential equations8.5IDLPythondiff(x, n 1, axis ol()Pythonfft(a) orifft(a) lab/Octavefactor()Fourier analysisDesc.Fast fourier transformInverse fourier transformLinear convolution9matlab/Octavemean(a)Symbolic algebra; calculusDesc.FactorizationIDLx2 x 1 01 (x 1)f (x) x1x x 115
MATLAB commands in numerical PythonVidar Bronken Gundersen /mathesaurus.sf.net10ProgrammingDesc.Script file extensionComment symbol (rest of line)IDL.idlbatch;Python.py#Import library functionsfrom pylab import *Evalstring "a ne for statements10.2Pythonfor i in range(1,6): print(i)for i in range(1,6):print(i)print(i*2)matlab/Octavefor i 1:5; disp(i); endfor i 1:5disp(i)disp(i*2)endIDLif 1 gt 0 then a 100if 1 gt 0 then a 100 else a 0a 0?a:0Pythonif 1 0: a 100matlab/Octaveif 1 0 a 100; endif 1 0 a 100; else a 0; endIDLPythona 0?a : 0DebuggingDesc.Most recent evaluated expressionList variables loaded into memoryClear variable x from memoryPrint10.4IDLfor k 1,5 do print,kfor k 1,5 do begin print, i & print, i*2 & ernary operator (if?true:false)10.3matlab/Octave.m%Octave: % or #% must be in MATLABPATHOctave: % must be in LOADPATHstring ’a 234’;eval(string)print amatlab/Octaveanswhos or whoclear x or clear ’)os.popen(’notepad’)matlab/Octavedir or lswhatpwdcd foo!notepadOctave: system("notepad")helpprint, aWorking directory and OSDesc.List files in directoryList script files in directoryDisplays the current working directoryChange working directoryInvoke a System CommandIDLdirsdcd,’foo or sd,’foospawn,’notepad’ This document is still draft quality. Most shown d plots are made using Matplotlib, and d plots using R and Gnuplot, provided as examples only. Version numbers and download url for software used: Python . . , http://www.python.org/; NumPy . . , http://numeric.scipy.org/; Matplotlib . , http://matplotlib.sf.net/; IPython . . ,http://ipython.scipy.org/; Octave . . , http://www.octave.org/; Gnuplot . , http://www.gnuplot.info/. For referencing: Gundersen, Vidar Bronken. MATLAB commands in numerical Python (Oslo/Norway, ), available from: http://mathesaurus.sf.net/ Contributions are appreciated: The best way to do this is to edit the xml and submit patches to our tracker or forums.16
MATLAB commands in numerical Python 5 Vidar Bronken Gundersen /mathesaurus.sf.net 3.6 Vector multiplication Desc. IDL Python matlab/Octave Multiply two vectors a*a a.*a Vector cross product, u v crossp(u,v) Vector dot product, u · v dot(u,v) dot(u,v) 4 Matrices Desc. IDL Python matlab/Octave