Transcription
MATLAB commands in numerical Python (NumPy)Vidar Bronken Gundersen /mathesaurus.sf.netMATLAB commands in numerical Python (NumPy)Copyright c Vidar Bronken GundersenPermission is granted to copy, distribute and/or modify this document as long as the above attribution is kept and the resulting work is distributed under a license identical to this one.The idea of this document (and the corresponding xml instance) is to provide a quick reference for switching from matlabto an open-source environment, such as Python, Scilab, Octave and Gnuplot, or R for numeric processing and data visualisation.Where Octave and Scilab commands are omitted, expect Matlab compatibility, and similarly where non given use the generic command.Time-stamp: - - T : : vidar1HelpDesc.Browse help interactivelyHelp on using helpHelp for a functionHelp for a toolbox/library packageDemonstration examplesExample using a function1.1helphelp(plot) or ?plothelp(pylab)help()help(plot) or ?plothelp(package for plotPythonhelpwhich plothelp(); modules /OctaveOctave: octave -qOctave: TAB or M-?foo(.m)Octave: historydiary on [.] diary offexit or quitPythonipython -pylabTABexecfile(’foo.py’) or run foo.pyhist -nmatlab/Octavehelp -PythonUsing interactivelyDesc.Start sessionAuto completionRun code from fileCommand historySave command historyEnd session2Rhelp.start()Searching available documentationDesc.Search help filesFind objects by partial nameList available packagesLocate functionsList available methods for a function1.2Pythonhelp()matlab/OctavedocOctave: help -i % browse with Infohelp help or doc dochelp plothelp splines or doc splinesdemoCTRL-DCTRL-Z # savehistory(file ".Rhistory")q(save ’no’)OperatorsDesc.Help on operator syntaxRhelp(Syntax) References: Hankin, Robin. R for Octave users ( ), available from - .txt (accessed . . ); Martelli, Alex. Python in a Nutshell (O’Reilly, );Oliphant, Travis. Guide to NumPy (Trelgol, ); Hunter, John. The Matplotlib User’s Guide ( ), available from http://matplotlib.sf.net/ (accessed . . ); Langtangen, Hans Petter. PythonScripting for Computational Science (Springer, ); Ascher et al.: Numeric Python manual ( ), available from http://numeric.scipy.org/numpy.pdf (accessed . . ); Moler, Cleve. NumericalComputing with MATLAB (MathWorks, ), available from http://www.mathworks.com/moler/ (accessed . . ); Eaton, John W. Octave Quick Reference ( ); Merrit, Ethan. Demo scripts forgnuplot version 4.0 ( ), available from http://gnuplot.sourceforge.net/demo/ (accessed . . ); Woo, Alex. Gnuplot Quick Reference ( ), available from http://www.gnuplot.info/docs/gpcard.pdf(accessed . . ); Venables & Smith: An Introduction to R ( ), available from http://cran.r-project.org/doc/manuals/R-intro.pdf (accessed . . ); Short, Tom. R reference card ( ), availablefrom http://www.rpad.org/Rpad/R-refcard.pdf (accessed . . ).1
MATLAB commands in numerical Python (NumPy)Vidar Bronken Gundersen /mathesaurus.sf.net2.1Arithmetic operatorsDesc.Assignment; defining a er, abmatlab/Octavea 1; b 2;a ba - ba * ba / ba . bRemainderrem(a,b)Integer divisionIn place operation to save array creationoverheadFactorial, n!2.2a %% ba %/% bOctave: a 1a b or add(a,b,a)factorial(a)factorial(a)matlab/Octavea ba ba ba ba ba bPythona b or equal(a,b)a b or less(a,b)a b or greater(a,b)a b or less equal(a,b)a b or greater equal(a,b)a ! b or not equal(a,b)Ra ba ba ba ba ba ! bmatlab/Octavea && ba ba & b or and(a,b)a b or or(a,b)xor(a, b) a or not(a)Octave: a or !aany(a)all(a)Pythona and ba or blogical and(a,b) or a and blogical or(a,b) or a or blogical xor(a,b)logical not(a) or not aRa && ba ba & ba bxor(a, g(a, gical operatorsDesc.Short-circuit logical ANDShort-circuit logical ORElement-wise logical ANDElement-wise logical ORLogical EXCLUSIVE ORLogical NOTTrue if any element is nonzeroTrue if all elements are nonzero2.4Ra -1; b -2a ba - ba * ba / ba bRelational operatorsDesc.EqualLess thanGreater thanLess than or equalGreater than or equalNot Equal2.3Pythona 1; b 1a b or add(a,b)a - b or subtract(a,b)a * b or multiply(a,b)a / b or divide(a,b)a ** bpower(a,b)pow(a,b)a % bremainder(a,b)fmod(a,b)root and logarithmDesc.Square rootLogarithm, base e (natural)Logarithm, base Logarithm, base (binary)Exponential function aln a loge alog10 alog2 aea2
MATLAB commands in numerical Python (NumPy)Vidar Bronken Gundersen /mathesaurus.sf.net2.5Round offDesc.RoundRound upRound downRound towards s infminus infplus zerominus zeroRmatlab/Octaveiz 3 4iabs(z)real(z)imag(z)arg(z)conj(z)Pythonz 1jz 3 4j or z complex(3,4)abs(3 4j)z.realz.imagz.conj(); z.conjugate()R1iz - 3 4iabs(3 4i) or Mod(3 4i)Re(3 4i)Im(3 4i)Arg(3 4i)Conj(3 a)Complex numbersDesc.Imaginary unitA complex number, 3 4iAbsolute value (modulus)Real partImaginary partArgumentComplex conjugate2.8Pythonmath.pimath.e or math.exp(1)matlab/Octavepiexp(1)Missing values; IEEE-754 floating point status flagsDesc.Not a NumberInfinity, Infinity, Infinity, Plus zero, 0Minus zero, 02.7Rround(a)ceil(a)floor(a)Mathematical constantsDesc.π 3.141592e 2.7182812.6.1Pythonaround(a) or nd(a)ceil(a)floor(a)fix(a) 1TrigonometryDesc.Arctangent, arctan(b/a)Hypotenus; Euclidean distance2.9i phypot(x,y)Generate random numbersDesc.Uniform ndom((10,))random.uniform((10,))Rrunif(10)Uniform: Numbers between and 2 5*rand(1,10)random.uniform(2,7,(10,))runif(10, min 2, max 7)Uniform: , 36),6)Normal distributionrandn(1,10)random.standard normal((10,))rnorm(10)x2 y 23
MATLAB commands in numerical Python (NumPy)Vidar Bronken Gundersen /mathesaurus.sf.net3VectorsDesc.Row vector, 1 n-matrixColumn vector, m 1-matrixmatlab/Octavea [2 3 4 5];adash [2 3 4 5]’;Pythona 2,3,4,5]).reshape(-1,1)r [1:10,’c’]Ra - c(2,3,4,5)adash - t(c(2,3,4,5))Desc. , , , . , matlab/Octave1:10Rseq(10) or 1:10 . , . , . , . , . , , , , , , . , , , , Linearly spaced vector of n pointsReverseSet all values to same scalar e(a)a(:) 3Pythonarange(1,11, dtype 0,0,-1)arange(10,0,-3)linspace(1,10,7)a[::-1] ora.fill(3), a[:] 3matlab/Octave[a a][1:4 a), axis 1)Rc(a,a)c(1:4,a)matlab/Octave[a a]Pythonconcatenate((a,a))a.repeat(3) ora.repeat(a) orRrep(a,times 2)rep(a,each a[-2:]3.13.2SequencesConcatenation (vectors)Desc.Concatenate two vectors3.3RepeatingDesc. , , , , , 3.4Miss those elements outDesc.miss the first elementmiss the tenth elementmiss , , , .last elementlast two elements3.5seq(0,length 10)seq(1,10,by 3)seq(10,1) or 10:1seq(from 10,to 1,by -3)seq(1,10,length 7)rev(a)Maximum and minimumDesc.pairwise maxmax of all values in two vectorsmatlab/Octavemax(a,b)max([a b])[v,i] i a.max(0),a.argmax(0)Rpmax(a,b)max(a,b)v - max(a) ; i - which.max(a)4
MATLAB commands in numerical Python (NumPy)Vidar Bronken Gundersen /mathesaurus.sf.net3.6Vector multiplicationDesc.Multiply two vectorsVector dot product, u · tricesDesc.matlab/OctavePythonRDefine a matrixa [2 3;4 5]a 3,4,5), dim c(2,2))4.12435i 000000000000000 11199910040083411199901005015911199900100667211199 9111999 Concatenation (matrices); rbind and cbindDesc.Bind rowsmatlab/Octave[a ; b]Concatenate matrices into one vectorBind rows (from vectors)[a(:), b(:)][1:4 ; 1:4]Bind columns (from vectors)[1:4 ; 1:4]’PythonRconcatenate((a,b), axis 0)rbind(a,b)vstack((a,b))concatenate((a,b), axis 1)cbind(a,b)hstack((a,b))concatenate((a,b), axis 2)dstack((a,b))concatenate((a,b), axis None)concatenate((r [1:5],r [1:5])).reshape(2,-1)rbind(1:4,1:4)vstack((r [1:5],r [1:5]))cbind(1:4,1:4)Bind columns[a , b]Desc.matlab/OctavePythonR filled arrayzeros(3,5)zeros((3,5),Float)matrix(0,3,5) or array(0,c(3,5))Bind slices (three-way arrays)4.2hArray creation filled array of integerszeros((3,5)) filled arrayones(3,5)Any number filled arrayones(3,5)*9Identity matrixeye(3)ones((3,5),Float)matrix(1,3,5) or array(1,c(3,5)) matrix(9,3,5) or array(9,c(3,5)) identity(3)diag(1,3) Diagonaldiag([4 5 6])diag((4,5,6))diag(c(4,5,6)) Magic squares; Lo ShuEmpty arraymagic(3)a empty((3,3)) 5
MATLAB commands in numerical Python (NumPy)Vidar Bronken Gundersen /mathesaurus.sf.net4.3Reshape and flatten matricesDesc.matlab/OctavePythonRReshaping (rows )a.setshape(2,3)matrix(1:6,nrow 3,byrow T)Reshaping (columns first)reshape(1:6,2,3);Flatten to vector (by rows, like ) matrix(1:6,nrow 2)array(1:6,c(2,3))as.vector(t(a))a.flatten() orFlatten to vector (by columns)a(:)a.flatten(1)Flatten upper triangle (by columns)vech(a)4.4142536ih123456i 123456142536 a11a21a31 a[row(a) col(a)]Shared data (slicing)Desc.Copy of a4.5as.vector(a)hmatlab/Octaveb aPythonb a.copy()Rb aIndexing and accessing elements (Python: slicing)Desc.Input is a , arraymatlab/OctavePythonRElement , (row,col)First rowa [ 11 12 13 14 .21 22 23 24 .31 32 33 34 ]a(2,3)a(1,:)a array([[ 11, 12, 13, 14 ],[ 21, 22, 23, 24 ],[ 31, 32, 33, 34 ]])a[1,2]a[0,]a - rbind(c(11, 12, 13, 14),c(21, 22, 23, 24),c(31, 32, 33, 34))a[2,3]a[1,]First columna(:,1)a[:,0]a[,1]Array as indicesa([1 3],[1 4]);a.take([0,2]).take([0,3], axis 1)All, except first rowa(2:end,:)a[1:,]Last two rowsa(end-1:end,:)a[-2:,]Strides: Every other rowa(1:2:end,:)a[::2,:]a 23 a11a11a21h a31a11a31ha[-1,]hhThird in last dimension (axis)ha[-2,-3] Diagonala13a23a33a14a24a34 a12a13a14 3a33a13a23a33a22a14a34a14a24a34a33iia[.,2]All, except row,column ( , )Remove one columna12a22a32a(:,[1 3 4])a.take([0,2,3],axis 1)a.diagonal(offset 0)a[,-2] i a44 6
MATLAB commands in numerical Python (NumPy)Vidar Bronken Gundersen /mathesaurus.sf.net4.6AssignmentDesc.Clipping: Replace all elements over matlab/Octavea(:,1) 99a(:,1) [99 98 97]’a(a 90) 90;Clip upper and lower values4.7Pythona[:,0] 99a[:,0] array([99,98,97])(a 90).choose(a,90)a.clip(min None, max 90)Ra[,1] - 99a[,1] - c(99,98,97)a[a 90] - 90a.clip(min 2, max 5)Transpose and ().transpose()Non-conjugate nvaluesa.’ or spose()linalg.det(a) orlinalg.inv(a) orlinalg.pinv(a)norm(a)linalg.eig(a)[0]Singular valuessvd(a)linalg.svd(a)svd(a) dCholesky factorizationEigenvectorschol(a)[v,l] eig(a)linalg.cholesky(a)linalg.eig(a)[1]eigen(a) )sum(a’)sum(sum(a))Pythona.sum(axis 0)a.sum(axis 1)a.sum()a.trace(offset 0)a.cumsum(axis )solve(a)ginv(a)eigen(a) valuesSumDesc.Sum of each columnSum of each rowSum of all elementsSum along diagonalCumulative sum (columns)cumsum(a)apply(a,2,cumsum)7
MATLAB commands in numerical Python (NumPy)Vidar Bronken Gundersen mple dataa [ 4 3 2 ; 2 8 6 ; 1 4 7 ]PythonR a array([[4,3,2],[2,8,6],[1,4,7]]) Flat and sortedsort(a(:))a.ravel().sort() ort(sort(a)) Sort each columnsort(a)a.sort(axis 0) or msort(a)apply(a,2,sort) Sort each rowsort(a’)’a.sort(axis 1)t(apply(a,1,sort)) Sort rows (by first row)sortrows(a,1)Sort, return indicesSort each column, return indicesSort each row, return [v i] max(a)max(b,c)cummax(a)max-to-min rangeorder(a)Pythona.max(0) or amax(a [,axis 0])a.max(1) or amax(a, axis 1)a.max() orRapply(a,2,max)apply(a,1,max)max(a)i - mum(b,c)a.ptp(); a.ptp(0)Matrix manipulationDesc.Flip left-rightFlip up-downRotate degreesRepeat matrix: [ a a a ; a a a ]Triangular, upperTriangular, lower4.12a.ravel().argsort()a.argsort(axis 0)a.argsort(axis 1)Maximum and minimumDesc.max in each columnmax in each rowmax in arrayreturn indices, ipairwise lipud(a)rot90(a)repmat(a,2,3)Octave: kron(ones(2,3),a)triu(a)tril(a)Pythonfliplr(a) or a[:,::-1]flipud(a) or i(a)] - 0a[upper.tri(a)] - 0matlab/Octavesize(a)size(a,2) or length(a)length(a(:))ndims(a)Pythona.shape or a.getshape()a.shape[1] or size(a, axis 1)a.size or size(a[, axis valents to ”size”Desc.Matrix dimensionsNumber of columnsNumber of elementsNumber of dimensionsNumber of bytes used in 267248267487762 8
MATLAB commands in numerical Python (NumPy)Vidar Bronken Gundersen /mathesaurus.sf.net4.13Matrix- and elementwise- multiplicationDesc.matlab/OctavePythonRElementwise operationsa .* ba * b or multiply(a,b)a * bMatrix product (dot product)a * bmatrixmultiply(a,b)a %*% bInner matrix vector multiplication a · b0h19h715511123410141339hinner(a,b) or"Outer productouter(a,b) orCross productouter(a,b) or a %o% bcrossprod(a,b) or t(a) %*% bh"Kronecker productkron(a,b)kron(a,b)kronecker(a,b)Matrix division, b·a 1Left matrix division, b 1 ·a(solve linear equations)Vector dot productCross producta / ba \ blinalg.solve(a,b)solve(a,b)4.14Ax bvdot(a,b)cross(a,b)Find; conditional indexingDesc.Non-zero elements, ()Rwhich(a ! 0)Non-zero elements, array indices[i j] find(a)(i,j) a.nonzero()(i,j) where(a! 0)which(a ! 0, arr.ind T)Vector of non-zero values[i j v] find(a)v a.compress((a! 0).flat)v extract(a! 0,a)ij - which(a ! 0, arr.ind T); v - a[ij]Condition, indicesfind(a 5.5)(a 5.5).nonzero()which(a 5.5)a.compress((a 5.5).flat)ij - which(a 5.5, arr.ind T); v - a[ij]Return valuesZero out elements above . Replace values5a .* (a 5.5)where(a 5.5,0,a) or a * (a 5.5)a.put(2,indices)matlab/Octavea cat(3, [1 2; 1 2],[3 4; 3 4]);a(1,:,:)PythonRa array([[[1,2],[1,2]], [[3,4],[3,4]]])a[0,.]Multi-way arraysDesc.Define a -way arrayi516i1022i1125#23446869 128 12i 161420#22446864812 12 169
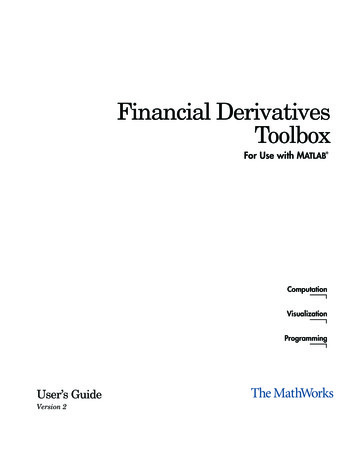
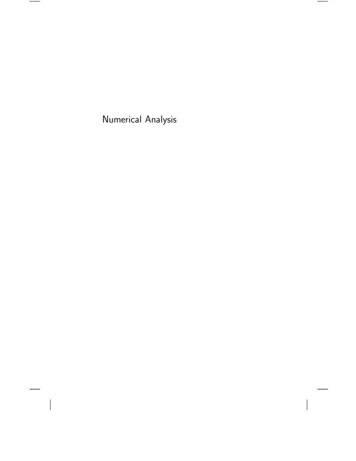
MATLAB commands in numerical Python (NumPy)Vidar Bronken Gundersen /mathesaurus.sf.net6File input and outputDesc.Reading from a file ( d)matlab/Octavef load(’data.txt’)Reading from a file ( d)Reading fram a CSV file ( d)Writing to a file ( d)Writing to a file ( d)Reading from a file ( d)f load(’data.txt’)x dlmread(’data.csv’, ’;’)save -ascii data.txt f7PythonRf fromfile("data.txt")f - read.table("data.txt")f load("data.txt")f load("data.txt")f - read.table("data.txt")f load(’data.csv’, delimiter ’;’) f - read.table(file "data.csv", sep ";")save(’data.csv’, f, fmt ’%.6f’, delimiter ’;’)write(f,file "data.txt")f.tofile(file ’data.csv’, format ’%.6f’, sep ’;’)f fromfile(file ’data.csv’, sep ’;’)Plotting7.1Basic x-y plotsDesc.matlab/OctavePythonR43210-1-2-3-4 d line plotplot(a)plot(a)020406080100plot(a, type "l")4.54.03.53.02.52.04.0 d scatter 7.58.0plot(x[,1],x[,2])76543214.0Two graphs in one plotOverplotting: Add new plots to currentsubplotsPlotting symbols and colorplot(x1,y1, x2,y2)plot(x1,y1)hold 1,y1,’bo’, ��)show() # as tplot(x2,y2,add T)plot(x,y,type "b",col "red")10
MATLAB commands in numerical Python (NumPy)Vidar Bronken Gundersen /mathesaurus.sf.net7.1.1Axes and titlesDesc.Turn on grid lines : aspect ratioSet axes manuallyAxis labels and titlesmatlab/Octavegrid onaxis equalOctave:axis(’equal’)replotaxis([ 0 10 0 5 y-axis’)Insert text7.1.2Pythongrid()figure(figsize (6,6))Rgrid()plot(c(1:10,10:1), asp 1)axis([ 0, 10, 0, 5 ])plot(x,y, xlim c(0,10), ylim c(0,5))plot(1:10, main "title",xlab "x-axis", ylab "y-axis")text(2,25,’hello’)Log plotsDesc.logarithmic y-axislogarithmic x-axislogarithmic x and y thonsemilogy(a)semilogx(a)loglog(a)Rplot(x,y, log "y")plot(x,y, log "x")plot(x,y, log "xy")Desc.matlab/OctavePythonRFilled plotfill(t,s,’b’, t,c,’g’)Octave: % fill has a bug?fill(t,s,’b’, t,c,’g’, alpha 0.2)plot(t,s, type "n", xlab "", ylab "")polygon(t,s, col "lightblue")polygon(t,c, col "lightgreen")7.1.3Filled plots and bar plotsStem-and-Leaf 356667778832674Functionsmatlab/Octavef inline(’sin(x/3) - cos(x/5)’)PythonRf - function(x) sin(x/3) - cos(x/5) f (x) sin x3 0.5 0.0 f (x) 0.5 1.0 x5 cos1.0Desc.Defining functions 1.5 2.0 0Plot a function for given rangeezplot(f,[0,40])fplot(’sin(x/3) - cos(x/5)’,[0,40])Octave: % no ezplotx arrayrange(0,40,.5)y sin(x/3) - cos(x/5)plot(x,y, ’o’)plot(f, xlim c(0,40), type ’p’)1020x30 4011
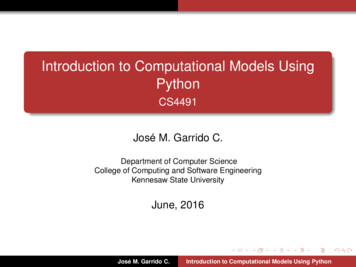
MATLAB commands in numerical Python (NumPy)Vidar Bronken Gundersen /mathesaurus.sf.net7.2Polar plotsDesc.matlab/Octavetheta 0:.001:2*pi;r sin(2*theta);Pythontheta arange(0,2*pi,0.001)r sin(2*theta)Rρ(θ) sin(2θ)901354518002253152707.3Desc.polar(theta, rho)polar(theta, 0,1), -4:4)PythonHistogram 0), breaks -4:4)hist(rnorm(1000), breaks c(seq(-5,0,0.25), seq(0.5,5,0.5)), freq F)plot(apply(a,1,sort),type "l")12
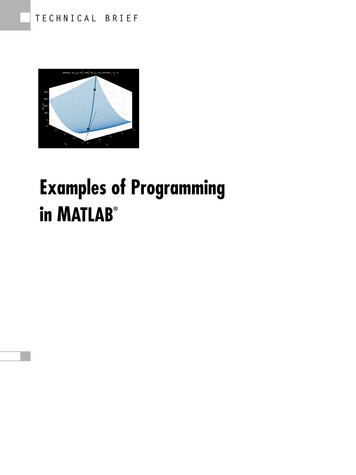
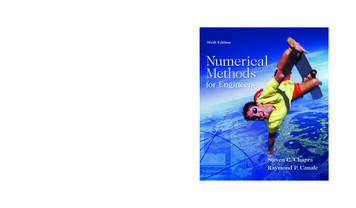
MATLAB commands in numerical Python (NumPy)Vidar Bronken Gundersen /mathesaurus.sf.net7.4.13d dataContour and image -0.2-0.400.210.47.41.0-1-0.2-2Contour plotcontour(z)-2-1012-2-1012levels, colls contour(Z, V,contour(z)origin ’lower’, extent (-3,3,-3,3))clabel(colls, levels, inline 1,fmt ’%1.1f’, fontsize 10)210-1-2contourf(z); colormap(gray)contourf(Z, V,cmap cm.gray,origin ’lower’,extent (-3,3,-3,3))filled.contour(x,y,z,nlevels 7, color gray.colors)Plot image dataimage(z)colormap(gray)im imshow(Z,interpolation ’bilinear’,origin ’lower’,extent (-3,3,-3,3))image(z, col 0.4Filled contour plot1.0-1-0.2-2-2Image with contoursDirection field vectorsquiver()# imshow() and contour() as abovequiver()-101213
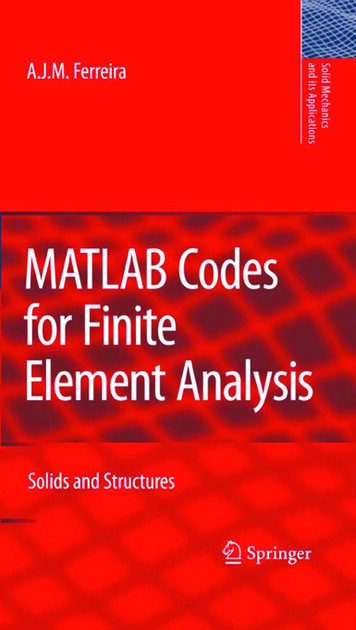
MATLAB commands in numerical Python (NumPy)Vidar Bronken Gundersen /mathesaurus.sf.net7.4.2Perspective plots of surfaces over the x-y planeDesc.matlab/OctavePythonRn -2:.1:2;[x,y] meshgrid(n,n);z x.*exp(-x. 2-y. 2);n arrayrange(-2,2,.1)[x,y] meshgrid(n,n)z x*power(math.e,-x**2-y**2)f - function(x,y) x*exp(-x 2-y 2)n - seq(-2,2, length 40)z - outer(n,n,f)2 y 2f (x, y) xe x0.40.2z0.02 0.21 0.4 2y0 10 1x12Mesh plotmesh(z) 2persp(x,y,z,theta 30, phi 30, expand 0.6,ticktype ’detailed’)0.40.2z0.02 0.21 0.4 2y0 10 1x12Surface plot7.4.3surf(x,y,z) or surfl(x,y,z)Octave: % no surfl() 2persp(x,y,z,theta 30, phi 30, expand 0.6,col ’lightblue’, shade 0.75, ltheta 120,ticktype ’detailed’)Scatter (cloud) 010-40 d scatter plot-60 0plot3(x,y,z,’k ’)cloud(z x*y)14
MATLAB commands in numerical Python (NumPy)Vidar Bronken Gundersen /mathesaurus.sf.net7.5Save plot to a graphics fileDesc.PostScriptPDFSVG (vector graphics for www)PNG (raster graphics)88.1matlab/Octaveplot(1:10)print -depsc2 foo.epsOctave:gset output "foo.eps"gset terminal postscript epsplot(1:10)print -dpng e ile ’foo.pdf’)devSVG(file ’foo.svg’)png(filename "Rplot%03d.png"Pythona array([1,2,2,5,2])b array([2,3,4])a set([1,2,2,5,2])b set([2,3,4])unique1d(a)unique(a)set(a)Ra - c(1,2,2,5,2)b - c(2,3,4)Data analysisSet membership operatorsDesc.Create setsmatlab/Octavea [ 1 2 2 5 2 ];b [ 2 3 4 ];Set uniqueunique(a)Set unionunion(a,b)union1d(a,b)a.union(b)union(a,b)Set tion(b)intersect(a,b)Set )setdiff(a,b)Set ,b))True for set memberismember(2,a)setxor1d(a,b)a.symmetric difference(b)2 in 2,a) or 2 %in% a 125 15
MATLAB commands in numerical Python (NumPy)Vidar Bronken Gundersen /Octavemean(a)MedianStandard deviationVarianceCorrelation )cov(x,y)8.3Pythona.mean(axis 0)mean(a [,axis 0])median(a) or median(a [,axis 0])a.std(axis 0) or std(a [,axis 0])a.var(axis 0) or var(a)correlate(x,y) or corrcoef(x,y)cov(x,y)matlab/Octavez polyval(polyfit(x,y,1),x)plot(x,y,’o’, x,z ,’-’)Python(a,b) polyfit(x,y,1)plot(x,y,’o’, x,a*x b,’-’)Linear least squares y ax ba x\ylinalg.lstsq(x,y)Polynomial poly()roots()8.4.1Polynomials, root findingSolve symbolic equationsEvaluate polynomialroots([1 -1 -1])f inline(’1/x - (x-1)’)fzero(f,1)solve(’1/x x-1’)polyval([1 2 1 ]),arange(1,11))matlab/Octavediff(a)Pythondiff(x, n 1, axis 0)Rmatlab/Octavefft(a)ifft(a)Pythonfft(a) orifft(a) orconvolve(x,y)Rfft(a)fft(a, inverse TRUE)PythonRSymbolic algebra; calculusDesc.Factorizationmatlab/Octavefactor()x2 x 1 01 (x 1)f (x) x1xFourier analysisDesc.Fast fourier transformInverse fourier transformLinear convolution9RDifferential equationsDesc.Discrete difference function and approximate derivativeSolve differential equations8.5Rz - lm(y x)plot(x,y)abline(z)solve(a,b)Non-linear methodsDesc.PolynomialFind zeros of polynomialFind a zero near x cor(x,y)cov(x,y)Interpolation and regressionDesc.Straight line fit8.4Rapply(a,2,mean) x 116
MATLAB commands in numerical Python (NumPy)Vidar Bronken Gundersen /mathesaurus.sf.net10ProgrammingDesc.Script file extensionComment symbol (rest of line)Import library functionsEval10.1from pylab import *library(RSvgDevice)string "a 234"eval(string)string - "a - 234"eval(parse(text string))matlab/Octavefor i 1:5; disp(i); endfor i 1:5disp(i)disp(i*2)endPythonfor i in range(1,6): print(i)for i in range(1,6):print(i)print(i*2)Rfor(i in 1:5) print(i)for(i in 1:5) {print(i)print(i*2)}matlab/Octaveif 1 0 a 100; endif 1 0 a 100; else a 0; endPythonif 1 0: a 100Rif (1 0) a - 100ifelse(a 0,a,0)a 0?a : 0DebuggingDesc.Most recent evaluated expressionList variables loaded into memoryClear variable x from -else-statementTernary operator ntMultiline for statements10.2matlab/Octave.m%Octave: % or #% must be in MATLABPATHOctave: % must be in LOADPATHstring ’a 234’;eval(string)matlab/Octaveanswhos or whoclear x or clear [all]disp(a)Pythonprint aR.Last.valueobjects()rm(x)print(a)Working directory and OSDesc.List files in directoryList script files in directoryDisplays the current working directoryChange working directoryInvoke a System Commandmatlab/Octavedir or lswhatpwdcd foo!notepadOctave: tepad’)os.popen(’notepad’)Rlist.files() or dir()list.files(pattern "\.r ")getwd()setwd(’foo’)system("notepad") This document is still draft quality. Most shown d plots are made using Matplotlib, and d plots using R and Gnuplot, provided as examples only. Version numbers and download url for software used: Python . . , http://www.python.org/; NumPy . . , http://numeric.scipy.org/; Matplotlib . , http://matplotlib.sf.net/; IPython . . ,http://ipython.scipy.org/; R . . , http://www.r-project.org/; Octave . . , http://www.octave.org/; Scilab . , http://www.scilab.org/; Gnuplot . , http://www.gnuplot.info/. For referencing: Gundersen, Vidar Bronken. MATLAB commands in numerical Python (Oslo/Norway, ), available from: http://mathesaurus.sf.net/ Contributions are appreciated: The best way to do this is to edit the xml and submit patches to our tracker or forums.17
MATLAB commands in numerical Python (NumPy) 3 Vidar Bronken Gundersen /mathesaurus.sf.net 2.5 Round off Desc. matlab/Octave Python R Round round(a) around(a) or math.round(a) round(a) Round up ceil(a) ceil(a) ceil(a) Round down floor(a) floor(a) floor(a) Round towards zero fix(a) fix(a) 2.6 Mathematical constants Desc. matlab/Octave Python R