Transcription
SAFETY DOESN’T HAPPEN BY ACCIDENTPROBLEM IDENTIFICATION REPORTColorado Department of TransportationSafety and Traffic Engineering BranchFinal Report
TOCSection ES. Executive SummarySelected Key FindingsReport Organization1129999991010Section II. Crash Overview and TrendsColorado Traffic Safety LegislationColorado Crash Trends, Key IndicatorsCrash SeverityCrash LocationRoadway Characteristics of Crashes111111111212Section III. Age and Gender of Crash DriversColorado Driver Overview, Baselines and TrendsCrash Involvement by AgeCrash Involvement by Age and GenderResidence of Crash Driver by Age and Gender4343434343Section IV. Occupant ProtectionOccupant Protection Overview, Baselines and TrendsAdult Occupant ProtectionChild Occupant ProtectionOccupant Protection by Location of CrashOccupant Protection by Gender and AgeOccupant Protection by Driver ImpairmentOccupant Protection by Driver County of ResidenceUse of Helmets in Motorcycle Crashes535353535353545454Section V. Impaired DriversImpaired Driver Overview, Baselines and TrendsAlcohol-Related Fatal Crash TrendsAlcohol-Related CrashesImpaired Drivers by Crash Location and Driver ResidenceBlood-Alcohol Content (BAC)Gender and Age of Impaired DriversVehicle Type and Impaired Drivers6161616161616263Section VI. Bicycles and PedestriansCrashes Involving Bicyclists and PedestriansGender and Age of Bicyclists and PedestriansMonth and Day of WeekRoad Conditions and Characteristics7979797979Table of ContentsSection I. IntroductionPurposeObjectiveData SourcesAnalysesThe Crash DataColorado RegionsAcknowledgementsPage i
Page Intentionally Left Blank
ESExecutive Summary
Section I. IntroductionSection II. Crash Overview and TrendsSection III. Age and Gender of Crash DriversSection IV. Occupant ProtectionSection V. Impaired DriversSection VI. Bicycles and Pedestrians
ExecutiveSummaryThis Executive Summary presents highlights of the FY 2007 Problem Identification report prepared for CDOT’s Safety & Traffic Engineering Branch by the University of Colorado’s Dr.Jeffrey Zax and Dr. Naci Mocan, Garner Insight’s Jennifer Garner and Glissen, LLC’s GlissenRhode. This report was prepared using CDOT’s 2004 crash database and time series data from theFatality Analysis Reporting System (FARS). The Motor Vehicle Division of the Department ofRevenue provided the study team with a database of 2004 drivers.2007 Problem Identification ReportSELECTED KEY FINDINGSThe following are selected key findings from the analysis of CDOT’s 2004 crash database andFARS data. Supporting information for selected findings are included in this Executive Summary.Exhibit ES.1 details the geographic groupings used in regional analyses. The state’s 12 most populous counties were treated as individual regions.Colorado Crash TrendsIn 2004, 667 people died on Colorado’s roads and 44,847 people were injured (Exhibit ES.2).Fatal crashes are more likely to be single vehicle crashes than other crash types. About 53% of fatalcrashes involved only one vehicle, compared to 31% of injury crashes and 25% of PDOs. Collision with a pedestrian was the first harmful event in 11% of 2004 fatal crashes. About 35% of fatalcrashes occur on weekends.Wheat Ridge has the highest per capita injury and fatal crash rate among the state’s largest citiesbased on where crashes occurred (Exhibit ES.3). This was also the case in 2003. Developing trafficsafety programs in Wheat Ridge may help reduce these high rates. Pueblo County and AdamsCounty residents had the highest per capita injury crash rates among the state’s counties.Residents of El Paso County account for 86% of the drivers in fatal crashes that occur in El PasoCounty (Exhibit ES.4) and 88% of the county’s injury crashes. Given that the majority of El PasoCounty fatal and injury crash drivers live in El Paso County, community-based traffic safety programs should continue to be implemented.Overall, about 25% of crashes involve an injury. In 2004, 75% of the 2,255 crashes that involved amotorcycle were injury crashes, a much higher rate of injury than traffic crashes overall.Age and GenderMen are much more likely than women to be a driver involved in an injury or fatal crash. Overall,71% of 2004’s fatal crash drivers were male. Teen drivers and drivers in their early 20s are two agecohorts with high crash rates. Drivers age 24 and younger have much higher per capita crash ratesthan older drivers (Exhibit ES.5).Teens living in Eastern Plains counties are more likely to be drivers in injury and fatal crashes thanteens from the greater Denver/Boulder area.Occupant ProtectionIn 2004, 79.3% of drivers statewide used a seat belt. This figure rose to 80.3% in 2006. Driversfrom the more urban Front Range have consistently higher seat belt use rates over time than driversfrom the state’s rural counties. Three out of ten drivers on the Eastern Plains do not use seat belts(Exhibit ES.6).Page 1
ExecutiveSummaryIn 2006, non-use of child safety seats for children ages 0 to 4 was 15%. In 2006, non-use of seatbelts for juveniles ages 5 to 15 was 30%.2007 Problem Identification ReportAmong large counties, Pueblo and Weld counties had the highest reported seat belt non-use bydrivers involved in the most severe crashes. 34% of Eastern Plains residents involved in incapacitating crashes were not using a seat belt at the time of crash, compared to 12% of Arapahoe Countyresidents (Exhibit ES.7).Impaired DrivingOne in ten injury crashes are alcohol-related and 37.2% of fatal crashes are alcohol-related.9.8% of Littleton’s injury crash drivers were impaired, compared to 1.7% in the City of Boulder.(Highest rate vs lowest rate among large cities, see Exhibit ES.8).Among alcohol-impaired fatal crash drivers, the majority had recorded BAC levels that exceeded0.10.Men are significantly more likely than women to be impaired drivers.One in ten (9.9%) injury crash drivers age 23 were impaired (Exhibit ES.9). Developing a programthat specifically and strategically addresses post-college drivers ages 22 to 24 has the potential toreduce impaired driving in Colorado.Bicycles and Pedestrians1,522 bicyclists were involved in police-reported crashes in 2004 and 74% of these bicyclists weremale (Exhibit ES.10).1,498 pedestrians were involved in police-reported crashes in 2004 and 59% of these pedestrianswere male.Crossing against the light was the reported cause of nearly 30% of pedestrian-involved injurycrashes.REPORT ORGANIZATIONSection I. Introduction follows this summary. A detailed examination of 2004 crashes is found inSection II, followed by an analysis of age and gender in Section III. Analyses of occupant protection use are presented in Section IV, followed by Section V’s examination of impaired driving.Section VI presents data related to bicycle and pedestrian-involved crashes.Page 2
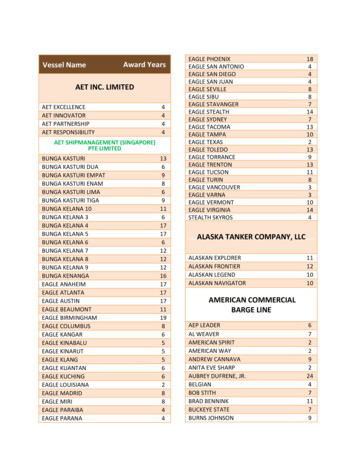
ES.1ExecutiveSummaryColorado RegionsSource:FY 2007 Problem Identification study team.2007 Problem Identification ReportGeographic groupings were identified in regional analyses.In 2004, 667 people died on Colorado’s roads and 44,847 people were injured.ES.2Colorado Crash and Population Trends, 1994-2004Source: Colorado Department of Revenue — Motor Vehicle Division, CDOT, Colorado Division of Local Governments —Colorado Economic and Demographic Information System, U.S. Department of Transportation, National Highway SafetyAdministration, Fatality Analysis Reporting System (FARS).% Change % Change19971998200020012002200320041995Total CrashesFatal CrashesInjury CrashesPDO Crashes94,61052330,13463,82195,778 101,886 107,844 110,866 115,145 121,995 131,020 137,216 126,878 130,72457255553455155861364767757059630,455 30,263 28,252 31,080 31,406 31,940 34,160 33,944 31,731 31,79667,366 71,069 79,078 79,263 83,175 89,456 92,213 102,598 94,578 InjuriesFatalities Per 100 Million VMTInjuries Per 100 Million VMTAlcohol-Related Fatal CrashesAlcohol-Related 45.802.2%5.5%8.2%10.2%Population (Thousands)VMT (Billions)Licensed Drivers (Thousands)Registered Vehicles (Thousands)1996199919942003-2004 2000-2004Page 3
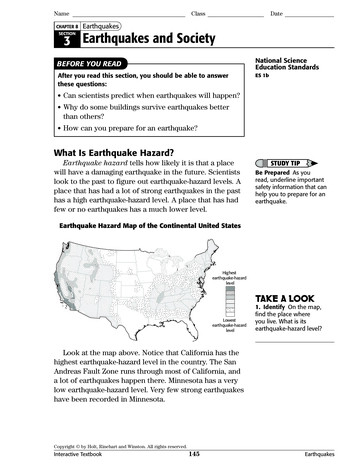
ExecutiveSummaryES.3Crashes Per Capita for Cities with More than 25,000 PopulationSource: 2004 CDOT Crash Database.TotalTotal CrashesTotal Injury andTotal Injury and FatalPopulationCrashesper 1,000 CapitaFatal CrashesCrashes Per 1,000 528.7440.7527.0926.0256.582007 Problem Identification ReportArv adaAuroraBoulderBrightonBroomfieldCastle RockCentennialColorado SpringsCommerce CityDenverEnglewoodFort CollinsGrand JunctionGreeleyLakewoodLittletonLongmontLov t RidgeWheat Ridge has the highest per capita injury and fatal crash rate.86% of El Paso County fatal crash drivers live in El Paso County.Fatal DriversES.4Page 4Place of Residence of Drivers in Fatal Crashes Occurring in Large CountiesSource: 2004 CDOT Crash Database.110100908070605040302010041Other CountySame nverEl PasoAdams Jefferson Arapahoe DouglasCountyPuebloBoulder LarimerMesaSame .33%68.97%78.57%92.00%Other .67%31.03%21.43%8.00%Total Number11073706653524530292825
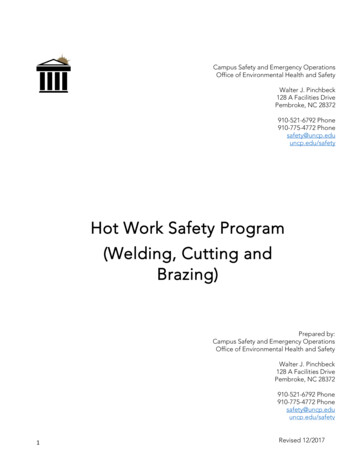
3.084.884.519State Average 44.1Age Cohort 13-15Total Drivers630Population 196,133Age Cohort 25-29Total Drivers 18,629Population Age ,108371,849 60-645,564181,813234,95757,60565-693,553130,55869 0089.4Drivers in All Crashes Per 1,000 Capita by AgeNote: Age was not reported for 42,800 drivers involved in crashes, or 20% of all crash drivers.Source: 2004 CDOT Crash Database.2007 Problem Identification ReportCrashes Per 1,000 PopulationExecutiveSummaryES.5244,63056,73469 6,773316,379Drivers age 24 and younger have much higher crash rates per capita than older drivers.Three out of ten drivers on the Eastern Plains do not use seat 67%67%199775%69%65%199653%53%65%Front RangeWestern RegionEastern Region62%100%90%80%70%60%50%40%30%20%10%0%Colorado Regional Seat Belt Use, 1997-2006Source: Annual Seat Belt Surveys conducted by the CSU Institute of Transportation Management on behalf of CDOT.48%48%ES.6200420052006Page 5
ExecutiveSummaryES.7Restraint Status of Driver in Incapacitating Crashes by Region and County of ResidenceSource: 2004 CDOT Crash Database.Restraint Status Unknow nRestraint UsedNo Restraint Used100%80%60%2007 Problem Identification Report40%EasternRegion/CountyRestraint Status UnknownPlains83.20%Restraint Used15762.80%No Restraint Used8534.00%Total250BroomfieldRestraint Status Unknown3477.27%Restraint Used1022.73%No Restraint saLarimerJeffersonEl PasoDouglasDenverBroomfieldBoulderArapahoeAdamsSW ColoradoSan Luis ValleyNW ColoradoNorthern Mtn. ResortGunnison ValleyCentral Mountains0%Eastern Plains20%Region and CountyGunnison 85774.30%60.60%243322.80%35.10%10594El Paso 68%17.86%485616San LuisSWValley 5%339Boulder165.28%24079.21%4715.51%30334% of Eastern Plains drivers involved in incapacitating crashes were not using seat belts.10% of Littleton’s injury crash drivers were impaired.ES.8Percent of All Injury Crash Drivers Who Were Impaired in a Large City of Crash, 2004Source: 2004 CDOT Crash cted57393.32%ImpairmentTotal614CityGrand JunctionSuspected303.33%No %95296.95%982Castle rce 595.12%94.96%820932Fort Collins604.10%1,40395.90%1,463Wheat Ridge344.54%71595.46%749CentennialColorado SpringsPage 6No Impairment
ExecutiveSummaryES.9Impaired Drivers Injury Crash Involvement per 1,000 Capita by Age, 2004Source: 2004 CDOT Crash 60.935-390.80.930-34State Average 0.860-642.01.51.41.210.70.5Per 1,000 Population22007 Problem Identification ReportImpaired Crash Drivers2.6369 45-4940-4425-292423222120191817160Age 76,96875,61465,82457,60556,734316,217Age Cohort30-3435-3940-4445-4950-5455-5960-6465-6969 13130,558316,3793,609,35023 year-old drivers have the highest impaired driving injury crash rate.Men are much more likely than women to be involved in a bicycle or pedestrian crash.ES.10 Gender of Bicyclists and Pedestrian CrashesSource: 2004 CDOT Crash Database.PDO OnlyInjury aleMaleTotalPedestrianCrashesPDO OnlyInjury 55Fatal CrashesTotal Crashes11371286131,099151,52211241652252852691,498 .67%Fatal 49%100%37.36%58.57%Pedestrian Crashes65.96%74.09%86.67%Bicyclist CrashesPage 7
Page Intentionally Left Blank
IIntroduction
IntroductionEach year CDOT examines crash records to identify traffic safety problems and opportunities forimproving traffic safety in Colorado. CDOT managers in the Safety and Traffic Engineering Branchuse the research results to develop traffic safetyprograms and projects.
Section IThe Colorado Department of Transportation (CDOT) retained the University of Colorado toprepare the FY 2007 Problem Identification Report. University of Colorado Professors Dr. JefferyZax and Dr. Naci Mocan were assisted in this effort by Jennifer Garner of Garner Insight LLCand Glissen Rhode of Glissen, LLC.IntroductionPURPOSEEach year CDOT examines crash records to identify traffic safety problems and opportunities forimproving traffic safety in Colorado. CDOT managers in the Safety and Traffic Engineering Branchuse the research results to develop traffic safety programs and projects. The resulting document,the FY 2007 Problem Identification Report, is available on-line at http://www.dot.state.co.us/Traffic Manuals Guidelines/Problem ID and Annual Report.asp.OBJECTIVEExamining crash trends and the factors associated with crashes, both behavioral and environmental, aids CDOT program managers in their task to support the Department’s safety mission and toachieve the Department’s goals and objectives. Findings from the Problem Identification Reportare used to support the Safety and Traffic Engineering Branch’s strategies to increase traffic safetyincluding prevention, collaboration/partnerships, education and enforcement.DATA SOURCESTo prepare the FY 2007 Problem Identification Report, the study team relied primarily on thefollowing sources of data: CDOT’s 2004 crash database, the Department of Revenue MotorVehicle Division’s database of 2004 licensed drivers and the 2004 Fatality Analysis Reporting System (FARS). Population data were obtained from the Colorado Division of Local Governmentsand the US Census Bureau.ANALYSESThis report includes examinations of crash trends, crash locations, the factors contributing tocrashes and an analysis of high-risk drivers. High-risk drivers include young drivers, impaireddrivers, the 2006 Seat Belt Study conducted on CDOT’s behalf by the Institute of TransportationManagement and drivers who do not use occupant protection devices. Crashes involving bicyclesand pedestrians were also included.THE CRASH DATAAccident reports compiled by law enforcement at the time of a crash are the foundation for theProblem Identification Report. These accident reports include information about the crashlocation, the factors that contributed to the crash, the severity of the crash, and whether ornot a driver was impaired at the time of the incident. Driver license records are linked to thecrashes. From the driver’s license file come demographic data, including gender, age and placeof residence.Page 9
Section IIntroductionThere are some limitations to these data. For property-damage only crashes( PDO Only), it may bethe case that the driver’s seat belt use (or non-use) is unrecorded. Similarly, the address reported ina driver’s license file may be out of date. This report’s analyses are designed to minimize theselimitations, where possible.COLORADO REGIONSExhibit I.1 details the regional groupings used throughout the report. The state’s twelve mostpopulous counties are considered individual regions, while data from smaller counties are groupedtogether geographically. These particular regional groupings have been employed in the analysis ofCDOT’s crash data since 2000.I.1Colorado RegionsSource: FY 2007 Problem Identification study team.ACKNOWLEDGMENTSThe study team would like to gratefully acknowledge the leadership of Gabriela Vidal, HenrySandoval and Rahim Marandi and the invaluable assistance of Dr. Aziz Khan.Page 10
IICrash Overview and Trends
Crash Overview and TrendsThis section closely examines the characteristicsof Colorado crash trends, with a focus on crashseverity.In 2004, 667 people died on Colorado’s roads and44,847 people were injured.Fatal crashes are more likely to be single vehiclecrashes than other crash types. About 53% of fatal crashes involved only one vehicle, compared to31% of injury crashes and 25% of PDOs. Collisionwith a pedestrian was the first harmful event in 11%of 2004 fatal crashes.Wheat Ridge has the highest per capita injury andfatal crash rate among the state’s largest citiesbased on where crashes occurred.Pueblo County and Adams County residents hadthe highest per capita injury crash rates.75% of motorcycle crashes are injury crashes.About 35% of fatal crashes occur on weekends.
Section II Child safety seat and seat belt laws (1985, 1987 and 2003); Efforts focusing on drinking and driving (e.g., creation of the Law Enforcement AssistanceFund in 1982 and passage of the 0.08 law in 2004); and The Graduated Licensing Law for new drivers (1999, 2006).Crash Overview and TrendsCOLORADO TRAFFIC SAFETY LEGISLATIONReducing the number of fatalities in traffic crashes, and the associated social and economic lossesfrom these crashes, is at the core of the Colorado Department of Transportation’s traffic safetyprogram. In addition to statewide and local enforcement and public information and educationprojects, CDOT has also supported key traffic safety legislation over the past twenty years. Examples of traffic safety legislative milestones include:COLORADO CRASH TRENDS, KEY INDICATORSExhibit II.1 presents key indicators of Colorado crash trends from 1994 through 2004. In 2004,667 people died on Colorado’s roads and 44,847 people were injured. From 2003 to 2004, bothinjury and fatality rates per 100 million Vehicle Miles Traveled (VMT) declined despite growth inboth VMT and population.Exhibits II.2 through II.5 show trends in total crashes, property damage-only (PDO) injury andfatal crashes per 100 million VMT as well as CDOT’s projected goals for future crash rate levels.An examination of annual trends reveals that each type of crash rate is decreasing in recent years.Exhibit II.6 presents trend data on fatalities per 100 million VMT, a metric that has declined since2001 to a rate of 1.26 in 2005.Exhibit II.7 details the fatal crash rate per 100,000 population by the age of driver. Drivers age 24had the highest fatal crash involvement rate at 49.4 fatal crashes per 100,000 population.Exhibit II.8 presents trends in the number of fatal crashes, VMT and the fatal crash rate per 100million VMT from 1977 through 2004. The time-series data demonstrate that the fatal crash ratehas declined significantly over the past three decades.CRASH SEVERITYHistorically, 25% of all crashes are injury crashes and less than one-half of one percent of crashesare fatal (Exhibit II.9).In most cases, injury crashes involve a single injury (Exhibit II.10). Exhibit II.11 demonstrates thatsome crashes in the state’s database are mis-categorized. For example, three fatal crashes are listedas injury crashes. This is likely the result of a fatality occurring after the crash record was developed.As CDOT looks to improve its data quality, this is an element that should be considered. It isimportant to note that only three of 594 crashes are misclassified.Exhibit II.12 details the number of injury crashes by the number of injuries reported in the crash.Overall, 72% of injury crashes report a single injury. Ninety percent of fatal crashes involve a singlefatality (Exhibit II.13). Fifty-three fatal crashes involve two or more fatalities per crash.Exhibit II.14 details the number of vehicles involved in a crash, by crash severity. About 53% offatal crashes involved only one vehicle, compared to 31% of injury crashes and 25% of PDOs.Page 11
Section IICRASH LOCATIONCrash Overview and TrendsCity, Region, County and RoadExhibit II.15 presents total and injury/fatal crash rates per capita for the state’s largest cities.The cities with the highest per capita injury and fatal crash rates are Wheat Ridge, Denver andPueblo. The large cities with the lowest injury and fatal crash rates are Loveland, Castle Rockand Centennial.Exhibit II.16 presents the crash severity distribution for crashes occurring in all Colorado cities thatexperienced at least ten crashes in 2004.Exhibit II.17 examines injury and fatal crash rates based on the county in which a crash driver lives(rather than the location of the crash). Pueblo County and Adams County residents had the highestper capita injury crash rates.For fatal crashes in large counties and outlying regions, Exhibit II.18 details the roadway type onwhich the fatal crash occurred. In most cases, fatal crashes occur on interstate and other satehighways.For drivers involved in fatal crashes occurring in the largest counties, Exhibit II.19 compares whetherthe fatal crash drivers were county residents or residents of other counties. For fatal crashes occurring in El Paso County, 86% of the fatal crash drivers live in the County. By comparison, 47%of the drivers in Douglas County fatal crashes live in Douglas County.For drivers involved in injury crashes, Exhibit II.20 examines whether or not injury crashdrivers live in the county where the injury crash occurred.Exhibit II.21 presents the distribution of injury crash drivers by the large county or region ofcrash. Nearly one in five 2004 injury crashes occurred within Denver County.ROADWAY CHARACTERISTICS OF CRASHESLocation Relative to the RoadwayExhibit II.22 details severity of crash locations relative to the roadway. Most crashes occur on theroadway. However, about 40% of fatal crashes occurred when a vehicle runs off of the roadwayto either the left (17%) or the right (23%).Road TypeExhibit II.23 presents the type of road on which crashes occurred, by the severity of the crash.About 46% of PDO crashes occurred on city streets, compared to 38% of injury crashes and 16%of fatal crashes.Road DescriptionExhibit II.24 details the road description for crashes by severity. Half of fatal crashes occur near ahighway interchange.Road ContourThe majority of PDO and injury crashes occur on straight on-level roadways (Exhibit II.25).Road SurfacePage 12Crash severity does not vary much by road surface (Exhibit II.26). Nearly 85% of crashes, regardless of severity occur on blacktop.
Section IIRoad ConditionNearly 88% of fatal crashes occur on dry roads (Exhibit II.27)Lighting ConditionSlightly more than 25% of fatal crashes occur on dark, unlighted roadways (Exhibit II.28).Crash Overview and TrendsWeather ConditionMost crashes occur under normal weather conditions (Exhibits II.29 and II.30). Sleet/rain/snowaccount for fewer than 10% of PDO crashes and even fewer injury and fatal crashes.Vehicle TypeExhibit II.31 presents the types of vehicles involved in 2004 crashes by crash severity. Nearly 60%of fatal crashes involve a passenger vehicle and nearly 9% involve a motorcycle. In 2004, 89 fatalcrashes involved a motorcycle and resulted in 58 motorcyclist fatalities (Exhibit II.32).Crashes involving a motorcycle are much more severe than a typical crash. As noted previously,75% of crashes overall are PDO. However, 75% of motorcycle crashes are injury crashes (ExhibitII.33). Few motorcycle crashes result in only property damage.Exhibit II.34 details the frequency of motorcycle crashes in the state’s largest counties and regions.Jefferson County had the highest number of motorcycle crashes and the San Luis Valley had theleast. Exhibit II.35 shows the age distribution of motorcyclists involved in 2004 crashes. Nearly11% of the motorcyclists involved in crashes were ages 24 to 29.Hit-and-Run Fatal CrashesIn 2004, nearly one in twenty (5%) fatal crashes involved a hit-and-run driver (Exhibit II.36).Vehicle MovementExhibit II.37 details the vehicle movement noted at the time of crash for PDO, injury and fatalcrashes. In four out of five fatal crashes, a vehicle was going straight.Vehicle SpeedExhibits II.38 and II.39 examine fatal and other crashes based on the posted speed limit at thecrash location. Exhibit II.40 makes the same comparison based on the reported speed of driversinvolved in the crash.Most Apparent Human Contributing FactorIn most (about 75%) crashes, no apparent contributing factor is noted. Driver inexperience is afactor in fewer than 5% of all crashes (Exhibit II.41).First Harmful EventExhibit II.42 presents the first harmful event recorded for crashes, by severity. Not surprisingly, thegreatest proportion of reported first harmful events involve collision with a moving motor vehicle. However, in 11% of fatal crashes the first harmful event was collision with a pedestrian.Crashes by Time of Year and DayMonth of YearExhibit II.43 presents the distribution of crashes by month of the year. Generally, crashes occurequally across the twelve months of the year. A slightly higher number of fatal crashes occur in Julythan in other months.Page 13
Section IIDay of WeekCrash Overview and TrendsCrashes are evenly distributed across the days of the week, with a slightly greater proportion offatal crashes occurring on Thursdays and Fridays than other days of the week (Exhibit II.44).About 35% of fatal crashes occur on weekends (Exhibit II.45). Exhibit II.46 details the time ofday at which crashes occur. About 25% of all injury crashes occur during afternoon rush hour,from 3:00 to 6:00 p.m.Driver OutcomesExhibit II.47 presents the injury outcomes for all drivers involved in PDO, injury and fatal crashes.Exhibit II.48 details the number of vehicle occupants ejected from their vehicle as a result of acrash.INTERVENTION ANALYSISThe intervention analysis models and forecasts fatal crashes, fatalities and alcohol-related fatalitiesusing Structural Time Series methods.The model developed for the FY 2006 Problem Identification predicted 665 fatalities in 2004,actual 2004 fatalities were 665. The model forecasted fatal crashes with a prediction error of 3.3%.Alcohol-related fatalities were less predictable, as the forecast performed with a 17.7% error.The FY 2007 Problem Identification model predicts: 562 fatal crashes in 2006 664 fatalities in 2006 239 alcohol-related fatalities in 2006To request a copy of the Intervention Analysis, including the methodology and parameter estimates, contact Dr. Naci Mocan, nmocan@cudenver.org.II.1Colorado Crash and Population Trends, 1994-2004Source: Colorado Department of Revenue—Motor Vehicle Division, CDOT, Colorado Division of Local Governments—Colorado Economic and Demographic Information System, U.S. Department of Transportation, National Highway SafetyAdministration,
ing crashes were not using a seat belt at the time of crash, compared to 12% of Arapahoe County residents (Exhibit ES.7). Impaired Driving One in ten injury crashes are alcohol-related and 37.2% of fatal crashes are alcohol-related. 9.8% of Littleton's injury crash drivers were impaired, compared to 1.7% in the City of Boulder.