Transcription
Introduction to LabVIEWBy Matt Downey – National instruments
Course Goals Become comfortable with the LabVIEW environmentand data flow execution Ability to use LabVIEW to solve problems LabVIEW Concepts– Acquiring, saving and loading data– Find and use math and complex analysis functions– Work with data types, such as arrays and clusters– Displaying and printing results
The Virtual Instrumentation Approach
LabVIEW Graphical Development System Graphical Programming Environment Compile code for multiple OS and devices Useful in a broad range of applications
Virtual Instrumentation Applications Design– Signal and Image Processing– Embedded System ProgrammingA single graphical development platform (PC, DSP, FPGA, Microcontroller)– Simulation and PrototypingDesign– And more Control– Automatic Controls and Dynamic Systems– Mechatronics and Robotics– And more Measurements– Circuits and Electronics– Measurements and Instrumentation– And more PrototypeDeploy
The NI Approach – Integrated Hardware PlatformsPXI Modular InstrumentationHigh-Speed izers and DMMs Data Acquisition Signal Acquisition ControlDigitizersSignal Conditioningand SwitchingUnit Under TestLaptop PCDesktop PCDigital uted I/O andEmbedded ControlPDA
Section I – LabVIEW EnvironmentA. Getting Data into your Computer Data Acquisition Devices– NI-DAQ– Simulated Data Acquisition– Sound CardB. LabVIEW Environment Front Panel / Block Diagram Toolbar /Tools PaletteC. Components of a LabVIEW Application Creating a VI Data Flow ExecutionD. Additional Help Finding Functions Tips for Working in LabVIEW
A. Setting Up Your Hardware Sound Card– Built into most computers
Exercise 1 – Setting Up Your Device Use Windows to:–Verify your Sound CardUn-Mute Microphone
Open and Run LabVIEWStart»All Programs»National Instruments LabVIEW 8.0»Startup Screen:Start from a Blank VI:New»Blank VIorStart from an Example:Examples»FindExamples
LabVIEW Programs Are Called Virtual Instruments (VIs)Each VI has 2 WindowsFront Panel User Interface (UI)– Controls Inputs– Indicators OutputsBlock Diagram Graphical Code– Data travels on wires fromcontrols through functions toindicators– Blocks execute by Dataflow
Controls Palette (Place items on the Front Panel Window)(Controls & cator:Numeric Slide
Functions (and Structures) Palette(Place items on theBlock Diagram Window)Structure:While Loop
Tools Palette Recommended: Automatic Selection Tool Tools to operate and modify both front panel andblock diagram objectsAutomatic Selection ToolAutomatically chooses among the following tools:Operating ToolPositioning/Resizing ToolLabeling ToolWiring Tool
Status ToolbarRun ButtonContinuous Run ButtonAbort ExecutionAdditional Buttons onthe Diagram ToolbarExecution Highlighting ButtonRetain Wire Values ButtonStep Function Buttons
Demonstration 1: Creating a VIFront Panel WindowGraphIndicatorBlock Diagram WindowOutputTerminalBooleanControlInputTerminals
Dataflow Programming Block diagram execution– Dependent on the flow of data– Block diagram does NOT executeleft to right Node executes when data isavailable to ALL input terminals Nodes supply data to all outputterminals when done
Debugging Techniques Finding ErrorsClick on broken Run button.Window showing error appears. Execution HighlightingClick on Execution Highlighting button; dataflow is animated using bubbles. Values aredisplayed on wires. ProbesRight-click on wire to display probe and it showsdata as it flows through wire segment.You can also select Probe tool from Tools paletteand click on wire.
Exercise 2 – Acquiring a Signal with the Sound Card Use LabVIEW to:– Acquire a signal from your sound cardThis exercise should take 15 minutes.
Context Help Window Help»Show Context Help, press the Ctrl H keys Hover cursor over object to update windowAdditional Help– Right-Click on the VI icon andchoose Help, or– Choose “Detailed Help.” onthe context help window
Tips for Working in LabVIEW Keystroke Shortcuts– Ctrl H – Activate/Deactivate Context Help Window– Ctrl B – Remove Broken Wires From Block Diagram– Ctrl E – Toggle Between Front Panel and BlockDiagram– Ctrl Z – Undo (Also in Edit Menu) Tools»Options – Set Preferences in LabVIEW VI Properties–Configure VI Appearance,Documentation, etc.
Section II – Elements of Typical ProgramsA. Loops While Loop For LoopB. Functions and SubVIs Types of Functions Creating Custom Functions (SubVI) Functions Palette & SearchingC. Decision Making and File IO Case Structure Select (simple If statement) File I/O
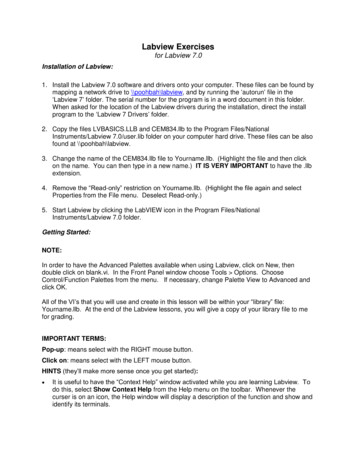
LoopsWhile Loop While Loops– i terminal counts iteration– Always runs at least once– Runs until stop condition ismet For Loops– i terminal counts iterations– Run according to input N ofcount terminalFor Loop
Drawing a Loop2. Enclose code to be repeated1. Select the structure3. Drop or drag additional nodes and then wire
3 Types of Functions (from the Functions Palette)Express VIs: interactive VIs with configurable dialog page (blue border)Standard VIs: modularized VIs customized by wiring (customizable)Functions: fundamental operating elements of LabVIEW; no front panel orblock diagram (yellow)
What Types of Functions are Available? Input and Output––––Signal and Data SimulationAcquire and Generate Real Signals with DAQInstrument I/O Assistant (Serial & GPIB)ActiveX for communication with other programs Analysis––––Signal ProcessingStatisticsAdvanced Math and FormulasContinuous Time Solver Storage– File I/OExpress Functions Palette
Searching for Controls, VIs, and Functions Palettes are filled with hundredsof VIs Press the search button to index theall VIs for text searching Click and drag an item from thesearch window to the block diagram Double-click an item to open theowning palette
Create SubVI Enclose area to be converted into a subVI. Select Edit»Create SubVI from the Edit Menu.
LabVIEW Functions and SubVIs operate like Functionsin other languagesFunction Pseudo CodeCalling Program Pseudo Codefunction average (in1, in2, out){out (in1 in2)/2.0;}main{average (in1, in2, pointavg)}SubVI Block DiagramCalling VI Block Diagram
Exercise 3.1 – Acquire and Analysis Use LabVIEW Express VIs to:– Acquire a signal and display its amplitude and frequencyThis exercise should take 15 minutes.
How Do I Make Decisions in LabVIEW?1. Case Structures(a)2. Select(c)(b)
File I/OFile I/O – passing data to and from files Files can be binary, text, or spreadsheet Write/Read LabVIEW Measurements file (*.lvm)Writing to LVM fileReading from LVM file
File I/O Programming Model – Under the hoodOpen/Create/Replace FileReadand/orWrite to FileCloseFileCheck forErrors
Section III – Presenting your ResultsA. Displaying Data on the Front Panel Controls and Indicators Graphs and Charts Loop TimingB. Signal Processing MathScriptArraysClustersWaveforms
What Types of Controls and Indicators are Available? Numeric Data– Number input and display– Analog Sliders, Dials, and Gauges Boolean Data– Buttons and LEDs Array & Matrix Data––––––Numeric DisplayChartGraphXY GraphIntensity Graph3D graph: point, surface, and model Decorations– Tab Control– Arrows Other– Strings and text boxes– Picture/Image Display– ActiveX ControlsExpress Controls Palette
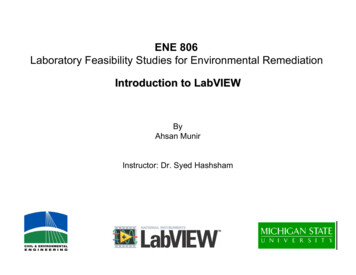
Charts – Add 1 data point at a time with historyWaveform chart – special numeric indicator that candisplay a history of values Chart updates with each individual point it receivesFunctions»Express»Graph Indicators»Chart
Graphs – Display many data points at onceWaveform graph – special numeric indicator thatdisplays an array of data Graph updates after all points have been collected May be used in a loop if VI collects buffers of dataFunctions»Express»Graph Indicators»Graph
Building Arrays with Loops (Auto-Indexing) Loops can accumulatearrays at their boundarieswith auto-indexing For Loops auto-index bydefault While Loops output onlythe final value by default Right-click tunnel andenable/disable autoindexingAuto-Indexing EnabledWire becomes thicker1D Array012345Auto-Indexing DisabledWire remains the same size5Only one value (last iteration)is passed out of the loop
Creating an Array (Step 1 of 2)From the Controls»Modern»Array, Matrix, andCluster subpalette, select the Array icon.Drop it on the Front Panel.
Create an Array (Step 2 of 2)1. Place an Array Shell.2. Insert datatype into the shell (i.e. Numeric Control).
How Do I Time a Loop?1. Loop Time Delay Configure the Time Delay Express VI for seconds to waiteach iteration of the loop (works on For and While loops).2. Timed Loops Configure special timed While loop for desired dt.Time DelayTimed Loop
Control & Indicator Properties Properties are characteristics or qualities about an object Properties can be found by right clicking on a Control or Indicator Properties Include:– Size– Color– Plot Style– Plot color Features include:– Cursors– Scaling
Math with the MathScript Node Implement equations and algorithms textually Input and Output variables created at the border Generally compatible with popular m-file script language Terminate statements with a semicolon to disable »MathScript)Prototype your equations in the interactive MathScript Window.
The Interactive MathScript Window Rapidly develop and test algorithms Share Scripts andVariables with the Node View /Modify Variablecontent in 1D, 2D, and 3DOutputWindowVariableWorkspaceView/ModifyVariable ContentsUser Commandsm-file Script(LabVIEW»Tools»MathScript Window)
Review of Data Types Found in LabVIEW
Additional Resources NI Academic Web & Student Corner– http://www.ni.com/academic Connexions: Full LabVIEW Training Course– www.cnx.rice.edu– Or search for “LabVIEW basics” LabVIEW Certification– LabVIEW Fundamentals Exam (free on www.ni.com/academic)– Certified LabVIEW Associate Developer Exam (industry recognized certification )
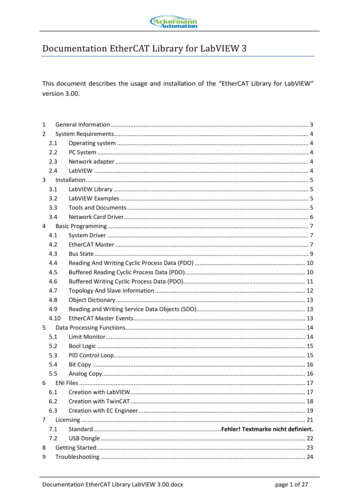
The LabVIEW Certification ProgramArchitect Mastery of LabVIEW Expert in large application development Skilled in leading project teamsCertifiedLabVIEWArchitectDeveloper Advanced LabVIEW knowledgeand application developmentexperience Project management skillsCertified LabVIEWDeveloperAssociate Developer Proficiency in navigatingLabVIEW environment Some applicationdevelopment experienceFundamentals Exam Pre-Certification Skills TestCertified LabVIEW AssociateDeveloperFree On-Line Fundamentals Exam
LabVIEW Functions and SubVIs operate like Functions in other languages Function Pseudo Code function average (in1, in2, out) {out (in1 in2)/2.0;} SubVI Block Diagram Calling Program Pseudo Code main