Transcription
Introduction to LabVIEWFor Use in Embedded System DevelopmentUC Berkeley EE249Hugo.Andrade@ni.com
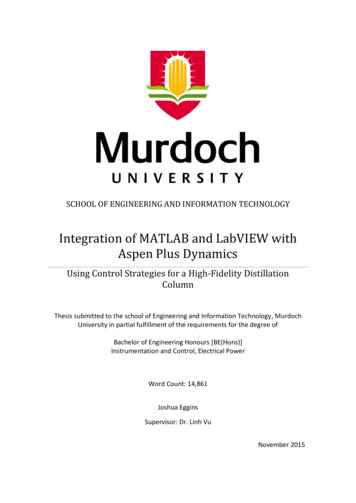
Lab Goals Become comfortable with the LabVIEW environment Ability to use LabVIEW to solve problems that arise during theanalysis, design, prototype and deployment of EmbeddedSystems LabVIEW Concepts– Acquiring, saving and loading data– Find and use math and complex analysis functions– Work with data types, such as arrays and clusters– Displaying and printing results– Modeling tools– Targets and Deployment
LabVIEW Graphical Development System Graphical Programming Environment Compile code for multiple OS and devices Useful in a broad range of applications
The Virtual Instrumentation Approach
Virtual Instrumentation Applications Analysis and Design– Simulation– Signal and Image Processing– Embedded System Programming (PC, DSP, FPGA, Microcontroller)A single graphical development platformDesign– Prototyping– And more Control– Automatic Controls and Dynamic Systems– Mechatronics and Robotics– And more Measurement/Test– Circuits and Electronics– Measurements and Instrumentation PrototypeDeploy
The NI Approach – Integrated Hardware PlatformsPXI Modular InstrumentationHigh-Speed izers and DMMs Data Acquisition Signal Acquisition ControlDigitizersSignal Conditioningand SwitchingUnit Under TestLaptop PCDesktop PCDigital uted I/O andEmbedded ControlPDA
High-Level Development ToolsData FlowC CodeTextual MathModelingStatechartGraphical System Design PlatformLinux MacintoshDesktop PlatformWindowsReal-TimeFPGAEmbedded PlatformMicro
Section I – LabVIEW EnvironmentA. Getting Data into your Computer Data Acquisition Devices– NI-DAQ– Simulated Data Acquisition– Sound CardB. LabVIEW Environment Front Panel / Block Diagram Toolbar /Tools PaletteC. Components of a LabVIEW Application Creating a VI Data Flow ExecutionD. Additional Help Finding Functions Tips for Working in LabVIEW
A. Setting Up Your Hardware Data Acquisition Device (DAQ)Track A– Actual USB, PCI, or PXI Device– Configured in MAX Simulated Data Acquisition Device (DAQ)– Software simulated at the driver level– Configured in MAX Sound CardTrack C– Built into most computersTrack B
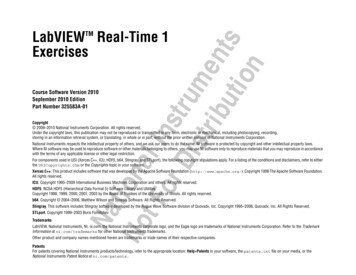
What type of device should I use?Sound Card*NI USB DAQNI PCI DAQInstruments*AI Bandwidth8–44 KS/s10–200 KS/s250 K–1.2 Ms/s20kS/s–2 GS/sAccuracy12–16 bit12–16 bit14–18 bit12–24 bitPortablexx—someAI Channels28–1616–802AO Channels21–22–40AC or x* The above table may not be representative of all device variations that exist in each category
What is MAX? MAX stands for Measurement & Automation Explorer. MAX configures and organizes all your National Instruments DAQ,PCI/PXI instruments, GPIB, IMAQ, IVI, Motion, VISA, and VXI devices. Used for configuring and testing devices.Icon Found onWindows Desktop
Exercise 1 – Setting Up Your DeviceTrack B Use Measurement and Automation Explorer (MAX) to:– Configure and test your Simulated Data Acquisition (DAQ) device
Open and Run LabVIEWStart»All Programs»National Instruments LabVIEW 8.5Startup Screen:Start from a Blank VI:New»Blank VIorStart from an Example:Examples»FindExamples
LabVIEW Programs Are Called Virtual Instruments (VIs)Each VI has 2 WindowsFront Panel User Interface (UI)– Controls Inputs– Indicators OutputsBlock Diagram Graphical Code– Data travels on wires fromcontrols through functions toindicators– Blocks execute by Dataflow
Controls Palette (Place items on the Front Panel Window)(Controls & cator:Numeric Slide
Functions (and Structures) Palette(Place items on theBlock Diagram Window)Structure:While Loop
Status ToolbarRun ButtonContinuous Run ButtonAbort ExecutionAdditional Buttons onthe Diagram ToolbarExecution Highlighting ButtonRetain Wire Values ButtonStep Function Buttons
Demonstration 1: Creating a VIFront Panel WindowGraphIndicatorBlock Diagram WindowOutputTerminalBooleanControlInputTerminals
Dataflow Programming Block diagram execution– Dependent on the flow of data– Block diagram does NOT executeleft to right Node executes when data isavailable to ALL input terminals Nodes supply data to all outputterminals when done
Debugging Techniques Finding ErrorsClick on broken Run button.Window showing error appears. Execution HighlightingClick on Execution Highlighting button; dataflow is animated using bubbles. Values aredisplayed on wires. ProbesRight-click on wire to display probe and it showsdata as it flows through wire segment.You can also select Probe tool from Tools paletteand click on wire.
Exercise 2 – Acquiring a Signal with DAQ Use a LabVIEW template to:– Acquire a signal from your DAQdeviceThis exercise should take 15 minutes.Track A&B
Context Help Window Help»Show Context Help, press the Ctrl H keys Hover cursor over object to update windowAdditional Help– Right-Click on the VI icon andchoose Help, or– Choose “Detailed Help.” onthe context help window
Tips for Working in LabVIEW Keystroke Shortcuts– Ctrl H – Activate/Deactivate Context Help Window– Ctrl B – Remove Broken Wires From Block Diagram– Ctrl E – Toggle Between Front Panel and BlockDiagram– Ctrl Z – Undo (Also in Edit Menu) Tools»Options – Set Preferences in LabVIEW VI Properties–Configure VI Appearance,Documentation, etc.
Section II – Elements of Typical ProgramsA. Loops While Loop For LoopB. Functions and SubVIs Types of Functions Creating Custom Functions (SubVI) Functions Palette & SearchingC. Decision Making and File IO Case Structure Select (simple If statement) File I/O
LoopsWhile Loop While Loops– i terminal counts iteration– Always runs at least once– Runs until stop condition ismet For Loops– i terminal counts iterations– Run according to input N ofcount terminalFor Loop
Drawing a Loop2. Enclose code to be repeated1. Select the structure3. Drop or drag additional nodes and then wire
3 Types of Functions (from the Functions Palette)Express VIs: interactive VIs with configurable dialog page (blue border)Standard VIs: modularized VIs customized by wiring (customizable)Functions: fundamental operating elements of LabVIEW; no front panel orblock diagram (yellow)
What Types of Functions are Available? Input and Output––––Signal and Data SimulationAcquire and Generate Real Signals with DAQInstrument I/O Assistant (Serial & GPIB)ActiveX for communication with other programs Analysis––––Signal ProcessingStatisticsAdvanced Math and FormulasContinuous Time Solver Storage– File I/OExpress Functions Palette
Searching for Controls, VIs, and Functions Palettes are filled with hundredsof VIs Press the search button to index theall VIs for text searching Click and drag an item from thesearch window to the block diagram Double-click an item to open theowning palette
Create SubVI Enclose area to be converted into a subVI. Select Edit»Create SubVI from the Edit Menu.
LabVIEW Functions and SubVIs operate like Functionsin other languagesFunction Pseudo CodeCalling Program Pseudo Codefunction average (in1, in2, out){out (in1 in2)/2.0;}main{average (in1, in2, pointavg)}SubVI Block DiagramCalling VI Block Diagram
Exercise 3.1 – AnalysisTrack A,B,&C Use LabVIEW Express VIs to:– Simulate a signal and display its amplitude and frequencyThis exercise should take15 minutes.
Exercise 3.2 – AnalysisTrack A&B Use LabVIEW Express VIs to:– Acquire a signal and display its amplitude and frequencyThis exercise should take 15 minutes.
Exercise 3.2 – AnalysisTrack C Use LabVIEW Express VIs to:– Acquire a signal and display its amplitude and frequencyThis exercise should take 15 minutes.
How Do I Make Decisions in LabVIEW?1. Case Structures(a)2. Select(c)(b)
File I/OFile I/O – passing data to and from files Files can be binary, text, or spreadsheet Write/Read LabVIEW Measurements file (*.lvm)Writing to LVM fileReading from LVM file
Track A,B,CExercise 3.3 – Decision Making and Saving Data Use a case structure to:– Make a VI that saves data when a condition is metThis exercise should take 15minutes.
File I/O Programming Model – Under the hoodOpen/Create/Replace FileReadand/orWrite to FileCloseFileCheck forErrors
Section III – Presenting your ResultsA. Displaying Data on the Front Panel Controls and Indicators Graphs and Charts Loop TimingB. Signal Processing MathScriptArraysClustersWaveforms
What Types of Controls and Indicators are Available? Numeric Data– Number input and display– Analog Sliders, Dials, and Gauges Boolean Data– Buttons and LEDs Array & Matrix Data––––––Numeric DisplayChartGraphXY GraphIntensity Graph3D graph: point, surface, and model Decorations– Tab Control– Arrows Other– Strings and text boxes– Picture/Image Display– ActiveX ControlsExpress Controls Palette
Charts – Add 1 data point at a time with historyWaveform chart – special numeric indicator that candisplay a history of values Chart updates with each individual point it receivesFunctions»Express»Graph Indicators»Chart
Graphs – Display many data points at onceWaveform graph – special numeric indicator thatdisplays an array of data Graph updates after all points have been collected May be used in a loop if VI collects buffers of dataFunctions»Express»Graph Indicators»Graph
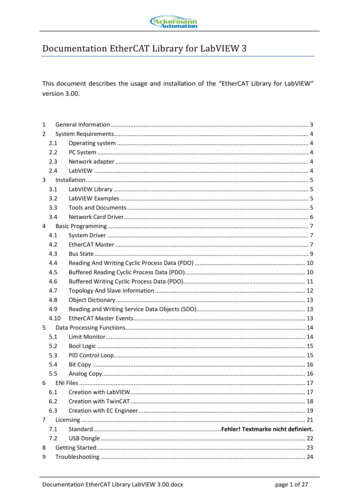
Building Arrays with Loops (Auto-Indexing) Loops can accumulatearrays at their boundarieswith auto-indexing For Loops auto-index bydefault While Loops output onlythe final value by default Right-click tunnel andenable/disable autoindexingAuto-Indexing EnabledWire becomes thicker1D Array012345Auto-Indexing DisabledWire remains the same size5Only one value (last iteration)is passed out of the loop
Creating an Array (Step 1 of 2)From the Controls»Modern»Array, Matrix, andCluster subpalette, select the Array icon.Drop it on the Front Panel.
Create an Array (Step 2 of 2)1. Place an Array Shell.2. Insert datatype into the shell (i.e. Numeric Control).
How Do I Time a Loop?1. Loop Time Delay Configure the Time Delay Express VI for seconds to waiteach iteration of the loop (works on For and While loops).2. Timed Loops Configure special timed While loop for desired dt.Time DelayTimed Loop
Control & Indicator Properties Properties are characteristics or qualities about an object Properties can be found by right clicking on a Control or Indicator Properties Include:– Size– Color– Plot Style– Plot color Features include:– Cursors– Scaling
Exercise 4.1 – Manual AnalysisTrack A,B,&C Use the cursor legend on a graph to:– Verify your frequency and amplitude measurementsThis exercise should take 15minutes.
Textual Math in LabVIEW Integrate existing scripts with LabVIEW for faster development Interactive, easy-to-use, hands-on learning environment Develop algorithms, explore mathematical concepts, andanalyze results using a single environment Freedom to choose the most effective syntax, whethergraphical or textual within one VISupported Math Tools:MathScript script nodeMathematica softwareMaple softwareMathSoft softwareMATLAB softwareXmath softwareMATLAB is a registered trademark of The MathWorks, Inc.
Math with the MathScript Node Implement equations and algorithms textually Input and Output variables created at the border Generally compatible with popular m-file script language Terminate statements with a semicolon to disable »MathScript)Prototype your equations in the interactive MathScript Window.
The Interactive MathScript Window Rapidly develop and test algorithms Share Scripts andVariables with the Node View /Modify Variablecontent in 1D, 2D, and 3DOutputWindowVariableWorkspaceView/ModifyVariable ContentsUser Commandsm-file Script(LabVIEW»Tools»MathScript Window)
Exercise 4.2 – Using MathScriptTrack A,B,&CUse the MathScript Node and Interactive Window to process theacquired signal (logarithmic decay) in the MathScript and savethe script.This exercise should take 25minutes.
Review of Data Types Found in LabVIEW
Exercise 5 – Apply What You Have LearnedThis exercise should take 20 minutes.Track A,B,&C
Section IV – Advanced Data Flow Topics (optional)A. Additional Data types ClusterB. Data Flow Constructs Shift Register Local VariablesC. Large Application Development Navigator Window LabVIEW Projects
Introduction to Clusters Data structure that groups data together Data may be of different types Analogous to struct in C Elements must be either all controls or all indicators Thought of as wires bundled into a cable Order is important
Creating a Cluster1. Select a Cluster shell.2. Place objects inside the shell.Controls»Modern»Array, Matrix & Cluster
Cluster Functions In the Cluster & Variant subpalette of theProgramming palette Can also be accessed by right-clicking the clusterterminal(Terminal labelsreflect data type)BundleBundle By Name
Using Arrays and Clusters with GraphsThe Waveform Datatype contains 3 pieces of data: t0 Start Time dt Time between Samples Y Array of Y magnitudesTwo ways to create a Waveform Cluster:Build Waveform (absolute time)Cluster (relative time)
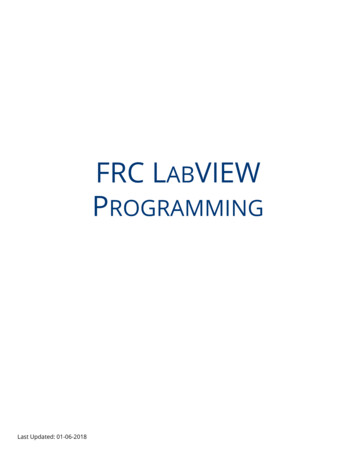
Shift Register – Access Previous Loop Data Available at left or right border of loop structures Right-click the border and select Add Shift Register Right terminal stores data on completion of iteration Left terminal provides stored data at beginning of next iterationInitialValueBeforeLoopBeginsValue 3FirstIterationSecondIterationLastIteration
Local Variables Local Variables allow data to be passed between parallel loops. A single control or indicator can be read or written to from more than onelocation in the program– Local Variables break the dataflow paradigm and should be used sparingly
LabVIEW Navigation Window Shows the current region of viewcompared to entire Front Panel orBlock Diagram Great for large programs* Organize and reduce program visual size with subVIs
LabVIEW Project Group and organize VIs Hardware and I/O management Manage VIs for multiple targets Build libraries and executables Manage large LabVIEW applications Enable version tracking and management(LabVIEW»Project»New)
Additional Resources NI Academic Web & Student Corner– http://www.ni.com/academic Connexions: Full LabVIEW Training Course– www.cnx.rice.edu– Or search for “LabVIEW basics” LabVIEW Certification– LabVIEW Fundamentals Exam (free on www.ni.com/academic)– Certified LabVIEW Associate Developer Exam (industry recognized certification ) Get your own copy of LabVIEW Student Edition– www.ni.com/academicBy Robert H Bishop.Published by Prentice Hall.
Section V – Modeling ToolsA. Simulation Diagram - Continuous time Simple model (integration) Feedback SubsystemsB. State Charts (optional)
The Design Process1.2.3.4.5.Modeling – Identify a mathematical representation ofthe plantControl Design – Choose a control method anddesign a controllerSimulation – Employ a point-by-point approach tosimulate the system timing with a solverTuning and Verification – Introduce real-worldnonlinearities, tune, and verify the control algorithmDeployment – Implement the finalized control system
LabVIEW Simulation Module Develop dynamic systems such as motor controllers andhydraulic simulators with LabVIEW Implement your dynamic systems with real-time I/O using builtin LabVIEW data acquisition functions Simulate linear, nonlinear, and discrete systems with a widearray of solvers Deploy dynamic systems to real-time hardware with the NILabVIEW Real-Time Module Translate models from The MathWorks, Inc. Simulink intoLabVIEW with built-in utility
The Simulation LoopInput NodeMain LoopOutput Node Built in Differential Equation Solver allows continuous-time system Similar to a While Loop with a predefined time period Installed with Simulation Module Double-click Input Node to configure simulation parameters Create an indicator on the Output Node to display Simulation errors
Simulation Loop Parameters Drag left node to show currentparameters and provide inputs forrun-time simulation configuration Double-click Input Node to configuresimulation parameters
Generating Simulation InputSimulations can utilize a wide varietyof signal sources: Simulated Signals– Step Input– Impulse– Front Panel User Input Real World signals– Data Acquisition Hardware
Capturing Simulation Output Use the Graph Utilitiesfunctions to plot one or moresignalsPlots are updated as theSimulation Loop executes
Exercise 6:Compute and view the position x(t) of the mass Construct a simulation diagram thatiterates the following steps over aperiod of time. Divide a known force by a knownmass to calculate the acceleration ofthe mass. Integrate acceleration to calculatethe velocity of the mass. Integrate velocity to calculate the F(t) – cx'(t) – kx(t) mx''(t)position of the mass. c is the damping constant of the spring Iterate over different stiffness values k is the stiffness of the springto see effect
Where Can I Learn More?We have only begun to explore the many opportunities for controland simulation within LabVIEW. Learn more by visiting the followinglinks:System Identification /nid/13853Control Design /nid/13854Simulation nid/13852LabVIEW Real-Time Module:http://www.ni.com/realtimeData Acquisition and Control IO Real-Time Platform:http://www.ni.com/compactrio
Educational Control PartnersQuanser – www.quanser.com– LabVIEW based curriculum and solutions– Linear, rotary, mechatronic and specialty control experiments– Uniquely modular, allowing multiple configurations for a wide range of experimentsQuanser QNET – 010DC Motor ControlQuanser QNET – 011Rotary Inverted PendulumModularLinear Pendulum3 Degree ofFreedomHelicopter
Educational Control PartnersEducational Control Products (ECP) – www.ecpsystems.com––––LabVIEW control templatesIntuitive systems provide unparalleled flexibility and dynamic fidelityIn use at over 400 universities and industrial sites world-wideProven to accelerate student learning while saving instructor timeECP Model 220Industrial PlantECP Model 730Magnetic LevitationECP Model 750GyroscopeECP Model 205Torsional Plant
Additional Resources NI Academic Controls Web– http://www.ni.com/academic/controls LabVIEW Student Edition DVD with Control Design and Simulation– http://www.academicsuperstore.com/ search: LabVIEW– Part Number: 752412 Connexions: Full LabVIEW Introductory Course– www.cnx.rice.edu– Or search for “LabVIEW basics” LabVIEW Certification– LabVIEW Fundamentals Exam (free on www.ni.com/academic)– Certified LabVIEW Associate Developer Exam (industry recognized certification )
Developing Applications with theNI LabVIEW Statechart Module
What are Statecharts?SystemInputsOutputsStatecharts are visual representations of reactive(event-based) systems.
Differences between Statecharts and FSMsBoth contain the same basic concepts:– States– TransitionsStatechart adds additional ed paradigmPseudostates & ConnectorsHButton PressBased on the UML statechart diagram specification
Reactive Systems Communication systems Digital protocols Control applications– Sequential logic– Batch processing– Event response– Non-linear controlState Machines User-interface implementation System modeling for virtual prototyping (simulation)
Statechart Benefits Abstraction– Simple semantics to represent complex systems– System-level view– Self-documenting
Machine & Process Controlhierarchyconcurrency
FPGA Logichierarchy
User Interfaceshistory
Statechart Benefits Abstraction– Simple semantics to represent complex systems– System-level view– Self-documenting Scalability– Easily extend applications– Open software platform Automatic Code Generation– LabVIEW Embedded Technology
LabVIEW Statechart Development1. Build statechart2. Define transitions and states3. Generate statechart subVI4. Place in LabVIEW blockdiagram
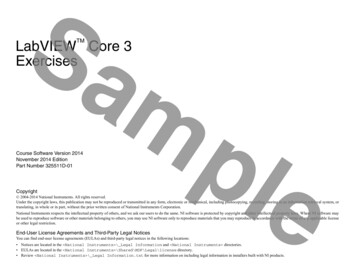
Example – Ceiling Fan Triggers– Power switch– Fan toggle– Light toggle Outputs– Light– Fan speedPowerFanHighmediumlowoffNo PowerLightFanLightonoffoff
Example – Ceiling Fan Triggers– Power switch– Fan toggle– Light toggle Outputs– Light– Fan speed Internal Data– Fan SpeedPowerNo PowerFanLightononFanLightoffoffoff
1. Build Statechart
1. Build Statechart
1. Build Statechart
2. Define Transitions and States Each Transition contains three components– Trigger – events that cause a transition– Guard – logic that can prevent a transition– Action – what happens when you transitionIf the doorbell ringsand an adult is home,answer the door.Curr State – DOOR CLOSEDTrigger – doorbell ringGuard– adult home?Action– open doorNew State – DOOR OPEN
2. Define Transitions and States Each Transition contains three components– Trigger – events that cause a transition– Guard – logic that can prevent a transition– Action – what happens when you transition Each state contains three types of actions– Entry – what happens when you get there– Exit – what happens when you leave– Static – what happens while you are there
2. Define Transitions and StatesTrigger-Guard-ActionTriggers
2. Define Transitions and StatesStatic ReactionInputsTrigger-Guard-ActionState DataOutputs
3. Build Statechart SubVI
4. Place in LabVIEW Block DiagramAsynchronous Usage– User interface– Interruption handling– Modeling event driven systems
4. Place in LabVIEW Block DiagramSynchronous Usage– Embedded applications– Communication protocols– Control implementations
Statechart Execution Evaluate the trigger/guard logic for thetransitions leaving the current state(s) On first valid transition: Execute the exit action(s) for the current state(s) Execute the transition action Execute the entry action(s) for all state(s) beingtransitioned to If no transitions are valid: Evaluate the trigger/guard logic for all staticreactions configured for the current state Execute the action code for all valid reactions
DEMO
What to do next? Visit ni.com/statechart– Demo videos– Statecharts 101 whitepaper– Statecharts with LabVIEW FPGA whitepaper– Try the LabVIEW Statechart Module online Demonstration from local Field Engineer
Section VI – Targets and DeploymentA. LabVIEW Real-timeB. LabVIEW FPGAC. LabVIEW Microprocessor SDK
Introduction to LabVIEW For Use in Embedded System Development. Lab Goals Become comfortable with the LabVIEW environment Ability to use LabVIEW to solve problems that arise during the analysis, design, prototype and deployment of Embedded . –Automatic Controls and Dy