Transcription
AIVC#13,513ASHRAE JournalSizing and BalancingAir Duct SystemsBy Robert W. Besant, P.Eng., and Yaw Asiedu, Ph.D.(1)Fellow ASHRAE0f the three duct design procedures recommended by the 1997ASHRAEHandbook-Fundamentals,o nlyT-method incorporates life-cycle cost. This method requires manydesigners.An ewleastl i fe-cyclec o s t,!'JP thecomputations, which makes non-cost optimizing techniques more attractivetowhere the section pressure drop for asteady flow rate Q iszprocedure for air duct system design is discussed in this article. The Initialhas the potential to reduce ducting system life-cycle costs and the time it takesto design them.-iDucting system design has many con straints such as low acoustic noise lev els, minimal heat gain or loss, no externalwater vapor condensation, insignificantleakage, good fire resistance, and goodstrength characteristics to resist implo sion or duct deformation. These con straints add to the cost per unit area ofducting.However, the main function of ductingis to satisfy the airflow rates specified foreach terminal for air diffusion in each airspace or room and exhaust air from thesame spaces. Thus, many air diffuser ter minals will be supplied by conditionedair from the supply air fans while exhaustair will be gathered from many grilles forall rooms in the building.Ducting systems are complex and ex pensive. Studies show that HVAC air ductsystems are one of the major electricalenergy consumers in industrial and com mercial buildings (Tsai et al. 1988a). Thelife-cycle operating costs for ducting airsupply and exhaust systems often exceedthe first cost (Carrier et al. 1998). A poordesign of an air duct system will lead towasted energy and/or excessive ductwork24ASHRAE Journalmaterial. Both oftbese increase the Life Cycle Cost (LC ). Becallse newly installedducting ystems 1,1sing t andard ductsizes usually don't satisfy the specifiedairfu w rates for each room, they require atime-consuming balancing effo1t.In designing an air duct system, thedesigner usually begins with a duct sys tem layout and specified airflow rates. Thdesigner selects and speci:fie the materi als for the ducts and fittings duct sizesand fan(s). Ideally these selectionshould be made so that all the designconstraints are satisfied and the LCC isminimized. The LCC ofa duct system com prises the initial or first cost and the op erating cost.The initial cost includes the fan, mate rials, labor, shop drawings, shipping anda mark up for overhead, maintenance andinsurance. The operating cost is usuallythe energy cost and, for many existingdesigns, it will exceed the ductingsystem's first cost for life cycles of 10 to20 years.T he cost directly attributable to a ductsection in a system is given by the- sumof the operating and capital costsfLD" 2.,c)v2 P2(2)and a life-cycle factor for operatingcostst h ree-stageDuct Sizing, Pressure Augmentation and Size Augmentation (IPS) method(whereE Q L1 P LDf .,D":LC (Ed EJ)PWEF77/'7,,,(3)Present worth owning andoperating cost (LCC)Airflow rate in duct section(m3/s)Pressure losses in duct section(Pa)Unit duct cost as installed(cost/m2)Duct length (m)Equivalent by cost diameter(equal to D for circular and forrectangular ducts)(m)Friction factorHydraulic friction diameter (m)Summation of dynamic losscoefficient for duct fittingswithin the duct sectionFlow velocity (mis)Air density (m3/kg)Energy demand cost (cost/kW)Unit electrical energy cost(cost/kWh)About the AuthorsRobert W. Besant, P.Eng., is pro fessor emeritus at the University ofSaskatchew 1n, Canada. He is mem ber of ASHRAE Technical Committee5.5, Air-to-Air Energy Recovery.Yaw Asiedu, Ph.D., is -a researchengineer at Venmar CES, Saskatoon,Saskatchewan.www.ash raejournal . orgDecember 2000
ASHRAF;:JournalT Operational time (hours/year)PWEF PresentworthescalationDuctSectionfactor1J77 / Motor drive efficiency111Length(m)Flow sesCoeff"1c1entt(Pa) Fan total .7Rectangular2120.22Roundwhile the capital cost increases. A proce 380.92Rounddure is needed to balance these conflict 4160.5519.811.42shows that the operating cost decreasesing cost elements to determine the ductsizes needed to minimize the LCC of theduct system and to satisfy all design con straints. Presized height of 254 mm.The ASHRAE Handbook-Funda mentals recommends three design pro cedur es: the equal friction method,staticregainmethodandtheT-method. The equal friction and staticproaches result in designs that are work Kinematic ViscosityThe T-method is anLCCoptimizingducting system condensation, fan selec tion and system expansion (a detailed dis Fitting loss coefficient. Presized 330 mm diameter duct0.0003 m1 .54x10-5 m2/sAir Density1.2 kg/m3Fan Efficiency0.75Motor and DriveEfficiencyable but are not cost efficient.method. It consists of three main steps:0.33 Economic DataAbsolute Roughnessregain methods are non-optimizing meth conditions. These single-step design ap 0.254"General Dataods that rely on heuristics that do notaccount for prevailing local economictTotal System Airflow.2514With increasing duct size, Equation 1LossEnergy Cost2.03 c/kWhDuct Cost (as installed)43.27 /m2System Operation T i me4,400 h/yearPWEF8.610.801.42 m3/sTable 1 : Duct input parameters.cussion and illustration of this methodcan be found ih Tsai et. al.[1988 a&b]).Although the T-method is the mostwidely used optimization approach in airduct design, this method does not ad dress the constraint dealing with stan dard duct sizes very well. This constraintis relaxed throughout the design proce dure and incorporated at the end throughthe use of a heuristic. For ducting sys tems with large numbers of components,this method does not ensure that the de sign is optimal. More importantly, the pro cessof system condensation andexpansion requires many computations.The IPS method eliminates the need .93490.228619701975150.381023537.5272.5Table 2: Initial sizing before pressure balancing.condense and expand the system (Asiedugives the pressure loss per unit length inet al.This approach also avoidsmendation is not economically justifiedstraight circular ducts for different flowusing a heuristic by choosing a standardbecause costs are not included in therates for ducts of selected diameter or air 2000).size based on the optimal LCC. Althoughthe initial sizing of the duct sections cananalysis. This section discusses the de flow velocity. This chart can be used tovelopment of the enhanced friction chartselect the initial sizes of ducts during de that incorporates economic information.2000be done using a set of equations that willsign. Designers using the equal frictionbe introduced later, a chart is developedapproach often rely on this chart to selectstraight circular duct section with no fit the.initial and final sizes of the ducts. Thetings, the optimal ducLsize for a circularFundamentals Handbook states that theduct is given byto simplify these decisions. The method ology is illustrated with an example.best economical designs will have ductEnhanced Friction ChartThe ASHRAE friction -chart (Figure 1)26ASH RAE J ournalAsiedu et al.sizes selected with frictional losses withinthe dark bana of Figure 1. This recomwww.ash raej o urn al. org6D shows that for a8xp( rh3J 77:3103 sd-(4)December 2000
ASHRAE JournalThe duct section property, Z/( l 000,S:,):::;-:;µ:: - M 5BR ·;;: Fi'' ',./-.P.1.-,4.:::.;.J , :,/.l--A-::.!.-J,4.,: .i.1- ;:,.µ. l :'f.HI . .- .,.,, . .,. ,m2/k.W, is termed the Economic Factor,""l- JP.;.-,r--.:-f '* --1-11' 'because it incorporates all the e c onomicrelevant to the des i gn problem.factor.L-M- -i-J, 70 /.f o!. .- Px-l-1'-- "bl-l i""" soWith the exception off, which is depen dent on D (and sometimes Q), all the val ues on the right-hand side of Equalio11 4are kno wn.A chartcan be developed todetermine the va l ue of D and conse quently f, for various values of the eco nomic factor and flow rate. Figure 2 isthe enhanced friction chart (this is for aiTwith p l .2 kglm3 (0.0748 lb/fPJ and ductsw·tace roughness e 0.3 nun (0.012 in.)with fully developed turbulent flow).The significa nt difference between the0.3charts in Figure 2 and Figure 1 is the re 0.2p.lacement ofthe velocity lines oftbe stan dard ftiction chmt with the economi factorlines. In using the standard friction chartto size a duct, onlythe flow rate of theduct section is considered. For instance, ifAlll QUANTlTY, lls al 1.20 kglm3Figure 1 : Frictiona duct with aflowrateof0.1 m3/s (213 cfm) is to be sized using thechart (E 0.09 mm).PathSectionsPressure Loss(Pa)les of tl1e valoes ofthe economic parameters i.e., cost ofmate1ialsPressureDifferential(Pa)15.4470114will depend on the expertise of the de igner whom, to some de 25-3-2584035-3-152658friction cl.tart in (ASHRAE 1997), it is reconm1e.nded that we se lect a duel ize between 130 and 200 mm (5.1 and.7.9 in.) regard cmd energy, fan efficiency, operation time, etc. The selected size'gree, may c onsider the aforementioned economic parameters 'inthe process. Evider1tly different des ign e rs may arrive at differentduct izes give11 the same problem.The new chart removes tl1(s incon istency while incorporat ing the eco:no m ic paramt::l1::!'in the initial sizing of the duct.With the enhanced friction chart, after the flow rate and eco nomic facto · are fixed, the size is also fixed al a un ique value(this is subject to minor errors caused by the reading of thed iameter from the chart). To use the e nhanced friction chart fora d uct design problem,first c a lculate the economic factor forthe duct section and i d enti fy that line on the chart. The ductdiameter should then be selected so t hat the flow rate, the eco nomic fac tor and the diamete r line intersect.Table 3: Path losses before pressure balancing.porate tbiinformation in the form of a ch ru1 because of theou lhe width or vice versll. However,in designing rectangular sections , one could select lhe equiva lent round d uct and tben approximate the dimensions of therectangular ductusing t h etablesin A.SHRAEHandbook-Fundamental .dependence o fthe heightInitial Duct SizingThe procedurecLiscusscd earlier is illustrnted by a simple HVACFor example, ifa duct with allow r ate ofO. I 013/s (213 cfm) isafr duct design problem. This is the duct-sizing p roblem frommm (5.9 in.), and 100 mm (3.9 in.) for ec onomic factors ofthose made therein. The results are comp ared to that of the T sized using the new chiut, t he size would be 180 mm (7 .1 in.), 150J m2/kW (0.454 in.2 h/Btu), 0.2 m2/kW (0.Q908 in .2 11/Btu) aod 0.03m2/kW (0.0 136 in.2 h/Btu) respectively (note that the surfaceroughness e 0.3 mm; for a chai:t with e 0 . 09 mmee Asieduet al. 2000) (Tsai et aJ. 198 b) and the assu mpti ons made here are s imilar tomethod. The layout of the duct system is how.o in Figure 3.Table 1 shows the sp eci fied duct lengths and flow rates. Othergeneral and economic parameters are ho wn later. For this prob lem it is assumed that the dynamic loss coefficients of the fit tings are known constants independent of the flow rates.Sizing Rectangular DuctsFor a straight rectangular duct section with no fittings andthe height (ff) pres um ed fixed by the ceiling clearance, tbe op timal width is given by.w4Unlike Equation 428 2WP(zJQ3/(2 3H)(5)103Sd- 4Jflfor the rou11d duct, it is difficult to i 11 cor-ASHRAE JournalFrom the data the economic factor is calculated to be 0. 029m2/k.W (0.0132 in.2 h/Btu). Using this value and the flow rates,the initia l duct diameters of 160 mm (6.3 in.), 220 mm (8.7 .in.) and370 mm (14.6 in.) are selected for d uct sections 2, 4 and 5 re spectively and an equivalent duct diameter of260 mm (10.2 in.)i chosen· for duct section 1. The corresponcLing width, given aheight of254 mm (I 0 in.), is a pproxim ateiy 220 mm (8.7 in.). Achoice be tween the two standard duct sizes IDl (the smallestwww.ashraejournal.orgDecember 2000
--------· -- --·· - .:. . ,.BalancingDor WPath Press ures 20464526156Reject5s310.177847046548621AcceptTable 4: d duct size D) and LDJ (the largest standard duct size D) will need to be made. This is done by computing the costassociated with each duct size using Equation 1 and selectingthe size that gives the lower cost. Standardizing these sizesbased on 25.4 mm (1 in.) increments gives the sizes and ductpressure drops (calculated from Equation 2) shown in Table 2.The path pressures are shown in Table 3.Pressure BalancingOne constraint on the air duct system is the equality of pres sure drop between any two paths. This is achieved by balanc in the ressure dro s amon each of the flow aths. The(m)procedure outlined for initial sizing did not consider that. Ascan be seen from Table 3, the current design is not balanced.This is often the case in duct system design. In such a situa tion, the sizes of the ducts must be modified to ensure an ac ceptable pressure balance. The process of pressure balancinghas been seen as an art that depends mostly on the skills of theperson doing the design (a systematic approach to this pro cess, other than trial and error, has not been found in the litera ture). A new systematic approach to pressure balancing ispresented later. Before discussing this, it is necessary to intro duce a few terms:3/4" DISC THERMOSWSsOur Service Makes The DlnerenceToll Free 1888) 229-2332Fax (714) 712-6222www.selcoproduct .com(Circle No. 38 on ReaderService Card)December 2000(Circle No. 41 on Reader Service Card)ASHRAE Journal31
ASHRAE JournalInitial Cost ( )Energy Cost ( )Total Cost ( 330046.9046.93Table 5: Tracking of LCC of duct system.90.203219701975150.381023537.5272Table 6: Duct sizes and section pressure losses after pres-the path with the highest path pressure loss.Dominant Sectiona duct section on the dominant path.Path Pressure Differentialthe difference between the domi nant path pressure loss and the pressure loss of any other path.Duct Occurrence Density is defined asDominant Path4 sure balancing. i5x Number ofpaths with duct section x co11in101zTotal number ofpaths(6)The aim of the new algorithm is to attempt to balance thesystem without increasing the initial system pressure. How ever, when this is not possible, the algorithm permits an in crease in the system pressure to balance the system. Thealgorithm given later is divided into two separate stages. Theseare the two latter stages of the three-stage duct sizing process,i.e., Initial Duct Sizing, Pressure Augmentation and Size Aug mentation, henrn the mnemonic, !PS-Method. The two stagestogether constitute the pressure balancing procedure. Initialduct sizing using the Enhanced Friction Chart has already beendiscussed. As stated earlier, mathematical equations may beused for this purpose. They are presented in a later section.PathSectionsPressure Loss(Pa)PressureDifferential (Pa)15-44701625-3-24652135-3-14860Table 7: Path losses after pressure balancing.verse the change and take that duct off the duct list onto atemporary duct list and go to Step P4.P9. If the pressure distribution is satisfactory, stop and selectthe fan. Otherwise, if there are no more paths on the pathlist and no ducts on the temporary duct lists, go to the SizeAugmentation stage. Go to Step P2.Size AugmentationSl. Rank the dominant sections according to the duct occur rence density in ascending order. However, do not includePl. Identify the dominant path and sections.any duct with o 1.P2. Rank each path. Paths with higher path pressure differen S2. Select the duct ranked highest in the duct list created intials must be ranked higher. Do not include the dominantStep 1. If no duct sections exist, stop. That is th bestpath in this ranking.possible design. Select the fan.P3. Rank the non-dominant duct sections according to the duct S3. If the size of the duct section cannot be further increased,occurrence density Equation 6 in descending order. Dotake the duct off the duct list and go to Step S2. Otherwise,not include the ducts taken off the duct list in Step P6.increase the size of this duct.P4. Select the path at the top of the path list created in Step P2. S4. Calculate all the new path pressures.If no path exists in the path list go to Step P9.SS. If the change in Step S 3 results in a violation of a constraintPS. Select the duct from the path that is ranked highest in theor a higher maximum pressure differential, reverse the changeduct list created in Step P3. If no such duct section exists,and take that duct off the duct list and go to Step S2.take the path off the path list and go to Step P2.S6. If the pressure distribution is satisfactory, stop and selectP6. If the size can not be reduced any further, take the duct offthe fan. Otherwise, go to Step P l .the duct list and go to Step PS. Otherwise, reduce the sizeIt i s conceivable that the algorithm's exit from Step S2 willresult in a final design that will have a maximum pressure differ of this duct.ential that is more than desired. To verify if this is the bestP7. Calculate the path pressures.P8. If the change in-Step P6 results in an unacceptable design possible pressure distribution, the procedure can be repeated(i.e., violation of a constraint, a higher maximum pressure with Step P8 replaced with Step P8A.- differential or a change in the-dominant path without an P8A. If the change in Step P6 results in an unacceptable design (i.e., violation of a constraint or a higher maximum presaccompanying satisfactory path pressure distribution), re- Pressure Augmentation 32ASHRAE Journalwww.ash raejournal.o rgDecember 2000
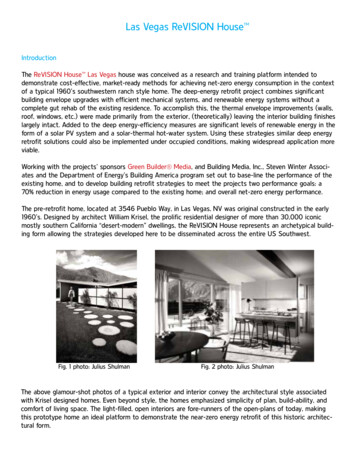
ASHRAE; .Journalsure differential) reverse the changeand take that duct off the duct listand place it onto a temporary ductlist If the highest path pressure lossis more than the current systempressure, set the system pressureto this value. Go to Step P4.This will explore the possibility of in creasirig the system pressure to achievea better pressure distribution in the sys tem. The algoritlun with Step PS shall bereferred to as the Standard JPS-methodand that with Step P8A as the Revised·JPS-method.Pressure BalancingIn the earlier section, the algorithm forbalancing a duct system was presented.In this section, its use is illustrated. The10.01process of pressure balancing requires theFlow Rate (m3/s)value of the duct occurrence densities.These values are 0.33, 0.33, 0.67 and 1 for Figure 2: Enhanced friction chart (E 0.03 mm and p 1.2 kg/m3).duct sections 1, 2, 4 and 5 respectively.The actual process of pressure balancing is shown in Table 4.This shows the duct that is changed at each iteration, the stage35of the procedure (i.e., P for pressure augmentation and S for sizeaugmentation) and the consequence of the change.The Decision column indicates whether or not the design42change was accepted. Table 5 shows the changes in the life cycle cost of the system through the pressure balancing proce dure. The rovJ!: in bold type correspond to the changes that.were accepted. As is evident from Table 5, the life-cycle costFigure 3: Five-section duct system (Tsai et al. 1988b).was successively reduced from the initial value of 3,7 76 to 3,672 where the initial cost increased by 2.5% but the operat ing cost declined by 1 7%. The final duct sizes and duct pres tings is given bysure drops after pressure balancing are slfoWn in Table 6 andD58pzthe path pressures in Table 7. With the exception of duct sec (7)7r3103SdLtion 5, the sizes are similar to that obtained with T-method (Tsal· -- ( I Q3 jvcl.:i·et al. 1988b). The smaller size in this solution increases thesystem pressure that results in a slightly higher cost than theT-method design ( 3,626, a difference of 46or1%). This showsthat the !PS-method is capable of determining the optimal de sign while avoiding the tedious mathematical computationsassociated with the T-method.whereAc SjL 4.L,CD(8)If the dimension of one side (usually the height) of a rectan gular duct section has already been fixed, then the optimal di mension of the other side of the duct can be determined usingExpressions for Initial Duct Sizing(9)In using the enhanced friction chart, the initial duct size wasdetermined assuming that no fittings were in the duct section.whereIn reality, every duct system would have fittings. This can beincorporated into the earlier procedure using an economic fac(10), tor that is slightly higb r (i.e., a lower line on the chart) than theeconomic factor initial / calculated. For example, if the dynamiclesses are expected to rncrease the losses by 25% and the cal This implies an iterative solution because Dis on both sidesculated economic factor is 2, a revised economic factor of2x( 1 of Equation 8 when .LC is significant and W is also on both0.25) 2.5may1:0 dSeu i1J tead. A better approach is to use a set sides of Equation JO. The duct section property, A or A , isncof mathematical-equations already developed. Asiedu et al. (2000) defined as the Friction Parcuneter. Hand W iri Equations 9andshowed that the optimal"size of a round duct section with fit- JO and all other expressions involving these two parameters 34ASHRAEJournal-www. ash raejo u rnal.orgDecember2000
1.--ASHRAE Journalduct design is presented and its use isillustrated by solving a sample problemand comparing the design selections withthe T-method. A new algorithm for pres sure balancing eliminates guessing or theneed for an exact analytical solution. Withthe !PS-method, the overall fan efficiencymust be known or assumed but the finalfan selection is made after the ductingsystem pressure drop is calculated for theleast LCC design. The enhanced frictionchart is a tool that is easy to use and yetincorporates all the important LCC costfactors in the first iteration of the designprocedure.would have to be switched in cases wherethe width is fixed and the height needs tobe determined.In the development of Equations 7 and9, it was assumed that LC was indepen dent of D and W respectively. In reality,this is not true (Brooks 1993). However,the error introduced by this assumption isno worse than the uncertainty associatedwith the calculation or determination ofLC. Rahmeyer 1999a&b showed that theloss coefficients for piping fittings variedby25% for standard elbows and 100% fortees). Interested readers are referred toAsiedu et al. 2000 for a discussion on de sign systems with fittings and duct costSd, dependent on the duct size.The need for a simple design method ology that enables the design of economi cally efficient HVAC air duct systems isevident by the continual use of designmethods that do not directly consider costfactors. In this article, the !PS-method foring." ASHRAE Transactions, 106(1): 124 142.3. Brooks, P.J. 1993. "New ASHRAE localloss coefficients for HVAC fittings." ASHRAETransactions, 99(2):169 -193.4. Carriere, M., G.J. Schoenau and R.W.Besant. 1998. "A revised procedure for ductdesign with minimum life-cycle cost." ASHRAETransactions, 104(2):62- 67.5. Rahmeyer, W.J. 1999a. "Pressure losscoefficients of threaded and forged weld pipefittings for ells, reducing ells, and pipe reduc ers." ASHRAE Transactions, 105(2).6. Rahrneyer, W.J. 1999b. "Pressure losscoefficients of pipe fittings for threaded andforged weld pipe tees." ASHRAE Transac AcknowledgmentsConclusion2. Asiedu, Y., R.W. Besant and P. Gu. 2000."A simplified procedure for HVAC duct siz tions, 105(2).This research was funded by the Natu ral Sciences and Engineering ResearchCouncil of Canada and Atomic EnergyCanada Limited.1988a. "T-method duct design, part I: opti References1988b. "T-method duct design, Part II: calcu tals, SI edition. Chapter 32, "Duct Design."ASHRAE Transactions, 94(2):112-150.7. Tsai, R.J., H.F. Behls and R. Mangel.mization theory." ASHRAE Transactions,94(2):90- 111.8. Tsai, R.J., H.F. Behls and R. Mangel.1. 1997 ASHRAE Handbook-Fundamen TIME TO SWITCH!FROM ANALOG TO DIGITAL,'. thebenlation procedure and economic analysis." LINEAR AND CURVED SLOT DIFFUSERSHave a custom application others won't touch?Need a guaranteed delivery date - no excuses?OFFERSONE STOP SHOPPING!TR-613 3-ChannelTR-654 4-ChannelDigital Time SwitchDigital Time SwitchWhen othersuppliers say theycan't, don't or won't, callAir Factors. For over 35years we've been supplyinginnovative stock and customBsolutions to meet the mostchallenging architectural andChannelProgrammabledesign requirements. And ourQuickShipTime ControlPlum-8724 Hour andDayTR-610 Single Channel,Single and DualTR-612 Dual ChannelChannel AnalogDigital Time SwitchesTime SwitchesNATIONALLY DISTRIBUT D BYA;}':.,··- .,./LUMEN/TECONTROLTECHNOLOGY, INC.oi3.3;t N ""' t'Ut A "''' Franklin Park, ///Inoi11 60Pl'1ona (847J 455-1450 - Toll Fraa (BOD} 323-8510 F (Circle No. 37 on Reader Service Car36ASH RAE Journalprogram ensures thefastest, most dependable deliveries.For a catalog, product samplesand the name of your local Air Factorsrepresentative, call 925.484.2002 ore-mail info @airfactors.com AIRFACTORS(Circle No. 36 on Reader Service Card)December 2000
ASHRAE Journal AIVC #13,513 Sizing and Balancing Air Duct Systems By Robert W. Besant, P.Eng., and Yaw Asiedu, Ph.D. Fellow ASHRAE 0 f the three duct design procedures recommended by the 1997 ASHRAE Handbook-Fundamentals, only the T-metho