Transcription
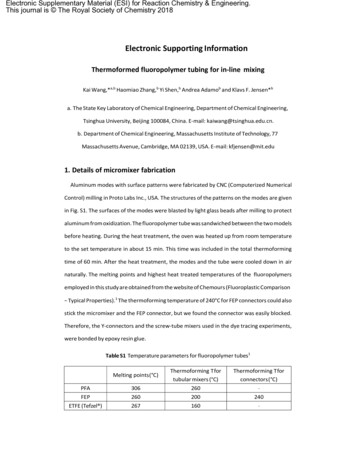
Electronic Supplementary Material (ESI) for Reaction Chemistry & Engineering.This journal is The Royal Society of Chemistry 2018Electronic Supporting InformationThermoformed fluoropolymer tubing for in‐line mixingKai Wang,*a,b Haomiao Zhang,b Yi Shen,b Andrea Adamob and Klavs F. Jensen*ba. The State Key Laboratory of Chemical Engineering, Department of Chemical Engineering,Tsinghua University, Beijing 100084, China. E‐mail: kaiwang@tsinghua.edu.cn.b. Department of Chemical Engineering, Massachusetts Institute of Technology, 77Massachusetts Avenue, Cambridge, MA 02139, USA. E‐mail: kfjensen@mit.edu1. Details of micromixer fabricationAluminum modes with surface patterns were fabricated by CNC (Computerized NumericalControl) milling in Proto Labs Inc., USA. The structures of the patterns on the modes are givenin Fig. S1. The surfaces of the modes were blasted by light glass beads after milling to protectaluminum from oxidization. The fluoropolymer tube was sandwiched between the two modelsbefore heating. During the heat treatment, the oven was heated up from room temperatureto the set temperature in about 15 min. This time was included in the total thermoformingtime of 60 min. After the heat treatment, the modes and the tube were cooled down in airnaturally. The melting points and highest heat treated temperatures of the fluoropolymersemployed in this study are obtained from the website of Chemours (Fluoroplastic Comparison Typical Properties).1 The thermoforming temperature of 240 C for FEP connectors could alsostick the micromixer and the FEP connector, but we found the connector was easily blocked.Therefore, the Y‐connectors and the screw‐tube mixers used in the dye tracing experiments,were bonded by epoxy resin glue.Table S1 Temperature parameters for fluoropolymer tubes1Melting points ( C)Thermoforming T fortubular mixers ( C)Thermoforming T forconnectors ( C)PFA306260‐FEP260200240ETFE (Tefzel )267160‐
Fig. S1Structure parameters on the aluminum modes. (a) Screw pattern, (b) Slant groovedtunnel and split‐recombined tunnel. (c) Pattern for the Y‐connector. The length unit is mm.In order to make longer tubular micromixers, which are able to enhance mixing in low Reregime, the tube needs to be heat treated part by part. However, the oven would potentiallydestroy the formed patterns on the tube surface; therefore, we improved the heating sourceusing heating rods, sensors and temperature controllers to ramp up the modes temperature.A picture for the whole apparatus is shown in Fig. S2, and we found this heating method didnot influence the patterns on the surface of mixer. Using this method, the tubular mixers canbe fabricated as long as possible.
Fig. S2Pictures for the improved heating system and longer fabricated tubes.2. Dye tracing experimentsIn order to show fluid mixing in micromixers, dye tracing experiments were implementedwith two aqueous solutions that contained 0.062 wt% erioglaucine (blue, Sigma‐Aldrich) and0.10 wt% Rhodamine B (red, Sigma‐Aldrich), respectively. Those solutions were fed by syringepumps (PHD Ultra 2000, Harvard Apparatus) into the tubular mixers through the Y‐connector.Limited by the intrinsic view field of the microscope, an image joint method was used tovisualize the whole mixer in Figs. 2(b), 2(c) and S3, for the steady‐state flow patterns in thesystems. To illustrate the mixing process more accurately, videos of the mixers were recordedwith moving cameras and attached in the paper.
Fig. S3Pictures of typical dye tracing experiments. (a) Original tube ID (inner diameter) 0.5 mm, Qblue 0.4 mL/min, Qred 0.8 mL/min. (b) Original tube ID 0.5 mm, Qblue 0.2 mL/min,Qred 1.0 mL/min. (c) Original tube ID 0.75 mm, Qblue 1.0 mL/min, Qred 2.0 mL/min. (d)Original tube ID 0.75 mm, Qblue 0.8 mL/min, Qred 4.0 mL/min. (e) Original tube ID 1.0mm, Qblue 2.0 mL/min, Qred 4.0 mL/min. (f) Original tube ID 1.0 mm, Qblue 0.4 mL/min,Qred 2.0 mL/min.Experimental movie 1: Screw‐tube mixer, original ID 1.0 mm, Qblue Qred 0.5 mL/min.Experimental movie 2: Screw‐tube mixer, original ID 0.75 mm, Qblue Qred 0.5 mL/min.Control group movie 1: Straight tube, original ID 1.0 mm, Qblue Qred 0.5 mL/min.Control group movie 2: Straight tube, original ID 0.75 mm, Qblue Qred 0.5 mL/min.3. CFD (computational fluid dynamics) simulationsThe working mechanism of the screw‐tube mixer is to force the fluids rotate along the axialdirection of the tube, which is similar to the stirrers in vessels. This mechanism can be clearlyillustrated by the CFD simulations of flow field in a 10 mm long screw‐tube mixer (Fig. S4(a)).
Laminar models for inexpressible fluids, including the continuity equation, the Naiver‐Stokesequation and the diffusion‐convection equation (Eqn. S1 to S3) were solved, and all the Re forthe simulation tests were below 100. u 0(S1) u u p 2u(S2)u C D C (S3)Here, u is the velocity vector, ρ is the density (0.998 g/mL), µ is the dynamic viscosity (1 mPa s),p is the pressure, C is the dye concentration, and D is the diffusion coefficient (D was set to 1 10‐9 m2/s in this study). The geometry of the screw‐tube mixer shown in Fig. S4 with 0.8 mmmajor diameter and 0.5 mm minor diameter was generated by SOLIDWORKS. This geometryhad a little difference from the inner structure of the thermoformed screw tube with 0.75 mmoriginal ID (Table 1) to avoid the errors in building calculation cells in the CFD simulation. Thegeometry was then imported into COMSOL Multiphysics 5.3a and about 7 million tetrahedrongird cells with 0.0415 mm maximum gird length were used in the calculation as shown in Fig.S4(b). The left end surface was set to the fluid inlet with a constant flow rate (Qin 1.0 mL/min)and the right end was set to the outlet with atmosphere pressure. A step function was usedto set the top half of the inlet to a dye concentration of 10 mol/m3 and the bottom half to 0mol/m3. The calculation took about 3 hrs in a Thinkpad P50 Workstation with Intel Core i7‐6820HQ CPU @ 2.70 GHz, and 64 GB memory. We have proved that the mesh size was smallenough for accurate results, and the effect of numerical diffusion could be neglected based ona mesh independent study shown in Fig. S4(c).
Fig. S4 Structure details of the simulation and mesh independent study. (a) Size parametersof the screw‐tube mixer and the settings of inlet and outlet. (b) Local mesh in the simulation.(c) Mesh independent study of the reactor outlet surface. The 1 million mesh elements wererange from 0.0112 to 0.0594 mm and the 7 million mesh had a size range from 0.00448 to0.0415 mm.The simulations were further extended to the whole mixer as shown in Fig. S5. A T‐connecter was employed as the inlets of fluids with different flow rates (Qdye and Qblank). At theoutlet the pressure used the atmosphere value. A no‐slip boundary condition wasimplemented at the wall. This model has comparable grid density to the 10 mm screw‐tubemixer simulation. A typical result of the flow direction in the screw‐tube mixer is given in FigS5(b). We can see periodic flow directions in the mixer, in combinations of forward and rotatingflows. Fig. S5(c) shows the dye concentration in the mixer in different operation conditions. Inthe screw‐tube mixer, the rotating flow pattern makes substance blend very quickly as theuniformed color shown on the tube cross‐section. Fig. S5(d) displays the pressure drop alongthe mixer. It is clear that the pressure drop is severer in the screwed part, but the total pressuredrop is only as high as 0.353 kPa at total flow rate of 1 mL/min.
Fig. S5 CFD simulations for the fluid flow and concentration profiles in the screw‐tube mixer.(a) The geometry of the screw‐tube mixer connected to a T‐connector. (b) Flow directions ofthe fluids. Qdye Qblank 0.5 mL/min. (c) Dye concentration profiles at different flow rates. (d)Pressure drop in the mixer. Flow rates are Qdye Qblank 0.5 mL/min.4. Villermaux‐Dushman reaction experimentsThe mixing performance in the screw‐tube mixer was quantified by using the Villermaux–Dushman reaction (also known as the iodide–iodate method), which is commonly employedfor charactering micromixers.4, 5 The principle of this method is based on the rate competitionof a quasi‐instantaneous reaction of acid and base (H and H2BO3‐), and a fast reaction betweenI , IO3 , and H , which is relatively slower.H2BO 3‐ H H 3BO 3 (quasi‐instantaneous)5I‐ IO3‐ 6H 3I2 3H2O (very fast)‐I2 I I‐3(S4)(quasi‐instantaneous)The reaction rate constant of the second reaction r2 k2[I‐]2[IO3‐][H ]2 is a function of ionicstrength I, as logk2 9.28‐3.66I1/2, at I 0.16 mol/L, and logk2 8.38‐1.51I1/2 0.23I, at I 0.16
mol/L, which is about 108 m12/(mol4s) in this experiment. The reaction rate constants of thethird reversible reaction r3 k3[I‐][I2]‐k3’[I3‐] are k3 5.6 106 m3/(mol·s) and k3’ 7.5 106 1/s,according to the literature reported by Fournier et al. 6 When the molar amount of H is smallerthan the amount of H2BO3‐, the yield of I2 I3‐ is mixing sensitive. Therefore, the segmentedindex, XS,4, 7, which ranges from 0 to 1, is introduced to quantify the relative yield of I2 I3‐ to itshighest value in theory. XS is calculated as follows: 2 nI2 YX S YST 6C IO ,03I n 6C3IO ,03 C nH ,0 CH BO ‐ ,0 2I2 CI QT 63nH ,03 C IO3 ,0C‐H2BO3 ,03CIO ,0(S5)3where Y is the yield of I2 I3‐ in experiment; YST is the yield in infinitely slow mixing conditions;n is the molar flow rate; C is the concentration; QT is the total flow rate of the mixture; andsubscript 0 represents the original reactant solutions.Fig. S6 shows schematics of the experimental apparatus. T‐connectors were used to blendthe solutions, then reactions occurred in the following tubes. The ID of the T‐connector was 1mm. The original tube IDs of the screw‐tube mixers were chosen from 0.5, 0.75 and 1.0 mmin different experiments, and 0.75 ID coiled and straight tubes were tested as controlexperiment. An inline UV‐vis spectrometer (Ocean Optics 2000 ) with a self‐assembled quartzflow cell (ID 0.6 mm) was used to measure the concentration of I2 I3‐ at 286 nm, and XS wassubsequently calculated. I‐ is usually in excess to keep the ionic strength of the solution andfacilitate as much as I2 to convert to I3‐ for UV‐vis analysis. The equilibrium constant K [I3‐]/[I‐][I2] is 736 L/mol at 25 C.8 All the lengths of the screwed parts in the tubular mixers were72 mm. A 120 mm long tube with the same original ID of the mixer connected the micromixerand the flow cell. The coiled tube shown in Fig. 6S(b) has 2 circles and the loop diameter was32 mm, smaller than which the tube became flat. The total length of the coiled and straightconnection tube are 400 mm. Fig. S6(c) shows the control group experiment using a straighttube, which is also 400 mm in length. H2SO4 aqueous solution was used as the acid, which islabeled to Solution A in Fig. S6. This solution contained 0.02 mol/L H . Solution B was a mixtureof KH2BO3, KI and KIO3, whose concentrations were 0.041, 0.02 and 0.0027 mol/L, respectively.All water used to prepare the solutions had been degassed by at least 2 hours N2 bubbling ina stirred vessel to remove O2. The chemicals were from Sigma‐Aldrich.
Fig. S6Schematics of the Villermaux‐Dushman reaction platforms. (a) The screw‐tube mixer,(b) the coiled tube, and (c) the straight tube.5. Residence time distribution (RTD) experimentsThe RTD experiments were implemented in a platform shown in Fig. S7, with water as atesting solution. In order to determine the RTD solely from the screw‐tube micromixer, a by‐pass test, shown in Fig. S7(b), was carried out to exclude the influence of tracer injection anddetection. A 6‐way check valve (Idex Health & Science) is used to inject the tracer, a 0.1 wt%erioglaucine aqueous solution. The quantified tube on the 6‐way check valve has a 0.5 mm IDand 10 or 30 cm length (longer tube was used at Q 1 mL/min). The flow rate is controlled bya syringe pump (PHD Ultra 2000, Harvard Apparatus). The mixer locates after the check valve,and is connected to the flow cell of the UV‐vis spectrometer with a 0.75 mm ID connectingtube. Different from Villermaux–Dushman reaction experiment, the flow cell was an FEP tubewith 0.75 mm ID in this study, and a connecting tube was also used between the micromixerand the flow cell. The 6‐way valve and the UV‐vis spectrometer were synchronously controlledby a homemade LabVIEW program (National Instruments).
Fig. S7Schematics of RTD experimental platforms. (a) The entire platform for measuringRTD in the screw‐tube mixer. (b) The platform to obtain by‐pass RTD.After recording the tracer concentration function C(t), the time distribution function E(t),and the mean residence time , were calculated by Eqn. S6 and S7 using a MATLAB program.E t 0C t (S6)C t dt t C t dt Vt C t dt Q 0(S7) 0Here, V is the volume of the tested tube and Q is the flow rate. Based on the by‐pass and totalexperiments, the time distribution functions in the screw‐tube mixers are regressed by aconvolution of E, Cby‐pass and Ctotal.Ctotal E(t) Cby‐pass(S8)A dimensionless dispersion model with “open‐open” boundary conditions, as shown in Eqns.S9 to S11, is employed in Eqn. S8.9E( ) 14 Dscrew / uL 1 2exp 4 Dscrew / uL (S9)E( ) tE(t)(S10) t / t(S11)
where θ is the dimensionless time variable, Dscrew is the longitudinal dispersion coefficient ofthe micromixer; u is the mean velocity; L is the length of mixer. The Dscrew was regressed usinga MATLAB program. The time distribution functions E(t) from experiment and the calculatedresults are compared. Typical results are given in Fig. S8, corresponding to 3 different originalIDs.Fig. S8 Comparisons of E(t) from experiments and calculation for three mixers with differentoriginal IDs. Q 1 mL/min. The blue lines named mixer are correlated E(t) with Eq. S9 to S11.The green lines named calculated “by‐pass mixer” are from the correlated E(t) and Eq. S8. (a)Original tube ID 0.5 mm, (b) 0.75 mm, and (c) 1.0 mm, labelled with d in the figures.6. Gold nanoparticle (Au‐NP) synthesis experimentThe Au‐NPs were prepared from HAuCl4 and NaBH4 with tetradecyltrimethylammoniumbromide (TTAB) as ligands.10 The reaction was implemented in the platform shown in Fig. S9.During the reaction, one aqueous solution containing 0.5 mmol/L HAuCl4 and 10.2 mmol/LTTAB was used as one reactant solution, and a 1.5 mmol/L NaBH4 aqueous solution was usedas the second reactant solution. These solutions were blended through a T‐connector, thenflowed into the screw‐tube mixer as shown in Fig. S9(a) with identical flow rates at 0.4 mL/min.The reaction proceeded in the following PFA tube with a length of 2.4 m and an ID of 1.0 mm.The ID of the T‐connector (Idex Health & Science) was 0.5 mm, and the original IDs of screw‐tube mixers were 0.5 and 0.75 mm, respectively. The reaction was carried out at 25 C and thesolutions were injected by syringe pumps (PHD Ultra 2000, Harvard Apparatus). A controlgroup experiment without mixer was also implemented as shown in Fig. S9(b). All chemicalsused for this experiment were purchased from Sigma‐Aldrich.
Fig. S9Schematics of Au‐NPs synthesis experimental platform.In this system, NaBH4 can also react with H2O as a competitive side reaction; therefore, themolar ratio between NaBH4 and HAlCl4 was higher than the stoichiometric ratio. The NaBH4solution was used freshly after preparation. The yields of Au‐NPs were characterized UV‐Visspectroscopy (Shimadzu 3101PC).11 The particle sizes are determined from the TEM (JEOL2010) images with at least 300 particle lon Industrial/zh CN/tech info/techinfo compare.html.2.S. J. Park, J. K. Kim, J. Park, S. Chung, C. Chung and J. K. Chang, J. Micromech. Microeng., 2004, 14, 6‐14.3.S. Schwolow, J. Hollmann, B. Schenkel and T. Röder, Org. Process Res. Dev., 2012, 16, 1513‐1522.4.G. G. Chen, G. S. Luo, S. W. Li, J. H. Xu and J. D. Wang, Aiche J., 2005, 51, 2923‐2929.5.W. Ehrfeld, K. Golbig, V. Hessel, H. Lowe and T. Richter, Ind. Eng. Chem. Res., 1999, 38, 1075‐1082.6.M. C. Fournier, L. Falk and J. Villermaux, Chem. Eng. Sci., 1996, 51, 5187‐5192.7.A. Koelbl, M. Kraut and K. Schubert, Aiche J., 2008, 54, 639‐645.8.M. C. Fournier, L. Falk and J. Villermaux, Chem. Eng. Sci., 1996, 51, 5053‐5064.9.O. Levenspiel, Chemical Reaction Engineering 3rd ed, John Wiley & Sons, New York, 1999.10.V. Sebastian Cabeza, S. Kuhn, A. A. Kulkarni and K. F. Jensen, Langmuir, 2012, 28, 7007‐7013.11.X. Ji, X. Song, J. Li, Y. Bai, W. Yang and X. Peng, J. Am. Chem. Soc., 2007, 129, 13939‐13948.
Thermoforming Tfor connectors( C) PFA 306 ‐ 260 FEP 260 200 240 ETFE (Tefzel ) 267 ‐ 160 7KLV . 3.CFD (computational fluid dynamics) simulations The working mechanism of the screw‐tube mixer is to force the fluids rotate along the axial direction of the tube, which is similar to the stirrers in vessels. .