Transcription
FY 2021/22 – FY 2025/26SHORT RANGETRANSIT PLANApproved June 9, 2021
TABLE OF CONTENTSEXECUTIVE SUMMARY . 11.0 SYSTEM OVERVIEW . 31.1 Riverside County Service Area . 31.2 Riverside County Demographics and Travel Characteristics . 31.3 Description of RCTC Transit Services and Programs . 51.4 Key RCTC Partners . 61.5 RCTC Transit Facilities . 81.6 Previous Studies and Plans . 132.0 WESTERN COUNTY VANPOOL PROGRAM . 162.1 Vanpool Service Profile . 162.2 Vanpool Existing Performance . 192.3 Vanpool Service Enhancements . 202.4 Vanpool Projected Ridership Growth . 212.5 Vanpool Potential Fare Changes . 222.6 Vanpool Proposed Incentive Program . 232.7 Vanpool Capital Investments . 243.0 COACHELLA VALLEY AND WESTERN COUNTY RAIL PROGRAMS . 253.1 Coachella Valley Rail . 253.1.1Coachella Valley – San Gorgonio Pass Rail Corridor Project . 253.2 Western County Rail - Metrolink . 293.2.1Metrolink Service Profile . 293.2.2Metrolink Fare Structure . 333.2.3Metrolink Revenue Fleet . 363.2.4Metrolink Rider Profile. 363.2.5Metrolink Existing Performance . 373.2.6Metrolink Key Performance Indicator . 403.2.7Metrolink Productivity Improvement Efforts . 413.2.8Metrolink Recent Service Changes . 413.2.9Metrolink Major Trip Generators . 42i
3.2.10RCTC Proposed Metrolink Service Plan . 423.2.11 Metrolink and RCTC Marketing Plans and Outreach . 453.2.12 Metrolink Projected Ridership Growth . 473.2.13 Metrolink and RCTC Capital Improvement Plans . 473.2.14 Overview of Long-Term Rail Capital Investments . 574.FINANCIAL PLANNING . 584.1 Operating and Capital Budget – FY 2021/22 . 594.2 Funding to Support Future Operating and Capital Plans . 594.3 Regulatory and Compliance Requirements . 604.4 Status of Current Capital Projects . 62List of Figures and TablesFigure 1: Map of Service AreaFigure 2: Map of RCTC-Owned Metrolink Stations in Western Riverside CountyFigure 3: Map of San Jacinto Branch LineFigure 4: Map of Park & RidesFigure 5: Map of Vanpool Origins Destined for Western Riverside CountyFigure 6: Project Vanpool Ridership, FY 2020/21 – 2024/25Figure 7: Metrolink Commuter Rail SystemFigure 8: Map of Metrolink IEOC LineFigure 9: Map of Metrolink Riverside LineFigure 10: Map of Metrolink 91/PVL LineFigure 11: Metrolink Systemwide Annual Ridership, FY 2014/15 – 2019/20Figure 12: Total Ridership Riverside County Metrolink Lines, FY 2014/15 – 2019/20Figure 13: Riverside County Average Weekday Passenger Distribution by LineFigure 14: RCTC Stations Passenger DistributionFigure 15: Riverside County Served Lines On-Time PerformanceFigure 16: FY 2020/21 Operating and Capital Revenue SourcesTable 1.0: Journey to Work by County, SCAG RegionTable 1.1: RCTC Transit Facility FeaturesTable 2.0: Projected No. of Vanpools, FY 2020/21 – 2024/25Table 3.0: Metrolink Rider ProfileTable 3.1: Metrolink Key Performance IndicatorsTable 3.2: Proposed Riverside County Metrolink Service ImprovementsTable 3.3: Long-Term Rail Capital InvestmentsTable 4.0: Summary of Funding Request – FY 2020/21Table 4.0A: Capital Project JustificationsTable 4.1: Summary of Funding Request – FY 2021/22Table 4.2: Summary of Funding Request – FY 2022/23Table 4.3: Summary of Funding Request – FY 2023/24Table 4.4: Summary of Funding Request – FY 2024/25Table 4.5: Projected Total Operating Costs (Vanpool and Commuter Rail), FY 2020/21 – 2024/25Table 4.6: List of Current Capital Projects and Funding Statusii
GLOSSARY OF ACRONYMSAAAlternatives AnalysisBNSFBNSF RailwaysCMAQCongestion Mitigation & Air Quality FundsCTCCounty Transportation CommissionCVAGCoachella Valley Association of GovernmentsETCEmployer Transportation CoordinatorEIR/EISEnvironmental Impact Report/Environmental Impact StatementEPAEnvironmental Protection AgencyFHWAFederal Highway AdministrationFRAFederal Railroad AdministrationFTAFederal Transit AdministrationFYFiscal YearIEOCInland Empire-Orange County LineLAUSLos Angeles Union StationLOSSANLos Angeles – San Diego – San Luis Obispo Rail Corridor AgencyLTFLocal Transportation FundsLRTSLong Range Transportation StudyMetroLos Angeles County Metropolitan Transportation AuthorityMSRCMobile Source Air Pollution Reduction Review CommitteeNTDNational Transit DatabaseOCTAOrange County Transportation AuthorityPTCPositive Train ControlPVLPerris Valley LineRCTCRiverside County Transportation CommissionRTARiverside Transit AgencyRTPARegional Transportation Planning AgencyRTP/SCSRegional Transportation Plan/Sustainable Communities StrategySBSenate BillSBCTASan Bernardino County Transportation AuthoritySCAGSouthern California Association of GovernmentsSCORESouthern California Optimized Rail ExpansionSCRRASouthern California Regional Rail AuthoritySDPService Development PlanSJBLSan Jacinto Branch LineSRState RouteSRTPShort Range Transit PlanSTAState Transit Assistance FundsTVMTicket Vending MachineUPUnion Pacific RailroadVCTCVentura County Transportation Commissioniii
EXECUTIVE SUMMARYThe Riverside County Transportation Commission (“Commission”) was established in 1976 by theState Legislature to oversee the funding and coordination of all public transportation serviceswithin Riverside County (County). The governing body consists of all five members of the CountyBoard of Supervisors, one elected official from each of the County’s 28 cities, and one non-votingmember appointed by the Governor of California.The Commission is one of 26 designated regional transportation planning agencies (RTPA) in theState. It is also one of the County Transportation Commissions (CTC) created under PublicUtilities Code Section 130050. As the RTPA, it is required to set policies, establish priorities, andcoordinate activities among the County’s various transit operators and local jurisdictions. TheCommission approves the allocation of federal, state, and local funds for highway, transit, rail,non-motorized travel (bicycle and pedestrian), and other transportation activities by strategicallyprogramming funds and administering grant programs. The Commission is also legallyresponsible for allocating Transportation Development Act (TDA) funds, the major source offunds for transit in the County. The TDA provides two sources of funding: Local TransportationFund (LTF), derived from a one-quarter of one-cent state sales tax, and State Transit Assistance(STA), derived from the statewide sales tax on diesel fuel.The Short Range Transit Plan (SRTP) focuses on the regional transit programs administered bythe Commission, which includes the vanpool subsidy program known as VanClub and commuterrail service operated by the Southern California Regional Rail Authority (SCRRA) better known asMetrolink, both of which span the Western Riverside County area. The Commission is alsoleading the planning efforts for the proposed Coachella Valley-San Gorgonio Rail Corridor, whichwould extend intercity-rail services from Los Angeles to Palm Springs and Indio.The SRTP serves as the blueprint for the service improvement plan and capital priorities for thenext five years. In order to receive local, state, and federal funds for the first fiscal year (FY) ofthe plan, transit operators in the county submit an updated SRTP annually for the allocation andprogramming of funds. The SRTP is guided by the overall mission set forth by the Commissionand the respective program goals to encourage viable alternative modes of travel. In March2021, the Commission approved four core mission objectives: 1) Quality of Life; 2) OperationalExcellence; 3) Connecting the Economy; and 4) Responsible Partner.These objectives are used to direct policies and priorities for the coming year as well as underlinethe Commission’s leadership role in the region and its commitment as a community partner. Thetransit programs meet these objectives by improving mobility with investments in diverse modessuch as vans and bicycle and pedestrian improvements; protecting transportation resources bymaintaining existing transit infrastructure and using the existing transportation network moreefficiently; promoting coordinated transportation, and mitigating project impacts in thecommunity.1
COVID-19 Impact on Transit ServicesRidership projections for FY 2019/20 were promising with proposed service expansions forcommuter rail and significant gains in new vanpools as it was entering its second year of service.However, the novel coronavirus which causes the disease now known as COVID-19 caused apandemic worldwide. Beginning in mid-March 2020, local and state public health orders includedthe closure of schools, cancellations of gatherings of more than ten, social distancing of at least6 feet, and the Governor’s statewide “stay at home” Executive Order. Although transit serviceswere deemed essential, ridership plummeted immediately after the “stay at home” order wasissued. Metrolink reported ridership declines of about 90% systemwide and the number of activevanpools declined 47%.Ridership levels are being closely monitored and services are reduced leading into FY 2020/21with many uncertainties that remain. Metrolink has reduced services by 30% and will operate atthe reduced service levels in FY 2021/22 until ridership recovery requires service to be reinstated.As a result of the continued travel and commute restrictions resulting from COVID-19, in FY2020/21 VanClub did not regain the routes/ridership achieved before COVID-19. Since July 2020,there have been 30 vanpool routes that have continued during the fiscal year and the programanticipates minor increases in participation before the end of FY 2020/21. The service plans andstrategies for both are described in this five-year plan and should be noted that the focus for thenear-term will implement strategies to maintain and regain riders, including increasing safety andsanitization measures to meet customer needs. The proposed FY 2021/22 plan also providesflexibility to meet market changes when local and state health provisions are lifted. As thepandemic transpires, the service expansions and capital improvements set forth may be delayedas revenue and economic conditions are reassessed.2
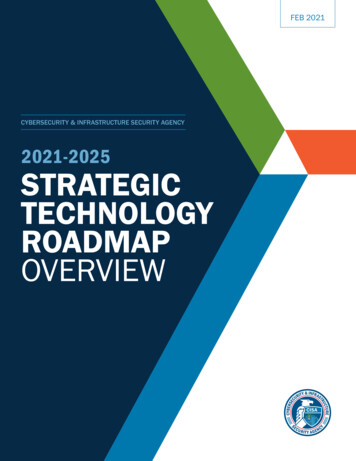
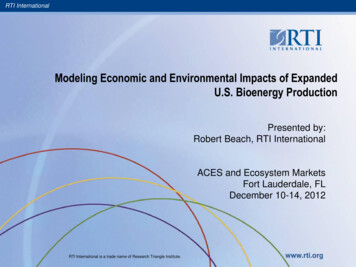
1.0SYSTEM OVERVIEW1.1Riverside County Service AreaRiverside County is the fourth largest county in California with an area of 7,208 square miles,encompassing three subregions: Western, Coachella Valley, and Palo Verde, with a total of 28cities and five county district seats.The Commission’s vanpool and commuter rail services are offered in Western Riverside County.In the Coachella Valley, the Commission is directly involved with leading the planning andenvironmental phase of future rail services. Figure 1 illustrates the Western and Coachella Valleysubregions where these transit programs take place.Figure 1: Map of Service Area1.2Riverside County Demographics and Travel CharacteristicsRiverside County is diverse in geography and demographics. Total population is estimated at 2.4million. In the Commission’s 2019 Long Range Transportation Study (LRTS), existing land use andpopulation characteristics as well as travel market and mobility trends were analyzed. The LRTSsummarized the notable population and employment trends in Riverside County as the following: 50% of households in Riverside County are one and two-person households; 35% ofhouseholds have four or more persons.3
20% of Riverside County’s resident are school age; this proportion holds for all threesubareas. The Coachella and Palo Verde Valleys have a higher proportion of persons and heads ofhousehold over 65 compared to Western Riverside County. Nearly one-third (31%) of households in the county have no worker present. This figureincludes retired households as well as households of unemployed persons and full-timecollege students. The data reflects the great recession and slow recovery during the first halfof the current decade. More than one-third of households are one-worker households. Median income is higher in Western Riverside County compared to the eastern subareas. Countywide, nearly two-thirds of households had incomes of 75,000 or less. Over two-thirds of Riverside County’s dwelling units are single-family. Nearly 70% of jobs in Riverside County paid 35,000 per year or less. Only 13% of jobs in Riverside County paid 75,000 per year or more. Education is the dominant industry in Riverside County, representing a quarter of all Countyjobs. Retail, arts and entertainment, and professional industry sectors all represent over 10% ofjobs. Employment in Riverside County grew from 1.1% from 2010 to 2015, which was significantlyhigher than other counties such as Orange, San Bernardino, and Los Angeles, which sawchanges of -0.2%, 0.1%, and -1.3%, respectively, during the same period.Commuter Travel Characteristics by ModeThe Commission’s transit programs will continue to play significant roles in advancing mobility inthe county by offering travel options that can compete with the convenience of an automobile.Analyzing mode share data provides insight into the travel modes with the greatest growthpotential and provides perspective on how the County compares to neighboring counties.For example, according to the Southern California Association of Governments (SCAG) 2016Regional Transportation Plan/Sustainable Communities Strategy (RTP/SCS) which analyzed theU.S. Census’s Journey to Work data (peak congestion periods) from the 2009-11 AmericanCommunity Survey 3-Year Estimates, 1.5% of commute trips occurred by public transportation inRiverside County. In comparison, the state share is 5.2% and the national share is 5%. AlthoughRiverside County is below the state and national averages, most other counties in the SCAGregion were also below the averages. Moreover, Orange County’s transit share may only be 2.9%but OCTA still ranks amount the 50 largest providers of public transportation nationally.Carpooling in Riverside County on the other hand is about 13% of the peak commute trips, whichis one of the highest in the SCAG region. Table 1.0 below presents the Journey to Work data bycounty. Although the transit share is modest, the carpool share is the second highest means of4
travel behind driving alone, signaling the potential that regional vanpool programs have in theregion.Table 1.0: Journey to Work by County, SCAG RegionMeans of Transportation ntyImperialCountyLA CountyOrangeCountyCar, Truck, or Van90.2%83.0%88.2%90.0%91.0%89.1%Drove 0.8%10.0%13.0%16.7%13.2%In 2-Person Carpool7.9%8.4%7.7%9.6%13.2%9.7%In 3-Person Carpool1.7%1.5%1.3%1.9%2.0%1.7%In 4-Or-More Person Carpool1.8%1.0%0.9%1.5%1.5%1.8%Workers Per Car, Truck, or Van1.081.081.071.091.111.09Public axicab, Motorcycle, or OtherMeans1.3%1.2%1.0%1.4%1.0%1.0%Worked at Home4.5%4.9%5.0%5.1%3.7%5.5%Source: SCAG 2016 RTP/SCS, U.S. Census 2009-11 American Community Survey 3-Year Estimates1.3Description of RCTC Transit Services and ProgramsRCTC administers and subsidizes two Western Riverside County transit programs: Vanpool – Better known as VanClub, is an incentive program where eligible vanpoolersreceive a subsidy toward the cost of a vanpool lease.Commuter Rail – Better known as Metrolink, that is operated by the Southern CaliforniaRegional Rail Authority (SCRRA), which the Commission is a member agency. Thisprogram also includes the operations and maintenance of the nine Metrolink stations andcapital delivery of rehabilitation and expansion projects.In the Coachella Valley, RCTC is leading the planning and environmental phases of the CoachellaValley – San Gorgonio Pass Corridor Service Project.Details of each program, including service profiles, existing service and route performance, andfuture service and capital planning efforts for each are found in Chapters 2 and 3 of this report.5
1.4Key RCTC PartnersPlanning, programming, and delivery of transportation projects is achieved in conjunction and inpartnership with dozens of other agencies at the federal, state, regional, subregional, and locallevels. This section provides a summary of key partner agencies and their responsibilities withwhich RCTC collaborates.Federal Agency PartnersKey federal partners include U.S. Department of Transportation and its two principal surfacetransportation agencies, the Federal Transit Administration (FTA) and the Federal HighwayAdministration (FHWA). Other federal agencies include the Federal Railroad Administration(FRA), and Amtrak, which operates interstate passenger rail services with support from Caltrans.State Agency PartnersThe California State Transportation Agency (CalSTA) is a cabinet-level agency focused onaddressing all of the state’s transportation issues. Of its nine major divisions two have substantialintersection with RCTC’s operations. The California Department of Transportation (Caltrans) asthe steward and operator of the state highway system, is involved in the implementation of RCTCled projects on state highways and is a major funding partner for transit services and projectsthroughout the County. The California Transportation Commission (CTC) programs various stateand federal funding on transportation projects, including state highways, rail, transit, and activetransportation. The California Air Resources Board (CARB) sets air quality standards and incoordination with the U.S. Environmental Protection Agency (EPA) determines conformitybetween transportation and air quality plans; CARB also funds projects and programs that resultin emissions reductions.Regional Agency PartnersAs a CTC, RCTC represents the Riverside County subregion and assists SCAG in carrying out itsfunctions as the Metropolitan Planning Organization (MPO). SCAG, in coordination with RCTC,performs studies and develops consensus relative to regional growth forecasts, regionaltransportation plans, and mobile source components of the air quality plans maintained by theSouth Coast Air Quality Management District. RCTC also is responsible for submitting projects toSCAG for inclusion in the RTP. Per federal and state regulations, all projects programmed withfederal and state funds, including locally funded regionally significant projects, are required tobe included in the RTP. SCAG as the MPO is responsible for conducting analysis to enable CARBand the EPA to determine air quality conformity with adopted air plans for the six counties in theSCAG region (Imperial, Los Angeles, Orange, Riverside, San Bernardino, and Ventura counties).The SCRRA or Metrolink, is a joint powers authority consisting of five member agencies: LosAngeles Metropolitan Transportation Authority (Metro), Orange County TransportationAuthority (OCTA), Riverside County Transportation Commission (RCTC), San Bernardino CountyTransportation Authority (SBCTA), and Ventura County Transportation Commission (VCTC)).Metrolink is the premier commuter rail system in Southern California connecting communitieson a 536 route-mile network.6
RCTC is also a voting member of the Los Angeles – San Diego – San Luis Obispo (LOSSAN) RailCorridor Joint Powers Authority (JPA). The LOSSAN Rail Corridor is a 351-mile corridor betweenSan Diego and San Luis Obispo and is the second busiest intercity passenger rail corridor in thenation supporting commuter, intercity, and freight rail services. LOSSAN is a forum for thetransportation and regional agencies along the corridor to collaborate on ways to increaseridership, revenue, capacity, reliability, and safety on the LOSSAN Rail Corridor. LOSSAN does notpay for the operation of any of the passenger rail services within the corridor but is a means tohelp coordinate operations and planning.County-Level PartnersRCTC works closely with peer county-level transportation agencies in Southern California,including: Imperial Valley Association of Governments (IVAG) Los Angeles Metropolitan Transportation Authority (LA Metro) Orange County Transportation Authority (OCTA) San Bernardino County Transportation Authority (SBCTA) San Diego Association of Governments (SANDAG) Ventura County Transportation Commission (VCTC)These above intercounty partnerships are especially important because of shared borders andtransportation linkages between Riverside County and these counties. Since SANDAG is also aMetropolitan Planning Organization, the relationship with SANDAG may involve SCAG for largerMPO planning purposes.Subregional Agency PartnersRCTC works with two primary subregional agencies. The Western Riverside County Council ofGovernments (WRCOG) promotes transportation solutions in the most populous western portionof the county.In the Coachella Valley, the Coachella Valley Association of Governments (CVAG) is the planningagency coordinating government services in the Coachella Valley. Both subregional agenciespromote solutions to the common issues of the local governments and tribes that are itsmembers.Both agencies administer the Transportation Uniform Mitigation Fee programs that complementand enhance Measure A projects and programs. CVAG, WRCOG, RCTC, and SCAG coordinateefforts to plan, fund, and implement transportation improvement projects.Tribal GovernmentsRCTC consults with tribal governments in the development of projects and planning that havethe potential to impact tribal lands. There are 11 tribal governments within Riverside Countyprimarily located in Southwest, Central, Coachella Valley and Eastern portions of the county.7
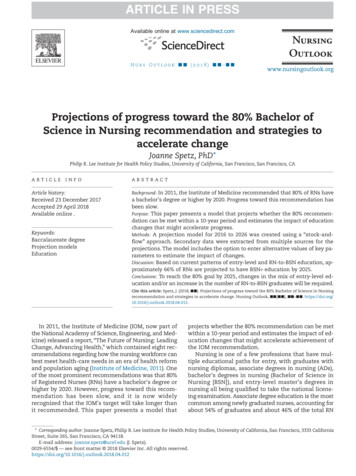
Local Agency PartnersLocal agencies include the County of Riverside and 28 incorporated cities. Other key local partneragencies include the County’s seven transit operators: City of Banning Transit City of Beaumont Transit City of Riverside Special Transportation Services Corona Cruiser Palo Verde Valley Transit Agency Riverside Transit Agency (RTA) SunLine Transit Agency1.5RCTC Transit FacilitiesRCTC-Owned Metrolink StationsThe Commission owns and maintains nine stations in Riverside County out of the 57 Metrolinkstations in southern California. These stations are served by three Metrolink lines, Inland Empire– Orange County (IEOC) Line, Riverside Line, and 91/Perris Valley Line (91/PVL) and are locatedin Western Riverside County, as presented in Figure 2. They are multimodal transit centers withregional and local bus connections and offer customer amenities such as canopies, benches,electronic signage, and bicycle storage units for active transportation users. The stations alsoserve as designated park & rides to encourage rideshare.Figure 2: Map of RCTC-Owned Metrolink Stations in Western Riverside County8
The Commission also operates the Riverside Downtown Operations Control Center (RDNOCC)which is located on the west end of the Riverside Downtown station and provides monitoring ofclosed-circuit televisions (CCTV) at the stations as well as facilities for train crews.Over the last 27 years, the Commission has invested more than 145 million in capitalimprovements to develop stations and secure access to support commuter rail services. The PVLand related projects added over 250 million more to the Commission’s investment in commuterrail. Station operations and maintenance costs are part of the rail program budget and includesproperty management, utilities, grounds maintenance, repairs, cleaning, and security services.An overview of the features at each facility is provided in Table 1.1.Table 1.1: RCTC Transit Facility FeaturesLocationRiversideDowntown4066 VineStreet,RiversideJurupa ValleyPedleyTransit ServicesRail: 91/PVL Line,IEOC Line,Riverside Line,AmtrakBus: RTA, AmtrakOmniTrans,MegaBus2 platforms with 4 boarding tracks4 parking lots (1,240 spaces)Enclosed pedestrian bridge,elevators, stairwellsRail: Riverside LineBus: RTAPlatform with boarding trackParking lot (288 spaces)6001 PedleyRoad, JurupaValleyRiverside-LaSierra10901-A & BIndianaAvenue,RiversidePrimary FeaturesSize: 26.5 acresIn Service Date: June 1993Size: 4.5 acresIn Service Date: June 1993Rail: 91/PVL,IEOC LineBus: RTAPlatform with 2 boarding tracksParking lot (1,065 spaces)Enclosed pedestrian bridge,elevators, stairwellsSize: 9.35 acresIn Service Date: October 19959
Corona-West155 SouthAuto CenterDrive, CoronaRail: 91/PVLIEOC LineBus: RTAPlatform with 2 boarding tracksParking lot (564 spaces)Enclosed pedestrian bridge,elevators, stairwellsSize: 5.49 acresIn Service Date: October 1995Corona-NorthMain250 EastBlaine Street,CoronaRail: 91/PVL,IEOC LineBus: RTA,Corona CruiserPlatform with 2 boarding tracksParking lot (579 spaces)Parking structure (1,000 spaces)Enclosed pedestrian bridge,elevators, stairwellsSize: 6.72 acresIn Service Date: November 2002PerrisDowntownRail: 91/PVLBus: RTASize: 5.5 acresIn Service Date: June 2016 (bustransit center opened 2010)121 South CStreet, PerrisRiversideHunterPark/UCRRail: 91/PVLBus: RTAPlatform with boarding trackParking lot (528 spaces)Size: 9.35 acresIn Service Date: June rchFieldPlatform with boarding trackParking lot (444 spaces)Rail: 91/PVLBus: RTAAmtrak4160 MeridianParkway,RiversidePlatform with boarding trackParking lot (476 spaces)StairwellSize: 14.47 acresIn Service Date: June 201610
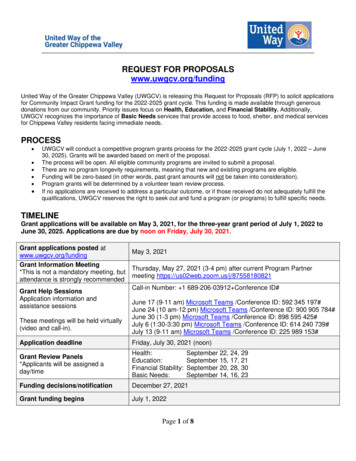
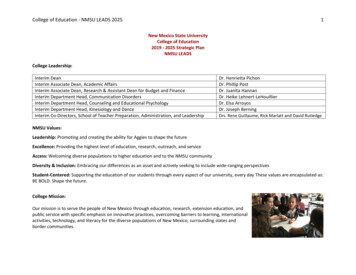
Perris-South1304 CaseRoad, PerrisRail: 91/PVLBus: RTAAmtrakPlatform with boarding trackParking lot (907 spaces)Size: 40.57 acresIn Service Date: June 2016N/ACCTV operations centerOffices and meeting roomsSize: 3,000 square feetIn Service Date: April 2016RDNOCC4344 Vine Street, RiversideRCTC-Owned San Jacinto Branch LineIn 1993, the Commission purchased the former Santa Fe Railroad’s San Jacinto Branch Line (SBJL)and several adjacent properties as part of the regional acquisition of BNSF Railway (BNSF)properties and use rights for a total of 26 million using Western County Rail Measure A and staterail bonds (Proposition 108 of 1990). Under this agreement, BNSF retained exclusive freightoperating rights, serving its customers along the line and maintaining the right-of-way until suchtime as passenger service is implemented.Figure 3 is the SJBL corridor that extends 38.3 miles between Highgrove and San Jacinto withinRiverside County. The alignment roughly follows Interstate 215 to Perris where it veers east,parallel to State Route (SR) 74 to Hemet and San Jacinto.11
Figure 3: Map of San Jacinto Branch LineRCTC Leased Park & Ride LocationsPark & ride facilities are a critical piece of a well-balanced transportation network. By providingparking spaces for commuters to support carpool/vanpool arrangements and transitconnections, park & rides help improve mobility and the efficiency of transportationinvestments. RCTC leases excess parking spaces from property owners, typically churches andretail locations, to help expand park & ride capacity in the Western Riverside County. The lease,a three-party agreement between the property owner, Caltrans, and RCTC allows flexibility inmeeting the dynamic needs of commuters. The Commission supplements the park & ridenetwork in Western Riverside County with an incremental 942 spaces across 12 lease locations.Figure 4 is a map of all of the park & ride facilities in western county.12
Figure 4: Map of Park & Ride Facilities, Western Riverside County1.6Previous Studies and PlansPrevious studies and plans conducted by the Commission have been used as the building blocksfor setting goals and priorities for transit projects and programs. The following is a list of t
RTA Riverside Transit Agency . as revenue and economic conditions are reassessed. 3 1.0 SYSTEM OVERVIEW 1.1 Riverside County Service Area Riverside County is the fourth largest county in California with an area of 7,208 square miles, encompassing three subregions: Western,