Transcription
ICRISAT is headquartered in Patancherunear Hyderabad, Andhra Pradesh, India,with two regional hubs and five countryoffices in sub-Saharan Africa. It is amember of the CGIAR Consortium. CGIARis a global research partnership for a foodsecure future.ICRISAT-Patancheru(Headquarters)Patancheru 502 324Andhra Pradesh, IndiaTel 91 40 30713071Fax 91 40 30713074icrisat@cgiar.orgICRISAT-Bamako(Regional hub WCA)BP 320Bamako, MaliTel 223 20 709200Fax 223 20 onal hub ESA)PO Box 39063, Nairobi,KenyaTel 254 20 7224550Fax 254 20 7224001icrisat-nairobi@cgiar.orgICRISAT-Liaison OfficeCG Centers BlockNASC ComplexDev Prakash Shastri MargNew Delhi 110 012, IndiaTel 91 11 32472306 to 08Fax 91 11 25841294ICRISAT-BulawayoMatopos Research StationPO Box 776Bulawayo, ZimbabweTel 263 383 311 to 15Fax 263 383 307icrisatzw@cgiar.orgICRISAT-Maputoc/o IIAM, Av. das FPLM No 2698Caixa Postal 1906Maputo, MozambiqueTel 258 21 461657Fax 258 21 461581icrisatmoz@panintra.comICRISAT- KanoPMB 3491Sabo Bakin Zuwo Road,Tarauni, Kano, NigeriaTel: 234 7034889836; 234 8054320384 234 8033556795icrisat-kano@cgiar.orgICRISAT-NiameyBP 12404, NiameyNiger (Via Paris)Tel 227 20722529,20722725Fax 227 e AgriculturalResearch StationPO Box 1096Lilongwe, MalawiTel 265 1 707297, 071, 067, 057Fax 265 1 707298icrisat-malawi@cgiar.org(Prepared under the HOPE project)www.icrisat.orgAbout ICRISATICRISAT is a memberof the CGIAR ConsortiumScience with a human faceThe International Crops Research Institutefor the Semi-Arid Tropics (ICRISAT) isa non-profit, non-political organizationthat conducts agricultural research fordevelopment in Asia and sub-SaharanAfrica with a wide array of partnersthroughout the world. Covering 6.5 millionsquare kilometers of land in 55 countries,the semi-arid tropics have over 2 billionpeople, of whom 644 million are thepoorest of the poor. ICRISAT innovationshelp the dryland poor move from povertyto prosperity by harnessing markets whilemanaging risks – a strategy called InclusiveMarket-Oriented Development (IMOD).Training Manual onValue Chain Analysis of DrylandAgricultural CommoditiesA Amarender ReddyScience with a human face237-2012
Citation: Reddy Amarender A. 2013. Training Manual on Value Chain Analysis of Dryland AgriculturalCommodities. Patancheru 502 324, Andhra Pradesh, India: International Crops Research Institute for theSemi-Arid Tropics (ICRISAT). 88 pp.
Training Manual onValue Chain Analysis of DrylandAgricultural Commodities(Prepared under the HOPE project)A Amarender ReddyPatancheru 502 324, Andhra Pradesh, India2013
AcknowledgmentsThe training manual is targeted at all stakeholders who are involved in alleviation of poverty amongsmallholder farmers in the semi-arid tropics who cultivate their lands under marginal environments. Itprovides the key concepts to understand the changing dynamics of value chains and case studies in thefast changing market scenario. The consumption pattern of most of the urban consumers is changingtowards high-value commodities, ready-to-cook products; they can afford to buy value-added productseven though at higher prices. However, the majority of the rural population is still price conscious; theyprefer to buy un-processed grains at the cheapest price. Hence, value chain analysis should also lookinto cost cutting innovations along the value chain to benefit price conscious poor consumers besidesfocusing on value added products. Under the changing utilization patterns, there is a growing demandfor feed and fodder as the demand for livestock products is increasing. Additionally, the non-traditionalsources of demand such as brewery, starch and bio-fuel industry are other growth sectors that need tobe met by innovative arrangements like bulk marketing of grain. For this training material, the conceptsof value chains have been taken freely from various published sources with due acknowledgment. Wehave also included value chain case studies of sorghum, pearl millet, cotton and jatropha, which aremajor dryland crops, to give further insights to the readers. The training material also includes the recentconcept ‘Producer companies’ evolved in India, to provide recent developments in innovative institutions.We are thankful to Praduman Kumar for allowing us to reproduce the paper on value chains on biofuels.The training material also includes a brief note on the ‘Producer Companies’, an emerging innovativeinstitution for the primary producers in the country. We are also thankful to P Birthal from National Centrefor Agricultural Economics and Policy Research (NCAP/New Delhi), GP Reddy from National Academy forAgricultural research and management (NAARM/Hyderabad) and Ch Radhika Rani from National Instituteof Rural Development (NIRD/Hyderabad) for their comments and suggestions to improve this manual.A Amarender Reddyii
ContentsAcknowledgments.iiChapter 1. Objectives of the Manual.1Semi-Arid Tropics. 1Participation of smallholder farmers in value chain of dryland crops . 1Need for integration of smallholder farmers into value chain . 2Chapter 2. Theoretical and Conceptual Framework of Value Chains.4Value chain definition. 4Value chain maps . 5Value coalitions . 6How producers, contracting firms will benefit from efficient value chains. 6Transaction costs. 7Producers. 8Improving access to markets. 8Agro-industries engaged in value chains. 9Meeting the niche of growing urban high value food demand. 10Major constraints to sorghum and millet utilization . 10Value added products from sorghum and pearl millet. 11Strategy for value-added products . 11Value chain stakeholders. 12Quality control. 12Drivers of change (adopted from Rural Industries Research andDevelopment Corporation, 2001). 12Methods of integration. 14Types of contracts (adopted from Aye LechTiruwha Melese 2010). 14Steps in value chain diagnosis. 15Upgrading in value chain. 16Examples of indicators of innovation and upgrading: practice and performance. 22Action points for value chain development in a cluster of villages (at local level). 23Chapter 3. Mainstreaming Gender in Value Chain.24Value chain and gender. 24Gendered nature of value chains. 24Advantages and disadvantages of addressing gender in value chains. 25Gender-sensitive approach to value chain. 26Chapter 4. Economic Appraisal of Value Chains with Case Studies.34Basic objectives. 34Analysis of external sources of competitiveness. 34iii
Case Study-I. Cotton value chain.36Case Study-II. Bulk marketing: Sorghum for Poultry Feed.41Establishing market linkages. 42Advantages of bulk marketing. 44Case Study-III. Pearl millet value chain in western India.45Grain markets. 45Human consumption . 49Demand from cattle/poultry feed industry. 49Poultry feed industry in Haryana. 51Breweries units. 51Starch industries. 51Grain market arrivals and price trends . 52Value chains in pearl millet stover. 54Conclusion. 56Case Study-IV. Primary Producers Companies – Emerging Innovative Institutions.57Salient provisions of Companies Act relating to producer companies. 57Incorporation. 58Salient features. 58Management. 59Members’ benefit. 59Reserves. 59Dispute resolution. 59Inter-state cooperative societies. 59Key learnings and observations through some cases. 60Policy implications. 61Case Study-V. Jatropha-based Biodiesel Value Chain in India.62Introduction. 62Methodology. 63Farm production of jatropha seeds. 63Addressing the constraints. 71Conclusions. 72Chapter 5. Profitability Indicators for Agro-based Value Chain Companies.73Profitability ratios. 74Chapter 6. Conclusions and Summary.79References.82iv
List of FiguresFigure 1.Supply chain and Value chain (adapted from Cox et al. 2002)4Figure 2.Value chain map and actors5Figure 3.A Typical Value Coalition Model6Figure 4.Alternative interventions to increase income from coarse cereal cultivation7Figure 5.Typical Cereal Value Chain – Wheat, Milling and Baking17Figure 6.Main elements of competitiveness35Figure 7.Production costs of men’s cotton T-shirts in Bangladesh38Figure 8.Value addition in the textile chain from cotton38Figure 9.Flow chart of traditional marketing chain for sorghum grain in India41Figure 10.Innovation in supply chain42Figure 11.FFA – Federation of Farmers Association, APPF – Andhra Pradesh PoultryFederation. A coalition approach for promoting sorghum for poultry feed43Figure 12a. Value chain of pearl millet45Figure 12b. Schematic diagram of value chain of pearl millet grain in Western India46Figure 13.64A typical jatropha-based biodiesel value chain: Schematic representationList of TablesTable 1.Average size and fragmentation of agricultural holding during (1995-2005)2Table 2.Share (%) of different uses of pearl millet grain in 2011 and 202013Table 3.Drivers of change13Table 4.Value chains: old and new methods15Table 5.Steps involved in value chain diagnosis (Oversees Development Institute, 2009)16Table 6.Analyzing how farmers are connected to final markets(adopted from Kaplinsky and Morris 2001)20Table 7.Clusters vs. value chains20Table 8.Type of upgrading and practice and performance (Kaplinsky and Morris 2001)21Table 9.Estimation of transaction costs22Table 11. Benchmarking of the textile industry of a typical developing country39Table 12. Margins of different stakeholders in value chain of pearl millet in 2009-1047Table 13. Ranking of attributes of pearl millet grain by consumers in Rajasthan (%)49Table 14. Production and marketing costs of cattle feed concentrate50Table 15. Local medium-scale cattle feed manufacturing plant (cost of raw material)50Table 16. Cost-benefit analysis of alcohol production with pearl millet51v
Table 17. Pattern of end-use of pearl millet grain production by seed source52Table 18. Grain quality traits and price differentials53Table 19. Market margin and turnover of sample traders53Table 20. Crop growing seasons and fodder availability54Table 21. Grade (quality) of green fodder and price differentials55Table 22. Market price of different fodder55Table 23. Cooperative and Producer Company – Key Variances58Table 24. Different models of jatropha cultivation at farm level65Table 25. Details of jatropha cultivation at farm level in selected states65Table 26. Input application pattern during initial period of establishment ofjatropha in surveyed plots.66Table 27. Economic analysis of jatropha cultivation in selected states67Table 28. Financial measures for assessing the feasibility of investment in jatropha cultivation68Table 29. Various agencies involved in jatropha seed marketing68Table 30. Cost of production of biodiesel in Rajasthan and Chhattisgarh- A comparative study70Table 31. Profitability indicators of firms in value chain73Table 32. Profitability indicators of companies in food value chain in India73List of BoxesBox 1: Benefits of value chain analysis (Mitchell et al. 2009b)18Box 2. Framework for gender analysis27Box 3. Questions to be addressed in the preliminary mapping27Box 4. Questions for analyzing the overall cultural setting27Box 5. Check list of questions under each level and each focus area (Terrillon 2011) - Macro level 28Box 6. Check list of questions under each level and each focus area (Terrillon 2011) - Meso level29Box 7. Check list of questions under each level and each focus area (Terrillon 2011) - Micro level31vi
Chapter1Objectives of the ManualSemi-Arid TropicsPoverty, food insecurity, rapid population growth and environmental degradation are problemsseriously hounding the developing world today. These are most felt in the semi-arid tropics (SAT), hometo one-sixth of the world’s population. The SAT, which includes 48 developing countries in Asia andAfrica, is characterized by extreme poverty, lingering drought, infertile soils, growing desertificationand environmental degradation. Our geographic focus is on the semi-arid tropics of Africa and Asia,referred to for brevity in the rest of the Plan as ‘the tropical drylands’ or simply ‘the drylands’. About6.5 million square kilometers in over 55 countries is classified as dryland tropics. More than 2 billionpeople currently live in the drylands, with 600 million considered to be poor. Hence, strengtheningvalue chains in SAT regions will help in reducing poverty through upgrading along the value chain shiftsfrom inefficient to efficient value added products (ICRISAT strategic plan 2020). Mostly, dryland cropsare grown in the semi-arid tropics, which include coarse cereals (such as sorghum, pearl millet andfinger millet) and legumes (such as soybean, groundnuts, chickpea, pigeonpea and other pulse crops).The other main source of income is from livestock products such as meat and milk products. Keepingin mind the diverse product base of the SAT areas, this manual illustrates value chains for differentproducts commonly produced in this region.Participation of smallholder farmers in value chain of dryland cropsSmall agricultural holdings constitute a vast majority of farms in many developing countries. Thestudies based on World Programme of Census of Agriculture (WCA) 2000 indicate that the Asia andPacific region has the smallest size of holdings in the world. Against an average overall size of 5.5hectare (ha) for 114 FAO member countries for which the data was made available to FAO, the averagesize of holding in Asia is only about 1 hectare. Interestingly, the average size of holding estimatedin the Bangladesh agricultural survey of 2005 comes to only 0.3 hectare. In the Pacific Islands, theaverage size of the holding, excluding Australia and New Zealand, ranges from 0.6 ha in Cook Islandsto about 3.6 ha in Samoa. Yet another feature of agricultural holdings in Asia is that these are oftenfragmented. Although there does not exist a commonly accepted definition of smallholder farmers, insome countries (or regions) of Asia the percentage of small holdings (below 2 ha) could be up to 90%of the total holdings in the country. The share of area operated by smallholders in the total agriculturalarea of the country varies from one country to another. But in most Asian countries, the total landcultivated by smallholders represents a sizable portion of agricultural land in the country. A study of14 countries in Asia indicated that 57.9% agricultural holdings were below 1 ha and these accountedfor 14.2% of the operated area. If we extend the limit to 2 ha, over 85% holdings accounting for nearly31% agricultural land gets covered. In five Pacific countries, American Samoa, Cook Island, Guam,Marina Island (north) and Samoa, 36.3% holdings of 1 ha and below manage only 5.4% of total area.Holdings below 2 hectare account for 63.7% of total holdings and operate only 18.3% of land. In India,over 80% of holdings are under 2 ha and they account for nearly 40% of the area. Further, owing tofragmentation and sub-division, the operational holding size is likely to decrease further in future.The reduced operational holdings implies that the smallholder farmers should enhance their incomefrom the small holdings both through increased farm productivity and also increased value from farmoutput to meet the growing cash needs (Table 1).1
Table 1. Average size and fragmentation of agricultural holding during (1995-2005).Countries by continent(Number of reporting countriesis given in parenthesis)World total (114)Average areaper holding(hectare)Averagenumber of parcelsper holding5.53.511.53.0117.81.2America, South (8)74.41.2Europe (29)12.45.91.03.2Africa (25)America, North & Central (14)Asia (29)Source: APCAS (2010)With the enhanced efficiency of value chains, farmers will benefit from better prices, higher andquality yield and assured markets, services and input supplies. If possible, it is important to see thatthe smallholder farmers are able to participate and move up in the value-chains, given the high returnsat the higher end of the value chain for many agricultural produce. In the recent past there has beena growing demand for agricultural produce for non-traditional uses like poultry feed, cattle feed,breweries and other non-food uses. And more recently, some big retail chains are selling ready-tocook products like dry flour, local cuisines, bread, confectionary products, and bakery products fromdryland crops such as millets and maize at premium prices through their retail network. The manualalso illustrates how smallholder farmers can benefit from the huge demand for these value-addedproducts through transforming from subsistence farming to market oriented farming?Need for integration of smallholder farmers into value chainDue to income growth, urbanization and change in tastes and preferences, the demand for value-addedcommodities like ready-to-cook food items and agricultural commodities are growing fast. It is wellknown that smallholders have more easily available labor than capital, and value addition requires morelabor. This, coupled with the rising demand for value-added food commodities, offers an opportunityfor smallholders to intensify production of value-added agricultural commodities. Moreover, theirproduction efficiency is higher compared to larger landholders. But there are apprehensions thatsmallholders may lose on the marketing front. Analysis of value chains for high value commodities arepresently popular and some of the issues are to what extent smallholder farmers are benefiting fromthe growing demand for high value crops and what are the different institutional innovations evolvingto link smallholder farmers to end-users along the chain. High value food commodities require coldstorages, special packaging, branding and bulk marketing, and their local markets are thin. Marketablesurplus of individual producers is too small to be traded remuneratively in distant markets due to lack ofaccess to market information, transport network and cold storage facilities. The prices of value-addedfood commodities are volatile, and fall drastically even with small increases in their normal marketarrival (Birthal et al. 2007). Even though farmers forge links with big retail chains in order to accessmarkets, there are some difficulties in sustaining these linkages. Many unsustainable interventions(often by external actors), which are insufficiently linked to markets, have existed in the past. This hasbeen due to the non-existence of the enabling environment in which value chains operate. The ruralpoor engage with value chains at a number of different nodes of the chain, as workers, consumers andalso as producers. There is a possibility that all of them will benefit from different value chains.There are many studies (Birthal et al. 2008, Birthal et al. 2005, Delgado et al. 1999) on agricultural valuechains in India addressing fruits and vegetables, dairy products and other high value crops, but there is2
no literature available on the smallholder farmer’s participation in value chains of dryland crops withjust a few exceptions (Dykes and Rooney 2006, Reddy and Bantilan 2012, Shiferaw et al. 2006) eventhough good scope exists for their value addition and marketing through streamlining value chains.Keeping this gap in literature in mind, this training manual pulls together existing theoretical andempirical literature on value chains and addresses the issue of smallholder farmers’ participation invalue chains for dryland crops in the semi-arid tropics. Specifically, while providing a conceptual clarityand framework for analysis of value chains, the manual aims to (i) understand different concepts ofvalue chain (ii) understand different methods of assessment of value chains (iii) assess the effects ofdifferent types of value chain on production costs, transaction costs and farm profitability (iv) studypolicy implications for evolving institutional structures that strengthen the vertical linkages betweenthe smallholders and food-retailers and (v) examine relevant case studies of value chains. Further, themanual would seek to understand the smallholder farmer’s participation in the value chain with focuson (i) How the smallholder farmers can participate in the high-end of the value chain of dryland crops?(ii) How the smallholder farmers can increase their share in consumer’s price? (iii) How the smallholderfarmers can participate in fast growing demand segments such as feed sector, brewery industry,bakery products, and ready-to-cook food items? and (iv) How the policy environment can ensure thatsmallholders exploit these opportunities to their advantage? The training material is prepared forthose working in the area of agricultural marketing and promoting value chains particularly for thepoor in the semi-arid tropics. The generic principals of value chain and its analysis are drawn from theliterature. Successful value chains, particularly for crops grown in the semi-arid tropics, namely (i) bulkmarketing of sorghum grain, (ii) pearl millet grain and fodder value chains, (iii) commodity producercompanies to market branded food products and (iv) value chain from Jatropha bio-fuel are taken asexamples for explaining different aspects of value chains.3
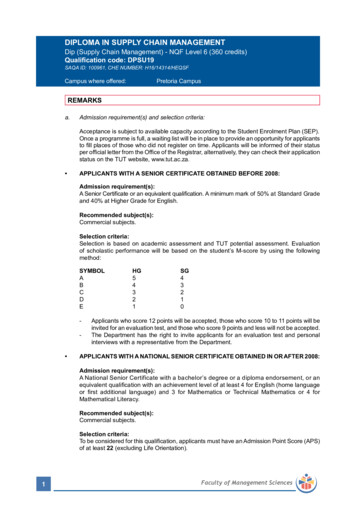
Chapter2Theoretical and Conceptual Framework of Value ChainsValue chain definitionA ‘value chain’ describes the full range of activities required to bring a product or service from conception,through the different phases of production (involving a combination of physical transformation and theinput of various producer services), delivery to final consumers and final disposal after use (Kaplinskyand Morris 2000 p4). There’s a temptation to use “value chain” and “supply chain” interchangeably,but there is a difference in the concepts that is significant. The supply chain model – which camefirst – focuses on activities that get raw materials and subassemblies into a manufacturing operationsmoothly and economically. The value-chain notion has a different focus and a larger scope. A supplychain is simply a transfer of a commodity from one stakeholder to another in a chained manner. Thevalue chain is the value addition at different stages of transfer. In different stages of value chain,different stakeholders add value to the product to increase the end product value. In other words,a value-chain analysis looks at every step from raw materials to the eventual end-user – right downto disposing of the packaging after use. The goal is to deliver maximum value to the end user for theleast possible total cost. That makes supply-chain management a subset of the value-chain analysis(Figure 1). Researchers from various disciplines work in the field of value chain analysis. Hence, manymethods for value chain analysis have evolved in recent years with different perspectives. They can beclassified into two groups: The first group consists of methods with a more descriptive and qualitativeemphasis and the second group refer to specialized tools with an analytical focus. The objective of thismanual is to put together different concepts so that different stakeholders may understand value chainholistically.Value chains play an important role in transforming agricultural commodities from raw material to endproducts demanded by the consumers. There are a number of stakeholders involved in the agriculturalcommodity value chains and the partitioning of gains among the stakeholders along the chain is oftenThe supply chain:The stages that transform a rawmaterial into a finished productor service and delivers it to theultimate customerRawMaterialsEndCustomersThe Value Chain:Allocation of price paid byconsumers and primaryproducersFigure 1. Supply chain and Value chain (adapted from Cox et al. 2002).4
debated and analyzed. There is however, little understanding about the various concepts used in valuechain analysis specifically addre
Figure 1. Supply chain and Value chain (adapted from Cox et al. 2002) 4 Figure 2. Value chain map and actors 5 Figure 3. A Typical Value Coalition Model 6 Figure 4. Alternative interventions to increase income from coarse cereal cultivation 7 Figure 5. Typical Cereal Value Chain - Wheat, Milling and Baking 17 Figure 6.