Transcription
COVID-19 Weekly ReportOregon’s Weekly Surveillance SummaryNovel Coronavirus (COVID-19)Weekly Data Report - December 29, 2021Table of ContentsBackground . 3Weekly Report Summary . 4Clinical Characteristics and risk factors . 5Epidemiologic links . 5Figure 1. Epidemiologic link of recent COVID-19 cases by week of onset . 6Figure 2. Epidemiologic link of all COVID-19 cases by week of onset . 7Figure 3. Recent sporadic COVID-19 cases by race and week of onset . 8Figure 4. All sporadic COVID-19 cases by race and week of onset . 9Figure 5. Recent sporadic COVID-19 cases by ethnicity and week of onset . 10Figure 6. All sporadic COVID-19 cases by ethnicity and week of onset . 11Clinical symptoms and reported risk factors . 11Figure 7. Reported signs and symptoms for all COVID-19 cases . 12Figure 8. Reported symptoms among all COVID-19 cases by week of onset . 13Figure 9. Reported risk factors among all COVID-19 cases . 14Demographics . 14Geography . 15Figure 10. Case rates per 100,000 population, by county . 15Sex . 16Table 1. Severity and rates of COVID-19 by sex. 16Figure 11. Recent COVID-19 cases by sex and week of onset . 17Figure 12. All COVID-19 cases by sex and week of onset . 18Age . 19Table 2. Severity and rates of COVID-19 by age . 19Figure 13. Recent COVID-19 cases by age and week of onset . 20Figure 14. All COVID-19 cases (counts) by age and week of onset. 21OHA 2395 (12/29/21)Data are provisional and subject to change.1
COVID-19 Weekly ReportOregon’s Weekly Surveillance SummaryNovel Coronavirus (COVID-19)Figure 15. All COVID-19 cases (case rate per 100,000) by age and week of onset. 22Race . 23Table 3. Severity and rates of COVID-19 by race . 23Figure 16. Recent COVID-19 cases by race and week of onset . 24Figure 17. All COVID-19 cases (counts) by race and week of onset. 25Figure 18. All COVID-19 cases (case rates per 100,000) by race and week of onset. 26Ethnicity . 27Table 4. Severity and rates of COVID-19 by ethnicity . 27Figure 19. Recent COVID-19 cases by ethnicity and week of onset . 28Figure 20. All COVID-19 cases (counts) by ethnicity and week of onset . 29Figure 21. All COVID-19 cases (case rates per 100,000) by ethnicity and week ofonset . 30Age-adjustment. 31Table 5. Ratio of age-adjusted rates for cases, hospitalizations, and deaths by race. 31Table 6. Ratio of age-adjusted rates for cases, hospitalizations, and deaths byethnicity . 32Follow-up. 32Figure 22. Follow up attempted within 24 hours, % by race . 33Figure 23. Follow up attempted within 24 hours, % by ethnicity . 34Figure 24. Cases interviewed, by race . 35Figure 25. Cases interviewed, by ethnicity . 36People with Intellectual and Developmental Disabilities . 37Weekly COVID-19 Hospitalizations (HOSCAP) . 37ZIP code . 37OHA 2395 (12/29/21)Data are provisional and subject to change.2
COVID-19 Weekly ReportOregon’s Weekly Surveillance SummaryNovel Coronavirus (COVID-19)BackgroundCOVID-19 Weekly Report data will be finalized every Sunday at 11 p.m. PST, and thereport will be published on Wednesday. Please note that the data reported here arecontinually being updated. For daily up-to-date information, visit the OHA COVID-19web page: https://govstatus.egov.com/OR-OHA-COVID-19.As of 11 p.m. Sunday, December 26, there have been 414,138 cases of COVID-19reported to the Oregon Health Authority. Of these, 14,910 (3.6%) are “presumptive”cases—i.e., people with COVID-19-like symptoms and close contact with a confirmedcase, but who did not have a confirmatory laboratory test. Though not confirmed,presumptive cases are highly likely to have COVID-19, given their specific symptomsand known exposure. Presumptive cases are encouraged to seek testing to confirm thatthey do have COVID-19. Presumptive cases who test positive are recategorized asconfirmed cases.These data represent a snapshot of COVID-19 risk factors and clinical anddemographic characteristics of cases, and they include data on cases with pendinginvestigations. Not all cases have been interviewed at the time of this report. The datashown in this report come from Oregon’s electronic disease surveillance system forreportable diseases.During the week of December 19–December 251 136,789 tests for COVID-19 wereperformed on Oregonians; of these, 7.4% had a positive result.2 This figure represents a“test-based” method, whereby all electronic lab reports received by OHA are used tocalculate percent positivity.3 Detailed tables of the number of tests and percent positivitycan be found online .1This date range aligns with CDC’s “MMWR week.”2Does not include antibody (serology) rces/calculating-percent-positivity.htmlOHA 2395 (12/29/21)Data are provisional and subject to change.3
COVID-19 Weekly ReportOregon’s Weekly Surveillance SummaryNovel Coronavirus (COVID-19)Weekly Report SummaryDuring Monday, December 21, through Sunday, December 27, 2021, OHA recorded6,987 new cases of COVID-19 infection—a 25% jump over the previous week’s total.Reported test results fell 7.1%, but the proportion that were positive jumped from 4.8%to 7.4%. Newly reported cases declined 25% from last week to this week amongchildren 10 years old, while cases among those 20–79 years of age rose—in particularamong 20–29 -year-olds (90% increase) and 30–39 -year-olds (41% increase).One hundred eighty-five COVID-19-associated hospitalizations were reported thisweek—down 35% from last week’s 286 and the lowest tally since the week of July 19–25. Eighty-nine COVID-19-associated deaths were reported, down from 114 last week.Of the 414,138 cases reported in Oregon to date, 21,986 (5.3%) have beenhospitalized, and 5,623 (1.4%) have died.COVID-19-associated hospitalization and death rates increase with age (Table 2).About 4.2% of Oregonians are 80 years of age or older; they have accounted for 12,735(3.1%) of reported cases, but 3,612 (16%) of reported COVID-19-associatedhospitalizations and 2,343 (42%) of reported COVID-19-associated deaths. Persons 70years of age and older make up 12% of Oregon’s population; they have accounted for34,021 (8.2%) of reported cases but 7,906 (36%) of the reported COVID-19-associatedhospitalizations and 3,697 (66%) of the reported COVID-19-associated deaths. At theother end of the age spectrum, persons 20 years of age make up 23% of Oregon’spopulation and have accounted for 78,436 (19%) of the reported cases but only 661(3.0%) of Oregon’s COVID-19 associated hospitalizations and 5 (0.09%) of the COVID19-associated deaths.Through July 4 of this year, persons 80 accounted for 50% of COVID-19-associateddeaths, but since then the figure has been 33%. The age distribution of fatal cases haschanged little since that date. Data on mortality in Oregon, including deaths associatedwith COVID-19, are available r.health.statistics.Additional data are available ata.OHA 2395 (12/29/21)Data are provisional and subject to change.4
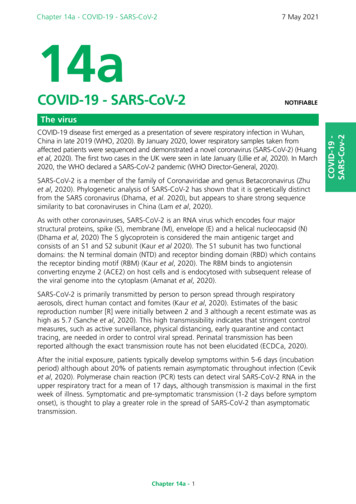
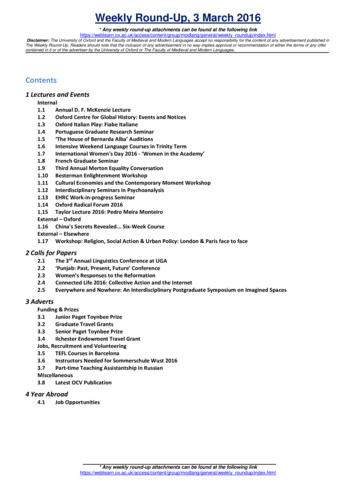
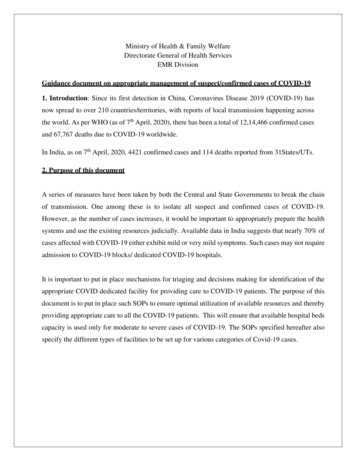
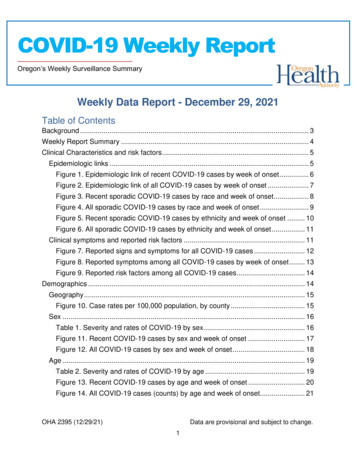
COVID-19 Weekly ReportOregon’s Weekly Surveillance SummaryNovel Coronavirus (COVID-19)Clinical Characteristics and risk factorsThis section of the report describes the epidemiology of Oregon’s COVID-19 cases,including indicators of COVID-19 transmission, common symptoms experienced byCOVID-19 cases, and demographic breakdowns for sex, age, race, and ethnicity.Indicators of disease severity, specifically hospitalizations and deaths, are included inthe tables.Epidemiologic linksThe figures below show the epidemiologic link of COVID-19 cases. Public healthclassifies all cases as part of a household, part of an outbreak, part of a cluster, a closecontact of another case, or sporadic. Sporadic indicates that a case was not linked to aknown source of COVID-19. Lower numbers of sporadic cases suggest lowercommunity spread of COVID-19. Figure 1 focuses on recent cases of COVID-19, andallows for the easy comparison of different types of epidemiologic link. Figure 2 includesall COVID-19 cases, showing the pattern of epidemiologic links since the first caseswere identified in Oregon. Figures 3 and 4 show sporadic cases by race, and figures 5and 6 show sporadic cases by ethnicity. Looking at the data by race and ethnicity helpspublic health to identify disparities.Epidemiologic link designations: Sporadic:4 Cases who do not have known exposure to another case or outbreak. Outbreak: Cases who have a shared, defined exposure with at least one othercase. For example, a defined exposure could be an event, a workplace, acongregate facility, etc. Cluster: Cases who had contact with another case, but the exposure is not welldefined. For example, cases from two households who interacted many timesprior to illness onset. Household: Cases who were exposed to another case in their household.4Due to the lag between case reporting and case investigation, the proportion of casescategorized as sporadic is high in the most recent week or more; some of these caseswill be recategorized after investigation is completed.OHA 2395 (12/29/21)Data are provisional and subject to change.5
COVID-19 Weekly ReportOregon’s Weekly Surveillance SummaryNovel Coronavirus (COVID-19) Close contact: Cases who were exposed to another case, not in their household.This designation was added on 7/15/2020.Figure 1. Epidemiologic link of recent COVID-19 cases by week of onsetOHA 2395 (12/29/21)Data are provisional and subject to change.6
COVID-19 Weekly ReportOregon’s Weekly Surveillance SummaryNovel Coronavirus (COVID-19)Figure 2. Epidemiologic link of all COVID-19 cases by week of onsetOHA 2395 (12/29/21)Data are provisional and subject to change.7
COVID-19 Weekly ReportOregon’s Weekly Surveillance SummaryNovel Coronavirus (COVID-19)Figure 3. Recent sporadic COVID-19 cases by race and week of onsetOHA 2395 (12/29/21)Data are provisional and subject to change.8
COVID-19 Weekly ReportOregon’s Weekly Surveillance SummaryNovel Coronavirus (COVID-19)Figure 4. All sporadic COVID-19 cases by race and week of onsetOHA 2395 (12/29/21)Data are provisional and subject to change.9
COVID-19 Weekly ReportOregon’s Weekly Surveillance SummaryNovel Coronavirus (COVID-19)Figure 5. Recent sporadic COVID-19 cases by ethnicity and week of onsetOHA 2395 (12/29/21)Data are provisional and subject to change.10
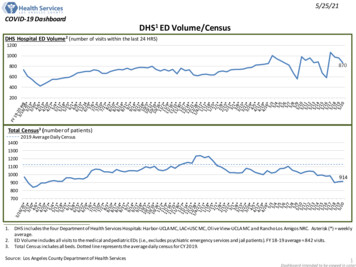
COVID-19 Weekly ReportOregon’s Weekly Surveillance SummaryNovel Coronavirus (COVID-19)Figure 6. All sporadic COVID-19 cases by ethnicity and week of onsetClinical symptoms and reported risk factorsFigure 7 provides information on signs and symptoms from all COVID-19 cases. Of414,138 cases, 213,155 (51.5%) reported having signs and symptoms of COVID-19.The most commonly reported symptoms are cough (n 117,148, 28.3%) and headache(n 92,887, 22.4%). Figure 8 provides information on the percentage of COVID-19 casesthat report symptoms over time. Figure 9 provides information on risk factors from allCOVID-19 cases. The most common risk factors are having contact with a knownCOVID-19 case prior to symptom onset (n 163,399, 39.5%) and having underlyingmedical conditions (n 260,181, 62.8%). Note that a person may report more than onesign/symptom or risk factor. Where displayed by week in this report, case data arecategorized by week of reported symptom onset, not by date of case report. This resultsin reduced numbers in the most recent week or more due to reporting lags.OHA 2395 (12/29/21)Data are provisional and subject to change.11
COVID-19 Weekly ReportOregon’s Weekly Surveillance SummaryNovel Coronavirus (COVID-19)Figure 7. Reported signs and symptoms for all COVID-19 casesOHA 2395 (12/29/21)Data are provisional and subject to change.12
COVID-19 Weekly ReportOregon’s Weekly Surveillance SummaryNovel Coronavirus (COVID-19)Figure 8. Reported symptoms among all COVID-19 cases by week of onsetOHA 2395 (12/29/21)Data are provisional and subject to change.13
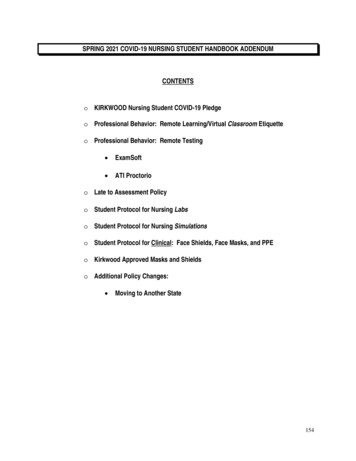
COVID-19 Weekly ReportOregon’s Weekly Surveillance SummaryNovel Coronavirus (COVID-19)Figure 9. Reported risk factors among all COVID-19 casesRisk factor definitions: Congregate living situations include, but are not limited to, long-term carefacilities, group homes, prisons, and shelters. Data include people with confirmedcases who live or work in congregate living situations. Direct patient care is only asked if a case is a healthcare worker or volunteer.The denominator is the number of healthcare workers or volunteers. Underlying medical conditions include cardiovascular disease, chronic liverdisease, chronic lung disease, chronic renal disease, current or former smoker,diabetes mellitus, immunocompromised condition, neurologic andneurodevelopmental conditions, obesity, or other chronic diseases.DemographicsThe following tables and figures show the demographic characteristics for all COVID-19cases. The tables show case counts, case rates, and indicators of severity by sex, age,OHA 2395 (12/29/21)Data are provisional and subject to change.14
COVID-19 Weekly ReportOregon’s Weekly Surveillance SummaryNovel Coronavirus (COVID-19)race and ethnicity. The figures show cases over time, by week of onset, for sex, age,race, and ethnicity. Figure 10 displays case rates by county, in comparison to the caserate for all of Oregon.GeographyThe following figure shows case rates by county for the most recently completedMMWR week, which is currently December 19 to December 25, 2021. Cases aredisplayed using the date that the case became known to public health.Figure 10. Case rates per 100,000 population, by countyOHA 2395 (12/29/21)Data are provisional and subject to change.15
COVID-19 Weekly ReportOregon’s Weekly Surveillance SummaryNovel Coronavirus (COVID-19)1.Counties that had case rates above the case rate for the state are displayed inorange. Counties that had case rates below the case rate for the state aredisplayed in blue.2.Counties that had zero cases in the time period displayed appear on the list, butdo not have a bar to display.SexTable 1. Severity and rates of COVID-19 by sexCases% of totalcasesCases per100,000Hospitalized% l1.9,703.2Rates are calculated using population estimates from the 2020 AnnualPopulation Report from Portland State University’s College of Urban & PublicAffairs Population Research Center and 2019 housing and demographic datafrom the U.S. Census Bureau’s American Community Survey (ACS).OHA 2395 (12/29/21)Data are provisional and subject to change.16
COVID-19 Weekly ReportOregon’s Weekly Surveillance SummaryNovel Coronavirus (COVID-19)Figure 11. Recent COVID-19 cases by sex and week of onsetOHA 2395 (12/29/21)Data are provisional and subject to change.17
COVID-19 Weekly ReportOregon’s Weekly Surveillance SummaryNovel Coronavirus (COVID-19)Figure 12. All COVID-19 cases by sex and week of onsetOHA 2395 (12/29/21)Data are provisional and subject to change.18
COVID-19 Weekly ReportOregon’s Weekly Surveillance SummaryNovel Coronavirus (COVID-19)AgeTable 2. Severity and rates of COVID-19 by ageAgegroupCases% of totalcasesCases per100,000Hospitalized% 20.21,3546.480 3.2Rates are calculated using population estimates from the 2020 AnnualPopulation Report from Portland State University’s College of Urban & PublicAffairs Population Research Center and 2019 housing and demographic datafrom the U.S. Census Bureau’s American Community Survey (ACS).OHA 2395 (12/29/21)Data are provisional and subject to change.19
COVID-19 Weekly ReportOregon’s Weekly Surveillance SummaryNovel Coronavirus (COVID-19)Figure 13. Recent COVID-19 cases by age and week of onsetOHA 2395 (12/29/21)Data are provisional and subject to change.20
COVID-19 Weekly ReportOregon’s Weekly Surveillance SummaryNovel Coronavirus (COVID-19)Figure 14. All COVID-19 cases (counts) by age and week of onsetOHA 2395 (12/29/21)Data are provisional and subject to change.21
COVID-19 Weekly ReportOregon’s Weekly Surveillance SummaryNovel Coronavirus (COVID-19)Figure 15. All COVID-19 cases (case rate per 100,000) by age and week of onsetOHA 2395 (12/29/21)Data are provisional and subject to change.22
COVID-19 Weekly ReportOregon’s Weekly Surveillance SummaryNovel Coronavirus (COVID-19)RaceTable 3. Severity and rates of COVID-19 by raceCases% of totalcasesCases per100,000Hospitalized% HospitalizedDeathsCasefatality 1 t 703.221,9865.35,6231.4RacePacific Islander1.During the case investigation, people are asked to self-report their race, ethnicity,tribal affiliation, country of origin, or ancestry.2.Rates are calculated using population estimates from the 2020 AnnualPopulation Report from Portland State University’s College of Urban & PublicAffairs Population Research Center and 2019 housing and demographic datafrom the U.S. Census Bureau’s American Community Survey (ACS).3.Persons for which race information was not available were not included in theseestimates. The number of persons with race data unavailable can be found inTable 3.4.44,862 (78.1%) of the 57,431 persons who identify as “Other” race also selfidentify as Hispanic or Latino.OHA 2395 (12/29/21)Data are provisional and subject to change.23
COVID-19 Weekly ReportOregon’s Weekly Surveillance SummaryNovel Coronavirus (COVID-19)Figure 16. Recent COVID-19 cases by race and week of onsetOHA 2395 (12/29/21)Data are provisional and subject to change.24
COVID-19 Weekly ReportOregon’s Weekly Surveillance SummaryNovel Coronavirus (COVID-19)Figure 17. All COVID-19 cases (counts) by race and week of onsetOHA 2395 (12/29/21)Data are provisional and subject to change.25
COVID-19 Weekly ReportOregon’s Weekly Surveillance SummaryNovel Coronavirus (COVID-19)Figure 18. All COVID-19 cases (case rates per 100,000) by race and week of onsetOHA 2395 (12/29/21)Data are provisional and subject to change.26
COVID-19 Weekly ReportOregon’s Weekly Surveillance SummaryNovel Coronavirus (COVID-19)EthnicityTable 4. Severity and rates of COVID-19 by ethnicityEthnicityCases% of totalcasesCases per100,000Hospitalized% HospitalizedDeathsCasefatality 5,6231.41.9,703.2Rates are calculated using population estimates from the 2020 AnnualPopulation Report from Portland State University’s College of Urban & PublicAffairs Population Research Center and 2019 housing and demographic datafrom the U.S. Census Bureau’s American Community Survey (ACS).OHA 2395 (12/29/21)Data are provisional and subject to change.27
COVID-19 Weekly ReportOregon’s Weekly Surveillance SummaryNovel Coronavirus (COVID-19)Figure 19. Recent COVID-19 cases by ethnicity and week of onsetOHA 2395 (12/29/21)Data are provisional and subject to change.28
COVID-19 Weekly ReportOregon’s Weekly Surveillance SummaryNovel Coronavirus (COVID-19)Figure 20. All COVID-19 cases (counts) by ethnicity and week of onsetOHA 2395 (12/29/21)Data are provisional and subject to change.29
COVID-19 Weekly ReportOregon’s Weekly Surveillance SummaryNovel Coronavirus (COVID-19)Figure 21. All COVID-19 cases (case rates per 100,000) by ethnicity and week ofonsetOHA 2395 (12/29/21)Data are provisional and subject to change.30
COVID-19 Weekly ReportOregon’s Weekly Surveillance SummaryNovel Coronavirus (COVID-19)Age-adjustmentTables 5 and 6 show the ratio of age-adjusted rates of COVID-19 for cases,hospitalizations, and deaths by race and ethnicity. Each table compares the rates ofcases, hospitalizations, and deaths between each group and a reference group andaccounts for differences in population distributions in each group.Table 5. Ratio of age-adjusted rates for cases, hospitalizations, and deaths byraceAge-adjusted rate ratios of cases, hospitalizations, and deaths, compared to whitepersons.RaceCasesHospitalizationsDeaths 1 sian0.80.90.9Black1.73.02.2Pacific Islander2.15.34.8White1.01.01.01.During the case investigation, people are asked to self-report their race, ethnicity,tribal affiliation, country of origin, or ancestry.2.U.S. Census Bureau; American Community Survey, 2019 American CommunitySurvey 5-Year Estimates.3.Persons for which race information was not available were not included in theseestimates. The number of persons with race data unavailable can be found inTable 3.OHA 2395 (12/29/21)Data are provisional and subject to change.31
COVID-19 Weekly ReportOregon’s Weekly Surveillance SummaryNovel Coronavirus (COVID-19)Table 6. Ratio of age-adjusted rates for cases, hospitalizations, and deaths byethnicityAge-adjusted rate ratios of cases, hospitalizations, and deaths, compared to spanic1.92.42.1Non-Hispanic1.01.01.01.During the case investigation, people are asked to self-report their race, ethnicity,tribal affiliation, country of origin, or ancestry.2.U.S. Census Bureau; American Community Survey, 2019 American CommunitySurvey 5-Year Estimates.3.Persons for which ethnicity information was not available were not included inthese estimates. The number of persons with ethnicity data unavailable can befound in Table 4.Follow-upFigure 22 shows the percentage of cases that were called within 24 hours of beingreported to public health by race. Figure 23 shows the percentage of cases that werecalled within 24 hours of being reported to public health by ethnicity. Figure 24 showsthe percentage of cases that were interviewed, by race. Figure 25 shows thepercentage of cases that were interviewed, by ethnicity. Race and ethnicity data arecollected when cases are interviewed. Race and ethnicity data for cases that were notinterviewed are abstracted from laboratory reports and medical records if it is available.The orange line in figures 22 and 23 represents the state metric for timely follow up forall cases: 95%.OHA 2395 (12/29/21)Data are provisional and subject to change.32
COVID-19 Weekly ReportOregon’s Weekly Surveillance SummaryNovel Coronavirus (COVID-19)Figure 22. Follow up attempted within 24 hours, % by raceOHA 2395 (12/29/21)Data are provisional and subject to change.33
COVID-19 Weekly ReportOregon’s Weekly Surveillance SummaryNovel Coronavirus (COVID-19)Figure 23. Follow up attempted within 24 hours, % by ethnicityOHA 2395 (12/29/21)Data are provisional and subject to change.34
COVID-19 Weekly ReportOregon’s Weekly Surveillance SummaryNovel Coronavirus (COVID-19)Figure 24. Cases interviewed, by raceOHA 2395 (12/29/21)Data are provisional and subject to change.35
COVID-19 Weekly ReportOregon’s Weekly Surveillance SummaryNovel Coronavirus (COVID-19)Figure 25. Cases interviewed, by ethnicityOHA 2395 (12/29/21)Data are provisional and subject to change.36
COVID-19 Weekly ReportOregon’s Weekly Surveillance SummaryNovel Coronavirus (COVID-19)People with Intellectual and Developmental DisabilitiesAs of September 26, 2021 OHA is aware of 1,407 people with intellectual ordevelopmental disabilities who have had COVID-19 to date. This includes individualswho live in congregate settings and in family or individual homes. To date, there are 41deaths among people with intellectual or developmental disabilities. This number is fromconducting a match between the ODHS Office of Developmental Disabilities Servicesclient list and the Oregon COVID-19 case database. OHA will update this number on aquarterly basis.Additional information about the ODDS program and COVID-19 can be found VID-19Report.pdf.ODDS data is based on self-reports from providers and case management entities andtherefore may differ from testing data received from the Oregon Health Authority.Weekly COVID-19 Hospitalizations (HOSCAP)OHA is publishing data on the number of COVID-19 hospitalizations by hospital in theprior week; data are from HOSCAP. Maps and tables containing the 7-day average ofhospitalizations by region and hospital are available online lCapacity/HospitalizationbyFacility.Information on Oregon’s current hospital bed capacity by region is available online lCapacity/BedAvailabilitybyRegion.ZIP codeOHA is publishing data on cases at the ZIP code level, available online at:OHA 2395 (12/29/21)Data are provisional and subject to change.37
COVID-19 Weekly ReportOregon’s Weekly Surveillance SummaryNovel Coronavirus lish yes.Summary table of all zip codes available ?publish yes.Document accessibility: For individuals with disabilities or individuals who speak alanguage other than English, OHA can provide information in alternate formats such astranslations, large print, or braille. Contact the Health Information Center at 1-971-6732411, 711 TTY or COVID19.LanguageAccess@dhsoha.state.or.us.OHA 2395 (12/29/21)Data are provisional and subject to change.38
Dec 29, 2021 · among 20–29 -year-olds (90% increase) and 30–39 -year-olds (41% increase). One hundred eighty-five COVID-19-associated hospitalizations were reported this week—down 35% from last week’s 286 and the lowest tally since the week of July 19– 25. Eighty-nine COVID-19-associated deaths