Transcription
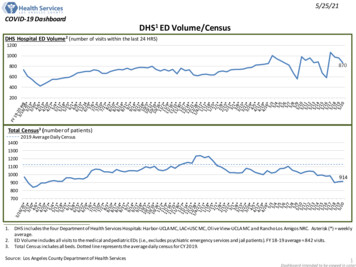
5/25/21COVID-19 DashboardDHS1 ED Volume/CensusDHS Hospital ED Volume 2 ( number of visits within the last 24 HRS)12001000870800600400200Total Census3 (number of patients)2019 Average Daily Census140013001200110010009009148007001. DHS includes the four Department of Health Services Hospitals: Harbor-UCLA MC, LAC USC MC, Olive View-UCLA MC and Rancho Los Amigos NRC. Asterisk (*) weeklyaverage.2. ED Volume includes all visits to the medical and pediatric EDs (i.e., excludes psychiatric emergency services and jail patients). FY 18-19 average 842 visits.3. Total Census includes all beds. Dotted line represents the average daily census for CY 2019.Source: Los Angeles County Department of Health Services1Dashboard intended to be viewed in color
5/25/21COVID-19 DashboardAvailable Hospital Beds - LA County1Total Available Beds (staffed, unoccupied)2Non-Specialized Adult BedsPediatrics and Specialized Adult BedsTotal Available Beds250020001500161410007815004093720Available ICU BedsAdult ICU BedsPediatric ICU BedsTotal Available ICU Beds35030025020015010050103653801. LA County represents 70 designated 9‐1‐1 receiving hospitals and is based on hospitals’ daily self-report; percent of hospitals reporting (96%). “Available” beds refer tostaffed, unoccupied beds able to accept a patient; excludes NICU. Asterisk (*) weekly average.2. Non-specialized adult beds includes: general medical/surgical, telemetry, step-down, and adult ICU capacity. Pediatrics and specialized adult beds includes: PediatricICU, pediatrics, OB/GYN, Trauma, Burn and Isolation.Source: Los Angeles County Department of Health Services – Emergency Medical Services Agency; data (including regional data) i s available at COVID-19 Resources andUpdates - Emergency Medical Services Agency (lacounty.gov)2Dashboard intended to be viewed in color
5/25/21Hospital Beds - LA County1COVID-19 DashboardAverage Daily Non-ICU (Med/Surg/SDU/Telemetry) CensusLicensed Non-ICU Beds: 17,000PUI FOR ,7918,5598,0868,4477,1267,6521401,428 1,007 11000005% 4% 4% 3% 3% 3% 3% 3% 3%100 41293 346679 50579 32067 22079 25965 25365 22770 21064 19656-0COVID & PUI Bed Utilization Rate1595664%8213331731102 0001,0059979589681,0311,0141,0164240%104 105110 118115 110 102 112 10343610764583624373693263113058%4851%135598961 53 51 52 44 4014438539 406709533023%16%19812%1748% 44,3444,4854,51440%32%02980%82%83%83%79% 6375% 39 4173%746150 123 136 124113 111856175 149 156 1441281,0039989931,000912134 175168 % 581,000 %25%25%25%857516213010610327%85 82 24%23%9878 70 23%21%50079 86 86 87 78 89 8319%21% 4771 61 19%18%15%82293815%14%14%14%17%18% 45 54%54%48%51%49%Currently Available Staffed Beds110 1251,310114 112 144 1451,3281,334116Non-COVID-19306 344 412 405 450 510 487 521 511 420 382 450 453 466 426 373 7167782561,500 2741,029238190 175 146 135 135 1231,417216 2121951,3331,3502341,3172,000PUI FOR COVID-191,4661,459CONFIRMED COVID-192,5001,3561,335Average Daily ICU Census 2Licensed ICU Beds: 2,5000282 240 240 22927% 173 15620% 20215% 1949%11% ,5749,507438 405 301593 655 633 557 558 62310%10%9% 8%10%10% 10%1,3331,3301 ,069958 920 868 8977% 7% 6% 6% 6% 6% 7% 7% 7%463 396 360193385 379 364 337 333 419 382 359 337 393 385 480356 336 325198501 4421,0681 ,1921 ,1231 ,0619451,4471,439254 252 237 232 213 216 217 176 182 165 171 8631 ,2401 ,067853 788 307820 862 893 8881,0791 ,2141 ,304678 643 541634 942478 466 428 459 466 487 491 534 23011,11310,3974,0002,00000544 541 564644 623 611 620 613 629 76,000COVID & PUI Bed Utilization Rate58110,0008,000Currently Available Staffed Beds8,5925619,610665 627 692 568844 709 70112,000524Non-COVID-195348,533CONFIRMED COVID-1914,00029%22%18%2480214%12%24559391279 25 20 16 10%10%9% 7% 7% 6%3217 17 15 13 13 1321416013311010389 76 73 641. LA County represents 70 designated 9‐1‐1 receiving hospitals and is based on hospitals’ daily self-report.2. Includes adult ICU; excludes PICU and NICU. Data was revised to reflect changes made to the CHA/CDPH data dictionary.Source: Los Angeles County Department of Health Services – Emergency Medical Services Agency; data (including regional data) is available at COVID-19 Resources andUpdates - Emergency Medical Services Agency (lacounty.gov)203Dashboard intended to be viewed in color
5/25/21COVID-19 DashboardSuppliesPPE Distributed through EMS Agency2Personal Protective Equipment (PPE) 1 (days on hand)DHS facilitiesApril 26 – May 23, 2021Total since2/1/20N95029,387,0688 days or lessKN950208,500Y9 to 29 daysSurgi cal/ProcedureMa s ks012,220,650G30 or more daysFa ce Shields andGoggl es0477,246Gl oves05,853,040Gowns08,208,7735,120566,260N95 Masks (Small)GN95 Masks (Regular)GSurgical MasksGRFace Shields and GogglesGIsolation GownsGExam GlovesGPPEDays on HandBlood SupplyGRInventory at 50% or lessYInventory at 75%Bi naxNow COVIDTes t Ki tGNormal Inventory LevelsBa mlanivimab024,795Vents0322Ventilators3 (number available for use)DHSLA County200015001451100050016301.2.3.Calculated and adjusted based on daily utilization rates and trajectories.Distributed to all hospitals/providers participating in the Hospital Preparedness Program and first responders. Beginning Apr il 2021, EMS PPE data will be updated monthly.This is self reported data subject to error. Does not include ventilators in EMS stockpile; currently EMS has 23 ventilators in stock; 170 ventilators were returned to theStrategic National Stockpile on 6/9/20. DHS includes: Harbor-UCLA MC, LAC USC MC, Olive View-UCLA MC, Rancho Los Amigos NRC, MLK OPC and High Desert RHC. LACounty represents 70 designated 9‐1‐1 receiving hospitals; percent of hospitals reporting (96%). Asterisk (*) weekly average .Source: Los Angeles County Department of Health Services4Dashboard intended to be viewed in color
5/25/21COVID-19 DashboardDHS1 Hospitalized Patients by COVID StatusCOVID-Positive Inpatients2 (number of patients)ICU BedsOther BedsTotal COVID-Positive 11Persons Under Investigation (PUI) Inpatients (number of patients)ICU BedsOther BedsTotal PUI Inpatients8070605040302010011. DHS includes the four Department of Health Services Hospitals: Harbor-UCLA MC, LAC USC MC, Olive View-UCLA MC and Rancho Los Amigos NRC. As ofMay 1 st, all patients admitted to DHS facilities are tested for COVID regardless of symptoms.Asterisk (*) weekly average.2. Case counts reflect all patients who are test-positive, regardless of underlying reason for admission.Source: Los Angeles County Department of Health Services5Dashboard intended to be viewed in color
5/25/21COVID-19 DashboardLA County1 Hospitalized Patients by COVID StatusCOVID-Positive Inpatients (number of patients)ICU BedsOther BedsTotal COVID-Positive cent ofHospitals 5*92*91*93*93*93*90*86*93 *94*92*94*94*94*94*95*96*94*95*92*93*93*93*95*94* 90 97 96 93 91 93 94 96 97 96 91 91 97 97 96 89 94 89Reporting:PUI Inpatients (number of patients)ICU BedsOther BedsTotal PUI Inpatients9008007006005004003002001000726481. LA County represents 70 designated 9‐1‐1 receiving hospitals and is based on hospitals’ daily self-report. Asterisk (*) weekly average.Source: Los Angeles County Department of Health Services – Emergency Medical Services Agency6Dashboard intended to be viewed in color
5/25/21COVID-19 DashboardDHS COVID Demographics by Race/Ethnicity1(March 1, 2020 – May 22, 2021)COVID Cases Hospitalized by Race/Ethnicity (% of patients)COVID Cases Hospitalized by Race/Ethnicity & ICU Admission (% of patients)Hospitalized7% 4%American Indian or Alaska Native7%11%4%4%7%6%Black or African AmericanHispanic69%0%AsianBlack or African American2%American Indian or Alaska NativeAsianAdmitted to the %UnknownUnknown0%20%40%60%80%100%Length of Stay for Hospitalized COVID Positive Patients Who Have Been Discharged, by Race/Ethnicity 2 (# of American Indian orAlaska NativeAsianBlack or AfricanAmericanHispanicWhiteOtherUnknown1. All DHS Hospitalized COVID-19 positive patients. DHS hospitals are preparing to report in the future SOGI (Sexual Orientation Gender Identity) data forall inpatients.2. Length of Stay reported in Median.Source: Los Angeles County Department of Health Services7Dashboard intended to be viewed in color
5/25/21COVID-19 DashboardDHS COVID Demographics by Age 1(March 1, 2020 – May 22, 2021)Weekly Admitted COVID Positive Patients, by Age (% of patients)0-17 yrs18-49 yrs50-64 yrs65 yrs70%60%50%40%30%20%10%0%Length of Stay for Hospitalized COVID Positive Patients Who Have Been Discharged, by Age2 (# of 6465 1. All DHS Hospitalized COVID-19 positive patients. DHS hospitals are preparing to report in the future SOGI (Sexual Orientation Gender Identity) data forall inpatients.2. Length of Stay reported in Median.Source: Los Angeles County Department of Health Services8Dashboard intended to be viewed in color
COVID-19 Dashboard Dashboard intended to be viewed in color 5/25/21 LA County1 Hospitalized Patients by COVID Status 1. LA County represents 70 designated 9‐1‐1 receiving hospitals and is based on hospitals’ daily self-report. Asterisk (*) weekly average. Source: Los Angeles County Department o