Transcription
1. R Basics1. 1.1. Installing a Package2. 1.2. Loading a Package3. 1.3. Loading a Delimited Text Data File4. 1.4. Loading Data from an Excel File5. 1.5. Loading Data from SPSS/SAS/Stata Files2. Scatter Plots1. 2.1. Making a Basic Scatter Plot2. 2.2. Grouping Data Points by a Variable Using Shape or Color3. 2.3. Using Different Point Shapes4. 2.4. Mapping a Continuous Variable to Color or Size5. 2.5. Dealing with Overplotting6. 2.6. Adding Fitted Regression Model Lines7. 2.7. Adding Fitted Lines from an Existing Model8. 2.8. Adding Fitted Lines from Multiple Existing Models9. 2.9. Adding Annotations with Model Coefficients10. 2.10. Adding Marginal Rugs to a Scatter Plot11. 2.11. Labeling Points in a Scatter Plot12. 2.12. Creating a Balloon Plot13. 2.13. Making a Scatter Plot Matrix3. Summarized Data Distributions1. 3.1. Making a Basic Histogram2. 3.2. Making Multiple Histograms from Grouped Data3. 3.3. Making a Density Curve4. 3.4. Making Multiple Density Curves from Grouped Data5. 3.5. Making a Frequency Polygon6. 3.6. Making a Basic Box Plot7. 3.7. Adding Notches to a Box Plot8. 3.8. Adding Means to a Box Plot9. 3.9. Making a Violin Plot10. 3.10. Making a Dot Plot11. 3.11. Making Multiple Dot Plots for Grouped Data12. 3.12. Making a Density Plot of Two-Dimensional Data
R Graphics CookbookSecond EditionPractical Recipes for Visualizing DataWinston Chang
R Graphics Cookbookby Winston ChangCopyright 2018 Winston Chang. All rights reserved.Printed in the United States of America.Published by O’Reilly Media, Inc., 1005 Gravenstein Highway North, Sebastopol, CA 95472.O’Reilly books may be purchased for educational, business, or sales promotional use. Onlineeditions are also available for most titles (http://oreilly.com/safari). For more information,contact our corporate/institutional sales department: 800-998-9938 or corporate@oreilly.com.Editor: Marie BeaugureauProduction Editor: Kristen BrownCopyeditor: FILL INProofreader: FILL INIndexer: FILL INInterior Designer: David FutatoCover Designer: Karen MontgomeryIllustrator: Rebecca DemarestApril 2018: Second Edition
Revision History for the Early Release2017-11-09: First releaseSee http://oreilly.com/catalog/errata.csp?isbn 9781491978603 for release details.The O’Reilly logo is a registered trademark of O’Reilly Media, Inc. R Graphics Cookbook, thecover image, and related trade dress are trademarks of O’Reilly Media, Inc.While the publisher and the author have used good faith efforts to ensure that the informationand instructions contained in this work are accurate, the publisher and the author disclaim allresponsibility for errors or omissions, including without limitation responsibility for damagesresulting from the use of or reliance on this work. Use of the information and instructionscontained in this work is at your own risk. If any code samples or other technology this workcontains or describes is subject to open source licenses or the intellectual property rights ofothers, it is your responsibility to ensure that your use thereof complies with such licenses and/orrights.978-1-491-97860-3[LSI]
Chapter 1. R BasicsThis chapter covers the basics: installing and using packages and loading data.If you want to get started quickly, most of the recipes in this book require the ggplot2 andgcookbook packages to be installed on your computer. To do this, run:install.packages(c("ggplot2", "gcookbook"))Then, in each R session, before running the examples in this book, you can load them with:library(ggplot2)library(gcookbook)NoteChapter \@ref(CHAPTER-GGPLOT2) provides an introduction to the ggplot2 graphingpackage, for readers who are not already familiar with its use.Packages in R are collections of functions and/or data that are bundled up for easy distribution,and installing a package will extend the functionality of R on your computer. If an R user createsa package and thinks that it might be useful for others, that user can distribute it through apackage repository. The primary repository for distributing R packages is called CRAN (theComprehensive R Archive Network), but there are others, such as Bioconductor and Omegahat.(1)
1.1 Installing a Package(2)
ProblemYou want to install a package from CRAN.(3)
SolutionUse install.packages() and give it the name of the package you want to install. To install ggplot2,run:install.packages("ggplot2")At this point you may be prompted to select a download mirror. It’s usually best to use the firstchoice, https://cloud.r-project.org/, as it is a cloud-based mirror with endpoints all over theworld.(4)
DiscussionWhen you tell R to install a package, it will automatically install any other packages that the firstpackage depends on.CRAN (the Comprehensive R Archive Network) is a repository of packages for R, and it ismirrored on many servers around the world. It is the default repository system used by R. Thereare other package repositories; Bioconductor, for example, is a repository of packages related toanalyzing genomic data.(5)
1.2 Loading a Package(6)
ProblemYou want to load an installed package.(7)
SolutionUse library() and give it the name of the package you want to install. To load ggplot2, run:library(ggplot2)The package must already be installed on the computer.(8)
DiscussionMost of the recipes in this book require loading a package before running the code, either for thegraphing capabilities (as in the ggplot2 package) or for example data sets (as in the MASS andgcookbook packages).One of R’s quirks is the package/library terminology. Although you use the library() function toload a package, a package is not a library, and some longtime R users will get irate if you call itthat.A library is a directory that contains a set of packages. You might, for example, have a systemwide library as well as a library for each user.(9)
1.3 Loading a Delimited Text Data File(10)
ProblemYou want to load data from a delimited text file.(11)
SolutionThe most common way to read in a file is to use comma-separated values (CSV) data:data - read.csv("datafile.csv")(12)
DiscussionSince data files have many different formats, there are many options for loading them. Forexample, if the data file does not have headers in the first row:data - read.csv("datafile.csv", header FALSE)The resulting data frame will have columns named V1, V2, and so on, and you will probably wantto rename them manually:# Manually assign the header namesnames(data) - c("Column1", "Column2", "Column3")You can set the delimiter with sep. If it is space-delimited, use sepuse \t, as in: " ".If it is tab-delimited,data - read.csv("datafile.csv", sep "\t")By default, strings in the data are treated as factors. Suppose this is your data file, and you read itin using he resulting data frame will store First and Last as factors, though it makes more sense in thiscase to treat them as strings (or character vectors in R terminology). To differentiate this, usestringsAsFactors FALSE. If there are any columns that should be treated as factors, you can thenconvert them individually:data - read.csv("datafile.csv", stringsAsFactors FALSE)# Convert to factordata Sex - factor(data Sex)str(data)# 'data.frame': 3 obs. of 4 variables:# First : chr "Currer" "Dr." ""# Last : chr "Bell" "Seuss" "Student"# Sex : Factor w/ 2 levels "F","M": 1 2 NA# Number: int 2 49 21TODO: Fix text output formattingAlternatively, you could load the file with strings as factors, and then convert individual columnsfrom factors to characters.(13)
See Alsois a convenience wrapper function around read.table(). If you need more control overthe input, see ?read.table.read.csv()(14)
1.4 Loading Data from an Excel File(15)
ProblemYou want to load data from an Excel file.(16)
SolutionThe readxl package has the function read excel() for reading .xls and .xlsx files from Excel. Thiswill read the first sheet of an Excel spreadsheet:# Only need to install onceinstall.packages("readxl")library(readxl)data - read excel("datafile.xlsx", 1)(17)
DiscussionWith read excel(), you can load from other sheets by specifying a number for sheetIndex or aname for sheetName:data - read excel("datafile.xls", sheet 2)data - read excel("datafile.xls", sheet "Revenues")uses the first row of the spreadsheet for column names. If you don’t want to use thatrow for column names, use col names FALSE. The columns will instead be named X1, X2, and soon.read excel()By default, read excel() will infer the type of each column, but if you want to specify the type ofeach column, you can use the col types argument. You can also drop columns if you specify thetype as "blank".# Drop the first column, and specify the types of the next three columnsdata - read excel("datafile.xls", col types c("blank", "text", "date", "numeric"))(18)
See AlsoSee ?read excel for more options controlling the reading of these files.There are other packages for reading Excel files. The gdata package has a function read.xls() forreading in .xls files, and the xlsx package has a function read.xlsx() for reading in .xlsx files.They require external software to be installed on your computer: read.xls() requires Java, andread.xlsx() requires Perl.(19)
1.5 Loading Data from SPSS/SAS/Stata Files(20)
ProblemYou want to load data from a SPSS file, or from other programs like SAS or Stata.(21)
SolutionThe haven package has the function read sav() for reading SPSS files. To load data from anSPSS file:# Only need to install the first timeinstall.packages("haven")library(foreign)data - read sav("datafile.sav")(22)
DiscussionThe haven package also includes functions to read from other formats:read sas():SASread dta(): StataAn alternative to haven is the foreign package. It also supports SPSS and Stata files, but it is notas up-to-date as the functions from haven. For example, it only supports Stata files up to version12, while haven supports up to version 14 (the current version as of this writing).The foreign package does support some other formats, including:read.octave():Octave and MATLABread.systat():SYSTATread.xport(): SAS XPORTread.dta(): Stataread.spss(): SPSS(23)
See AlsoRun ls("package:foreign") for a full list of functions in the foreign package.(24)
Chapter 2. Scatter PlotsScatter plots are used to display the relationship between two continuous variables. In a scatterplot, each observation in a data set is represented by a point. Often, a scatter plot will also have aline showing the predicted values based on some statistical model. This is easy to do with R andggplot2, and can help to make sense of data when the trends aren’t immediately obvious just bylooking at it.With large data sets, it can be problematic to plot every single observation because the pointswill be overplotted, obscuring one another. When this happens, you’ll probably want tosummarize the data before displaying it. We’ll also see how to do that in this chapter.(25)
2.1 Making a Basic Scatter Plot(26)
ProblemYou want to make a scatter plot.(27)
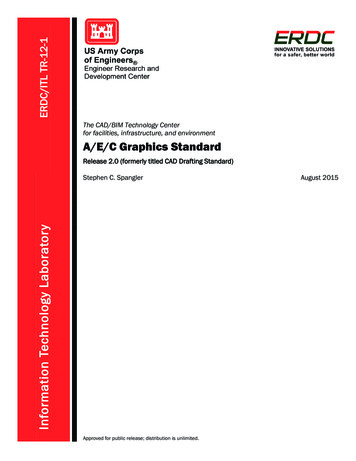
SolutionUse geom point(), and map one variable to x and one to y.In the heightweight data set, there are a number of columns, but we’ll only use two in thisexample (Figure \@ref(fig:FIG-SCATTER-BASIC)):library(gcookbook) # For the data set# List the two columns we'll useheightweight[, c("ageYear", "heightIn")]# ageYear heightIn# 111.9256.3# 212.9262.3# 312.7563.3# 413.4259.0# 515.9262.5# 614.2562.5# 715.4259.0# 811.8356.5# # . with 228 more rowsggplot(heightweight, aes(x ageYear, y heightIn)) geom point()(28)
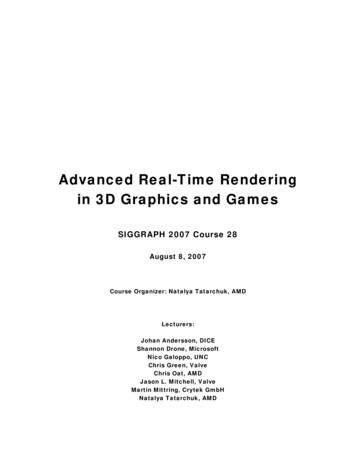
DiscussionTo use different shapes in a scatter plot, set the shape aesthetic. A common alternative to thedefault solid circles (shape #19) is hollow ones (#21), as seen in Figure \@ref(fig:FIGSCATTER-BASIC-SHAPE-SIZE) (left):ggplot(heightweight, aes(x ageYear, y heightIn)) geom point(shape 21)The size of the points can be controlled with the size aesthetic. The default value of size is 2. Thefollowing will set size 1.5, for smaller points (Figure \@ref(fig:FIG-SCATTER-BASICSHAPE-SIZE), right):ggplot(heightweight, aes(x ageYear, y heightIn)) geom point(size 1.5)(29)
2.2 Grouping Data Points by a VariableUsing Shape or Color(30)
ProblemYou want to visually group points by some variable, using shape or color.(31)
SolutionMap the grouping variable to shape or colour. In the heightweight data set, there are manycolumns, but we’ll only use three of them in this example:library(gcookbook) # For the data set# Show the three columns we'll useheightweight[, c("sex", "ageYear", "heightIn")]# sex ageYear heightIn# 1f11.9256.3# 2f12.9262.3# 3f12.7563.3# 4f13.4259.0# 5f15.9262.5# 6f14.2562.5# 7f15.4259.0# 8f11.8356.5# # . with 228 more rowsWe can group points on the variable sex, by mapping sex to one of the aesthetics colour or shape(Figure \@ref(fig:FIG-SCATTER-SHAPE-COLOR)):(32)
DiscussionThe grouping variable must be categorical--in other words, a factor or character vector. If it isstored as a vector of numeric values, it should be converted to a factor before it is used as agrouping variable.It is possible to map a variable to both shape and colour, or, if you have multiple groupingvariables, to map different variables to them. Here, we’ll map sex to shape and colour (Figure\@ref(fig:FIG-SCATTER-SHAPE-COLOR-BOTH), left):ggplot(heightweight, aes(x ageYear, y heightIn, shape sex, colour sex)) geom point()The default shapes and colors may not be very appealing. Other shapes can be used withscale shape manual(), and other colors can be used with scale colour brewer() orscale colour manual().This will set different shapes and colors for the grouping variables (Figure \@ref(fig:FIGSCATTER-SHAPE-COLOR-BOTH), right):ggplot(heightweight, aes
Since data files have many different formats, there are many options for loading them. For example, if the data file does not have headers in the first row: data - read.csv("datafile.csv", header FALSE) The resulting data frame will have columns named V1, V2, and so on, and you will probably want to rename them manually: