Transcription
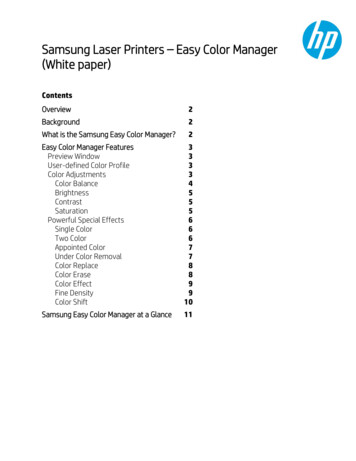
The Biology of Skin ColorLessonStudent Handout!!HUMAN SKIN COLOR: EVIDENCE FOR SELECTIONINTRODUCTIONOur closest primate relatives have pale skin under dark fur, but human skin comes in a variety ofshades from pinkish white to dark brown. How did this variation arise? Many biological traits havebeen shaped by natural selection. To determine whether the variation in human skin color is the resultof evolution by natural selection, scientists look for patterns revealing an association between differentversions of the trait and the environment. Then they look for selective pressures that can explain theassociation.In this lesson, you will explore some of the evidence for selection by analyzing data and watching thefilm The Biology of Skin Color olor), featuringanthropologist Dr. Nina Jablonski. In Part 1 of this lesson, you’ll discover the particular environmentalfactor correlated with the global distribution of skin color variations. In Parts 2 and 3, you’ll come tounderstand the specific selective pressures that have shaped the evolution of the trait. Finally, in Part4, you’ll investigate how modern human migration is causing a mismatch between biology and theenvironment.PROCEDURERead the information in Parts 1–4 below, watching segments of the film as directed. Answer thequestions in each section before proceeding to the next.PART 1: Is There a Connection Between UV Radiation and Skin Color?Watch the film from the beginning to time stamp 5:49 minutes. Pause when Dr. Nina Jablonski asksthe question, “Is there a connection between the intensity of UV radiation and skin color?”In this segment of the film, Dr. Jablonski explains that the sun emits energy over a broad spectrum ofwavelengths. In particular, she mentions visible light that you see and ultraviolet (UV) radiation that youcan’t see or feel. (Wavelengths you feel as heat are in a portion of the spectrum called infrared.) UVradiation has a shorter wavelength and higher energy than visible light. It has both positive andnegative effects on human health, as you will learn in this film. The level of UV radiation reachingEarth’s surface can vary depending on the time of day, the time of year, latitude, altitude, and weatherconditions.The UV Index is a standardized scale that forecasts the intensity of UV radiation at any given time andlocation in the globe; the higher the number, the greater the intensity.Examine Figure 1 and answer Questions 1–6.www.BioInteractive.orgPublished October 2015Page 1 of 10
The Biology of Skin ColorLessonStudent Handout!Figure 1. Ultraviolet Radiation Index Across the World. The colors on this map of the world representUltraviolet (UV) Index values on a particular day in September 2015. The UV Index is a standardized scale of UVradiation intensity running from 0 (least intense) to 18 (most intense). The y-axis values are degrees of latitude,which range from the equator (0 ) to the poles (90 north and 90 south). The x-axis values are degrees oflongitude, which range from the prime meridian (0 ) to the antimeridian (180 east and 180 west). (Source:European Space Agency, TIONSPART 1: Interpreting the Figure1. Describe the relationship between the UV Index (the colored bar in Figure 1) and latitude (y-axis).2. How do you explain the relationship between the UV Index and latitude? (In other words, why doesUV intensity change with latitude?)!www.BioInteractive.orgPage 2 of 10!
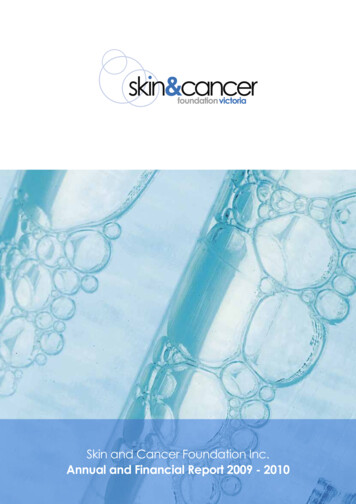
The Biology of Skin ColorLessonStudent Handout!3. Find your approximate location on the map. What is the primary UV Index value of your state onthis particular day in September?4. Look at the regions that receive the most-intense UV (light pink). Site a specific piece of evidencefrom the map that a factor other than latitude was contributing to UV intensity on this day.5. In the film, Dr. Jablonski explains that melanin, located in the top layer of human skin, absorbs UVradiation, protecting cells from the damaging effects of UV. Genetics determines the type ofmelanin (i.e., brown/black eumelanin or red/brown pheomelanin) and the amount of melaninpresent in an individual’s cells.Based on this information, write a hypothesis for where in the world you would expect to findhuman populations with darker or lighter skin pigmentation (i.e., different amounts of melanin).6. Explain how scientists could test this hypothesis.PROCEDUREPART 1 (continued)You will now look at another figure that has to do with skin color. One way to measure skin color is byskin reflectance. Scientists can shine visible light on a portion of skin (typically the inside of the arm)and then measure how much light is reflected back. Dark skin reflects less visible light than does lightskin. The lower the reflectance value, therefore, the darker the skin.Examine Figure 2 and answer Questions 7–9.!www.BioInteractive.orgPage 3 of 10!
LessonStudent HandoutThe Biology of Skin Color!Figure 2. Relationship Between SkinReflectance and Latitude. This figure showshow skin reflectance changes with latitude.Negative latitudes are south of the equator(located at 0 ), and positive latitudes are northof the equator. Available reflectance data frommultiple sources were combined to form thisgraph. All combined data were obtained usinga reflectometer with an output of 680nanometers (i.e., a wavelength of visible light)and placed on the subjects’ upper or lowerinner arms. (Source: Panel B of Figure 2 inBarsh (2003). Graph originally captioned as“Summary of 102 skin reflectance samples formales as a function of latitude, redrawn fromRelethford (1997).” 2003 Public Library ofScience.)QUESTIONSPART 1 (continued)7. Why do you think that reflectance data are collected from a subject’s inner arm?8. Describe the relationship between skin reflectance (y-axis) and latitude (x-axis). Consider both thedirection and steepness of the lines’ slopes.9. Do these data support your hypothesis from Question 5? Justify your answer.!www.BioInteractive.orgPage 4 of 10!
The Biology of Skin ColorLessonStudent Handout!PROCEDUREPART 1 (continued)Watch the film The Biology of Skin Color olor) fromtime stamp 5:49 minutes to 9:08 minutes. Pause when Dr. Jablonski says, “That suggests thatvariation in human skin melanin production arose as different populations adapted biologically todifferent solar conditions around the world.”After watching this segment of the film, answer Question 10.QUESTIONPART 1 (continued)10. Based on what you know about skin pigmentation so far, suggest a mechanism by which UVintensity could provide a selective pressure on the evolution of human skin color. In other words,propose a hypothesis that links skin color to evolutionary fitness.PROCEDUREPART 2: What Was the Selective Pressure?Watch the film The Biology of Skin Color olor) fromtime stamp 9:08 minutes to 12:19 minutes. Pause when Dr. Jablonski says, “For that reason, though itmight cut your life short, it’s unlikely to affect your ability to pass on your genes.”After watching this segment of the film, answer Questions 11–13.QUESTIONSPART 211. What does it mean for a trait, such as light skin coloration, to be under negative selection inequatorial Africa? Relate negative selective pressure to what we know about MC1R allele diversityamong African populations.12. Why does Dr. Jablonski dismiss the hypothesis that protection from skin cancer provided selectionfor the evolution of darker skin in our human ancestors?!www.BioInteractive.orgPage 5 of 10!
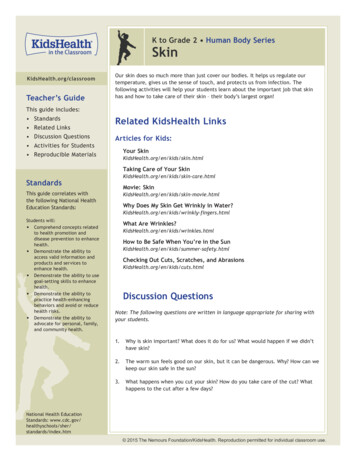
The Biology of Skin ColorLessonStudent Handout!13. Revisit your hypothesis from Question 10. Based on the information you have now, does this seemlike a more or less probable hypothesis than when you first proposed it? Provide evidence tosupport your reasoning.PROCEDUREPART 2 (continued)Watch the film The Biology of Skin Color olor) fromtime stamp 12:19 minutes to 13:32 minutes. Pause when Dr. Jablonski says, “That is what melanindoes.”In this segment of the film, Dr. Jablonski references a paper she had read about the connectionbetween UV exposure and the essential nutrient folate (a B vitamin), which circulates throughout thebody in the blood. The paper, published in 1978, describes how the serum (blood) folateconcentrations differed between two groups of light-skinned people. You will now look at one of thefigures from that paper.Examine Figure 3 and answer Questions 14–17.Figure 3. Folate Levels in Two Groups ofPeople. In one group (“patients”), 10 individualswere exposed to intense UV light for at least 30–60 minutes once or twice a week for threemonths. Sixty-four individuals not receiving thistreatement (“normals”) served as the controlgroup. The difference between the two groupswas statistically significant (p 0.005). Bracketsrepresent the standard error of the mean, and“ng/mL” means “nanograms per milliliter.”(Republished with permission of the AmericanAssn for the Advancement of Science, from Skincolor and nutrient photolysis: an evolutionaryhypothesis, Branda, RF and Eaton, JW,201:4356, 1978; permission conveyed throughCopyright Clearance Center, Inc.)!www.BioInteractive.orgPage 6 of 10!
The Biology of Skin ColorLessonStudent Handout!QUESTIONSPART 2: Interpreting the Figure14. Describe the relationship between folate levels and UV exposure. Use specific data from the graphto support your answer.15. Dr. Jablonski describes learning that low folate levels are linked to severe birth defects as a“eureka moment.” Explain what she means by this.16. Based on this new information, revise your hypothesis to explain the selective pressure on theevolution of human skin color.17. Can the effects of UV light on folate explain the full variation of human skin color that exists amonghuman populations today? Explain your reasoning.PROCEDUREPART 3: Why Aren’t We All Dark Skinned?Watch the film The Biology of Skin Color olor) fromtime stamp 13:32 minutes to 16:04 minutes. Pause when Dr. Jablonski says, “Support for the idea thatthe UV–vitamin D connection helped drive the evolution of paler skin comes from the fact thatindigenous peoples with diets rich in this essential vitamin have dark pigmentation.”Unlike many essential nutrients, vitamin D is produced by the human body. One type of UV radiationcalled UVB starts a chain of reactions that convert 7-dehydrocholesterol—a chemical found in skin—to vitamin D. Vitamin D is essential to the absorption of calcium and phosphorus from the foods we!www.BioInteractive.orgPage 7 of 10!
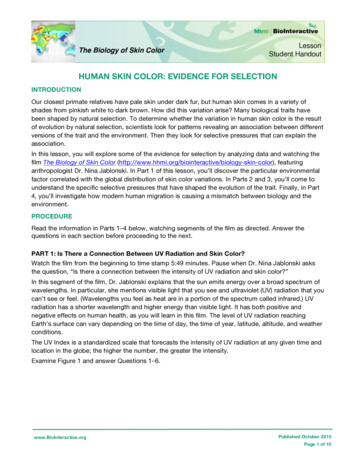
LessonStudent HandoutThe Biology of Skin Color!eat to make strong bones. It is also important for reproductive health and for the maintenance of astrong immune system. How much UVB exposure is necessary to synthesize sufficient vitamin Ddepends largely on two factors: UVB intensity and skin color. In general, at a given UV intensity, adark-skinned individual must be exposed to UVB five times as long as a light-skinned individual tosynthesize the same amount of vitamin D.Dr. Jablonski and Dr. George Chaplin published a paper in which they theorize whether available UVaround the world would enable individuals with different skin colors to synthesize an adequate amountof vitamin D. Figure 4 and Table 1 summarize the results.Analyze Figure 4 and Table 1 and answer Questions 18–22.Figure 4. Comparison of Geographic Areas in Which Mean UVB Intensity Would Not Be Sufficient forVitamin D Synthesis by Populations with Different Skin Colors. Widely spaced diagonal lines show regions inwhich UVB radiation, averaged over an entire year, is not sufficient for vitamin D synthesis by people with lightly,moderately, and darkly pigmented skin. Narrowly spaced diagonal lines show regions in which UVB radiation isnot sufficient for vitamin D synthesis by people with moderately and darkly pigmented skin. The dotted patternshows regions in which UVB radiation averaged over the year is not sufficient for vitamin D synthesis in peoplewith darkly pigmented skin. (Reprinted from The Journal of Human Evolution, 39:1, Nina G. Jablonski andGeorge Chaplin, The Evolution of Human Skin Coloration, 57-106, Copyright 2000, with permission fromElsevier.)Table 1. Key to Zones in Figure 4.Skin PigmentationWide DiagonalsNarrow DiagonalsDotsLightNYYModerateNNYDarkNNNNote: “Y” means that an individual with that skin pigmentation could synthesize sufficient vitamin D in the regionindicated throughout the year. “N” means that the person could not.!www.BioInteractive.orgPage 8 of 10!
The Biology of Skin ColorLessonStudent Handout!QUESTIONSPART 3: Interpreting the Figure18. Based on these data, describe the populations least likely to synthesize sufficient levels of vitaminD. Explain your answer with data from the table.19. How do these data support the hypothesis that the evolution of lighter skin colors was driven byselection for vitamin D production?20. For a person living farther away from the equator, would the risk of vitamin D deficiency be uniformor vary throughout the year? If it would vary, how would it vary? Explain your reasoning.21. Vitamin D and folate levels in the blood are both affected by UV light. Describe the predictedeffects of using a tanning booth (which exposes skin to UV light) on the blood levels of these twovitamins.22. Based on everything that you have learned so far, provide an explanation for how the differentshades of skin color from pinkish white to dark brown evolved throughout human history.!www.BioInteractive.orgPage 9 of 10!
The Biology of Skin ColorLessonStudent Handout!PROCEDUREPART 4: How Does Recent Migration Affect Our Health?Watch the film The Biology of Skin Color olor) fromtime stamp 16:04 minutes to the end.In this segment of the film, Dr. Jablonski and Dr. Zalfa Abdel-Malek explain that some people are living inenvironments that are not well matched to their skin colors. One example is vitamin D production. Therecommended level of circulating vitamin D is 20 ng/mL (nanograms per milliliter). But, as you learned inPart 3, vitamin D production is affected by UV intensity and skin color.Figure 5 shows the concentrations of serum 25(OH)D vitamin, which is the main type of vitamin D thatcirculates in blood. Measurements were taken among people living in the United States and werestandardized to negate the effects of weight, age, and other factors.Examine Figure 5 and answer Questions 23 and 24.Figure 5. Adjusted mean serum25(OH)D levels according torace/ethnicity and stratified accordingto gender (n 2629). aAdjusted forgender, age, weight, education, income,urban, region; b adjusted for age, weight,education, income, urban, region.(Reproduced with permission fromPediatrics 123, 797-803, Copyright 2009by the AAP.)QUESTIONS23. Describe the trends visible in the data. Which subpopulation (gender, race/ethnicity) is at thegreatest risk for vitamin D deficiency? Which subpopulation is at the least risk for vitamin Ddeficiency?24. What is one of the consequences of recent human migrations on human health?!www.BioInteractive.orgPage 10 of 10!
Nov 28, 2016 · skin reflectance. Scientists can shine visible light on a portion of skin (typically the inside of the arm) and then measure how much light is reflected back. Dark skin reflects less visible light than does light skin. The lower the reflectance value, therefore, the darker