Transcription
8. SoilMechanicsJames K. Mitchell, at 14'.David Cartier, IfI, b Nicholas C. Costes, eWilliam N. Houston, a Ronald F. Scott, d and H. John Hovland eThe objectives of the soil mechanicsexperimentsoil behavior is similar to that of terrestrialwere to determine the physical characteristics andmechanical properties of the lunar soil at the surfaceand subsurface and the variations in lateral directionsand to relate this knowledge to the interpretation oflunar history and processes. Data obtained on thelunar surface in conjunction with observations ofreturned samples of lunar soil are used to determinein-place density and porosity profdes and to determinestrength characteristics on local and regional scales,The soil mechanics experiment on the Apollo 17mission to the Taurus-Littrow area of the Moon waspassive and involved no apparatus or crew timeunique to the experiment. The preliminary analysesand interpretations presented in this report have beendeduced from studies of extravehicularactivity(EVA) transcripts and kinescopes, mission photographs, data on the lunar roving vehicle (LRV)performance, debriefings, and limited exaJNnation ofreturned lunar samples by the Lunar Sample Preliminary Examination Team (LSPET).SUMMARYOF PREVIOUSRESULTSsoils ofcomparable gradation (silty fine sand). Particle-sizedistribution, particle shape, and relative density (ref.8-2) control behavior.Soil porosity, density, and strength vary locallyand with depth. Absolute densities may range fromapproximately 1.0 to 2.0 g/cm a, and values 1.5g/cm a are probable at depths 10 to 20 cm. Therelative density of the soil near the surface isextremely variable but is generally quite high ( 80percent) below a depth of 10 to 20 cm. Althoughlocal (meter scale) variations in density and porosityexist, Houston et al. (ref. 8-3) and Mitchell et al. (ref.8-4) have shown that the mean porosity at each ofthe Apollo sites from footprint analysis is approximately the same for the upper few centimeters ofsoil. Analysis by Costes (ref. 8-5) of vehicle tracks at he same Apollo sites and at the Mare Imbrium site ofthe Soviet Luna 17 yields higher average porosityvalues at crater rims and other soft spots than forfirm soiI located in intercrater areas. The soil oncrater rims and on slopes appears to be more variableand, on the average,less denseand weaker than doessoil in intercrater plains areas.Relative density (or porosity) is probably the mostimportant single variable controlling strength, withmost probable values of cohesion in the range of 0.1to 1.0 kN/m 2 and friction angle in the range of 30 to 50 . The higher values are associated with higherrelative densities.The mechanical properties of lunar soil as deducedthrough the Apollo 15 mission were summarized byMitchell et al. (ref. 8-1). The Apollo 16 results agreedgenerally with those of earlier missions and alsoprovided more specific quantitative information ondensity and strength and their variability than wasavailable previously. Even though lunar and terrestrialsoils differ greatly in mineralogical composition, lunarDATASOURCESSoil mechanics data were derived from crewcommentary and debriefings, television, lunar surfaceof Californiaat Berkeley.bNASA Lyndon B. Johnson SpaceCenter.CNASAMarshallSpace Flight Center.dCalifornia Institute of Technology.epacificGas and Electric Company.#Principal Investigator.aUniversityphotographs, performance data and observations ofinteractions between soil and the LRV, drive-tubeand deep drill samples, and sample characteristics asdetermined by the LSPET.8-1
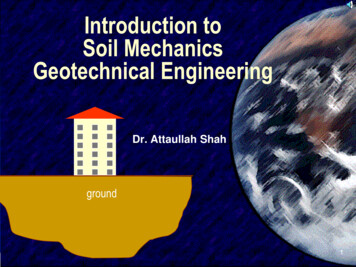
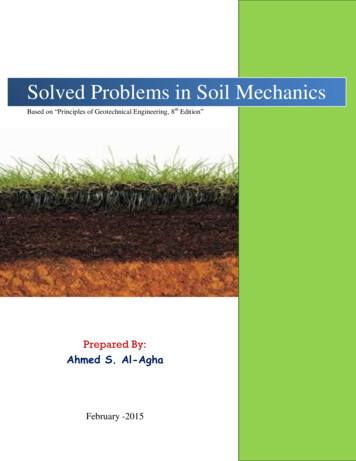
8-2APOLLO 17 PRELIMINARY SCIENCE REPORTInformation from these data sources has been usedin a manner similar to that from previous Apollomissions to deduce qualitative and semiquantitativeinformation about soil properties. A statistical studyof footprint and LRV track depths has been used as abasis for quantitative analysis of near-surface soilporosity. ]?remission orbital photographs and surfacephotographs have indicated a number of bouldertracks on the steep slopes of the North Massif andSouth Massif. These tracks have been analyzed byusing the method of Hovland and Mitchell (ref. 8-6).Additional quantitative estimates have been based onLRV track depths and other specific observations asnoted later in this section.RESULTSANDINTERPRETATIONSGeneral Soil Characteristicsmaurus-LittrowSiteat theSoil cover is present at all points visited in theTaurus-Littrow landing area. The surface is a similarcolor (gray and gray-brown) to that at the otherApollo sites, although lighter soil layers were encountered at shallow depths in some areas and orangecolored soil was exposed in a limited zone on the rimof Shorty Crater (station 4). Surface textures rangefrom smooth areas almost free of rock fragmentsthrough patterned ground to areas heavily concentrated with larger rocks and fragments. Variability insoil properties is evident locally. Qualitative indications of this variability on a meter scale are providedin figures 8-1 to 8-3.Soil behavior during landing, walking, driving, andsampling was comparable to that observed duringprevious missions. Dust was readily kicked up underfoot and by the LRV, tended to adhere to anysurface with which it came in contact, and inhibitednormal operations on several occasions.As readily apparent from the study of lunarsurface photographs and from crew commentary,disturbed areas on the lunar surface appear darkerthan undisturbed areas, as has been the case at theprevious landing sites. Subsequent crew observationsof the landing sites from lunar orbit indicated thatthe disturbed areas were lighter than the undisturbedareas. This difference in appearance could indicatethat the apparent changes in surface color caused bydisturbance result from texture-relatedchanges inalbedo that influence the appearance when viewedFIGURE 8-1.-Variable soil conditions in the vicinity of thesurface electrical properties (SEP) experiment as evidenced by variabte depths of LRV tracks and footprints(AS17-141-21517).FIGURE 8-2.-Variable soil conditions in the light mantle atstation 3 as evidenced by color differences (AS17-13821148).from different positions and at different Sun anglesrather than from real color changes as a result of theexposure of new material. Alternatively, the differentappearance might result from differences in scalebetween viewing from the surface and from orbit.
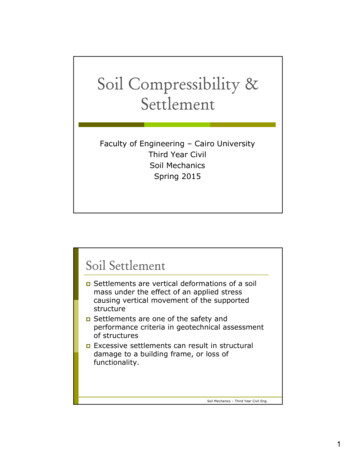
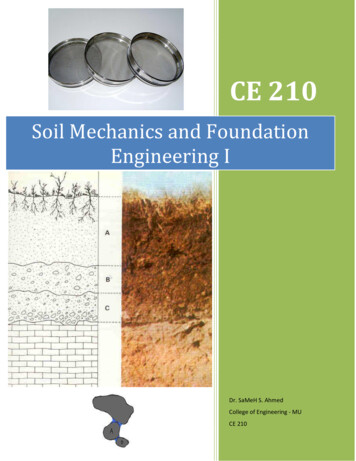
SOIL MECttANICS8-3, Apollo17 timebeforetouchdown,seco Apollo15 'timebeforetouchdown, seco Apollo14 time beforetouchdown, sec6050I o70t 6g,x.First dust Apollo151066 ."A-.2"' "'O40 -o6oo60"o o/,n Ao o, ,Loss0fvisibili y1 30C 52 20 oO O --O50 au/' (Apollo15)' 20 bS0Io . 40/ 1040Dj A 0 First dust(Apollo17)/Groundeleva'tion,Z (Apo,o1410-10 - Gr lundelevation. ttIIIII-10 0 i020 30 40 50 60 70 80 90 100Horizontaldistancewith respecttotouchdown,mFIGURE 8--4.-Descent trajectories for the Apollo 14, 15,and 17 missions.FIGURE 8-3.-Variable soil conditions inside Shorty Crater(station 4) as evidenced by different surface textures andslopes (AS17-137-21001).footpad probably hit the lunarthe unarModuleand Landingslightly.Photographs(e.g.,surface first and thatmay have strokedAS17-134-20388)showBoth the postmissiondescent trajectorydata andthe crew commentsindicatethat the Apollo17descentwas fairly rapid with vertical velocitiesofsome crumpling of the Mylar insulation on the lowerportion of the leg, indicating a possible stroking of 1or 2 cm. This crumpling did not happen on any of theprevious missions. From the photographs,no crushingof or damage to the footpad can be observed.approximately1 to 1.5 m/sec at altitudes of 60 to 70m above the lunar surface, slowing to somewhat lessthan 1 m/sec at an altitude of approximately15 to 20As in the other landings,the descentengineexhaust swept the lunar surface in the vicinity of thelanding site. Compared to adjacent areas, there werem. The descent was accompaniedby a fairly constantforward velocity of approximately0.7 m/sec in thefinal 20 m of descent. Thus, the lunar module (LM)came in on an oblique trajectorysimilar to that ofApollo 14 (fig. 8-4). Previous analyses and missionresults have shown that this kind of trajectorycausesleast disturbanceof the lunar surface material duringlanding. In contrast, vertical descents, such as that ofthe Apollo 15 LM, generate substantialamountsoferosion. Blowing dust was first observed at a height ofapproximately20 m above the lunar surface butcausedno visibilitydifficultiesduringthe finaldescent; in fact, the surface remained clearly visibleall the way to contact,The descent engine was shut down approximately1 sec after contactwas indicated,and the LMdropped to the lunar surface while maintaining someforward velocity. The crew noted that the rear (-Z)relatively fewer small rock fragments and soil clumpsbeneath the LM, althoughrocks 10 cm in diameterand larger remained.The crew observed that therev/ere clear indicationsof the interactionof thedescent propulsionsystem exhaust gas with the lunarsurface to a distance of approximately50 m from theLM.From the crew's commentsduring sampling, thelack of blowing dust during the final stages of thedescentdoes not appearto be caused by soilpropertiesdifferentfrom those experiencedin priorlandings. As noted in the subsequentsections, thegrain-size distribution,cohesion, and density of thesoil around the LM are similar to those previouslyestablishedfor lunar soil. This similaritytends toconfirmpreviousconclusionsthat the amountofblowing dust during a landing is directly related tothe descent trajectoryand descent rate.
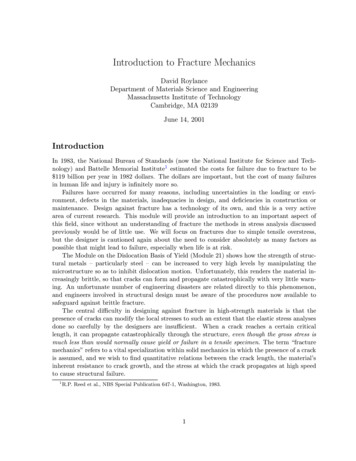
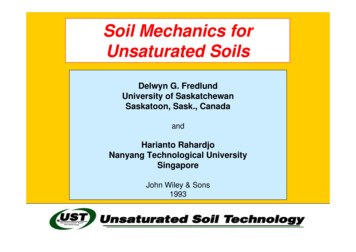
8-4APOLLO 17 PRELIMINARY SCIENCE REPORTGrain-Size DistributionandsamplenumbersSoil CompositionAt the time this report was prepared, the LSPEThad determined the complete grain-size distributionof 15 samples and the distribution of a small aliquot,,.;,, ; / 0zs0s0of the black soil taken from the bottom of the doublecore-tube sample taken at station 4. The results areshown in figure 8-5. These gradations are generallysimilar to those observed at previous landing sites.toO"/""//80c], . A/A 'The band of 11 samples in figure 8-5 is slightlycoarser in the coarse fractions than the compositedistribution band for Apollo 1 1, 12, 14, and 15 (ref."71 0" , .' 15y ,,,,.60-x .74240Igrayso8-7), primarily because of the excess particles in thefraction that is 10 ram. This observation was alsonoted for some of the Apollo 16 soils (ref. 8-4) andwas attributedto the recent addition of coarsefragments that had not yet been worked into the soilmatrix from the South Ray Crater event. Sample71060 was taken at station 1 from beneath a blecoreatstati n4)4)0g- 2010I.1Particlesize,mmI.01overhang of a rock, and the crew observed that therewere chips in the soil. The distribution for sample74240, the gray soil found next to the orange soil,FIGURE 8-5.-Groin-size distribution curves for severalApollo 17 samples.was changed considerably when the total sample wasincluded,Despite the similarity of the grain-size distributions of the samples from various stations, the LSPEThas found that the composition of the soil is highlyvariable in terms of proportions of basalt, breccia,mineral fragments, glass, and agglutinates. The softsfrom the massif stations appear to be derived frombreccias, whereas much of the dark mantle on theplains was probably derived from basalts. The orangesoil at station 4 is unique and is composed almostentirely of orange glass,A knowledge of particle composition is importantfor the interpretationof data from many lunarexperiments because, at the same relative density,soils consisting of coherent particles are stronger andconduct heat and seismic signals better than soilscomposed of friable particles.increases with depth, an observation consistent withfindings at the Apollo 15 and 16 sites (fig. 8-7).However, the Apollo 17 core-tube densities (with theexception of the double core at station 4) are muchmore uniform with depth than were the Apollo 15and 16 core-tube samples. The Apollo 17 core-tubedensities tend to be higher near the surface andslightly lower below a depth of 20 to 30 cm than dothe average densities for the Apollo 15 and 16drive-tube samples.The high core recovery percentages at stations 4and 6 and at the LM are comparable to those of theApollo 15 and 16 samples for which the same type ofcore tube was used. The lower core recovery percentages at stations 3 and 9 indicate that the returnedbulk densities will have to be corrected for samplecompression.Densities in the double core from the rim ofCore SamplesDrive Tubes.-Data on the drive-tube samples aresummarized in table 8-I, and the sampling at station6 is shown in figure 8-6. The bulk densities of thesamples in the drive tubes as a function of depth inthe lunar surface are presented in figure 8-7. In allinstances, the density of the soil in the lower tube isgreater than that in the upper tube; that is, densityShorty Crater at station 4 (2.03 to 2.29 g/cm 3) aredistinctly higher than heretofore observed for anylunar samples. The upper tube contains orange-redsoil with fine-grained black soil in the lower part.Black soil is exposed at the top and bottom ends ofthe lower tube. The orange soil, which is composedalmost entirely of glass particles, is unusually cornpact and exhibits a high cohesion. A trench excavatedinto the material illustrates the high cohesion in the
SOIL MECHANICSTABLEStation34LMSamplelength, acm7300273001b429b80921.8e34.9Cl.60 ample no.t2031d2046-%1%Data on ApolloSampleweight,gSerial no.%698-1.-Preliminary8-51 7 Drive-TubeBul,' density,g/cr aTube depth(pushed),cmSamplesTotal depth(pushed anddriven), cmt9.f'ff"16.2 -0.5f'g71 37.1 0.59.h28 3g71 2h28 3p70.6 - 5No. ofhammerblowsCorerecovery,percent 982 - 2 2896 - 3h5 or 693 - 2 19076 - 297 - 10aDetermined from X-radiographs, except as noted.bSample weights are -4 g; better accuracy will be possible when ubes are removed from stretch cans.CCorrected for voids.dCore sample vacuum container.eAssumed length.tCamera failure; photographs were blank.gEstimated from kinescopes.hCrew estimate.iEither 41 cm 3 of sample fell out of the top of the tube or the keeper compressed the top of the sample. The former is considered the more likely explanation; thus, density has been calculated accordingly.JApproximately 114 cm 3 fell out of tile bottom of the tube after it was placed in the sample collection bag because of aloose cap.tbrm of a tendencychunks (fig. 8-8).of thematerialto breakintoUnfortunately,the top of the soil column in thetop three drill-stem sections, which were returned as aThe numberof hammerblows (table 8-I), asindicatedby the kinescopes,requiredto drive thecore tube at station 4 was not exceptionallyhighunit, movedapproximately15 cm, causing somelooseningand disturbance.However,becausetheinitial samplelengthis known,it is possible tocomparedto the drivingearlier missions, indicatingsignificantlyless (or theresistanceencounteredonthat tire porosily was notrelative density higher) atestimate the initial average density for the top threedrill-stem sections to be 1.99 - 0.05 g/cm 3, as shownin table 8-II.this locationthan had been previously encountered.Thus, the much higher bulk density is most likelycaused by a higher specific gravity of the individualparticles. Whereas the maximumreportedvalue ofspecific gravity is 3.2 for an Apollo 15 sample (ref.8-2), the soil in the lower half of the double core mayhave a value as high as 4. The black soil in the doubleThe bulk density as a functionof depth in thelunar surface for the drill-stem samples is shown infigure 8-9. Values for the Apollo 15 and 16 deepdIill-stem samples are shown for comparison.Becausethe core recoverywas nearly100 percent,themeasured bulk densities should be quite close to thein situ values.core is composedprimarilyolivine phenocrysts,a traceAll the bulk densities are high; that of the seconddrill stem (2.11g/cm 3) is remarkablyso. Theof crystallinedroplets,of glass, and 25-percentilmenite that has a specific gravity of 4.7. The LSPEThas found that the black material is the first lunar soilstudied thus far that contains no agglutinates,Drill Stems.-Thedeep core was drilled to a depthX.radiographsindicatedthis sectionto be quitegravelly, and dissection by the LSPET has confirmedthis. This zone may be related to the hard layerencounteredin the LM area at the end of EVA-3of 3.05 0.01 m at a point approximatelynorth of the Apollo lunar surface experimentwherefourth40 mpackage(ALSEP) central station. Core recovery was 95 to 97percent, and preliminarydata on the eight drill-stemsections are given in table 8-II.a single core-tube sample was obtained.throughthe seventhdrill stems allThehaveessentially the same density; the X-radiographsshowuniformity as well.The absolute densities at the Apollo 17 drill site
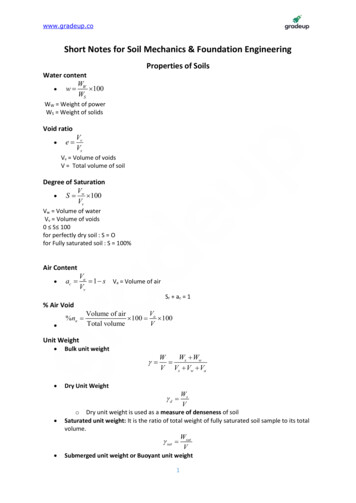
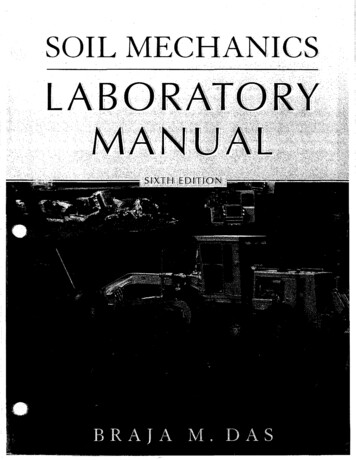
8-6APOLLO17 PRELIMINARYSCIENCE010REPORTIIStation 6--!-,. [LMIi:' . " -Station9 (?)E 20 ;tation3(?)!" .'--t ,.' lStation 44o 5060701.0Apollo15and161IIIr -JL ,jII1.52.0Bulk density,glcm3I2.5FIGURE 8-7.-Bulk density as a function of depth in thelunar surface for drive-tube samples.FIGURE 8-6.-Single drive tube at station 6. The drive tubehas just been pushed to a depth of approximately 16 era.A special orientation mark is visible above and to the rightof the numeral 8 on the tube. This is the only drive tubefrom Apollo 17 that has been positively oriented in thelunar surface. After this photograph was taken, the drivetube was hammered to a final depth of 37 cm (AS17146-22291).FIGURE 8 8.-Trench excavated into orange soil on rim ofShorty Crater at station 4. The chunky texture reflectsthe high cohesion of this soil (AS17-137-20989).are generallyhigher thanthose measuredat theApollo 15 and 16 drill sites, and the distributionofdensities as a functionof depth suggests a deposi-16 and 17 had been available, the predicted drillrateat the Apollo 15 site would have been the same orslightly less than that measured at the Apollo 17 site,tional history entirelydifferentfrom either of theprevious two sites. The average drill rate of the firstApollo 17 heat flow borestem was approximately70cm/min,indicatingthat the relative density at theindicating that although the absolute densities in theApollo 15 drill stem were less than those of Apollo17, the relative densities were generally the same orhigher. This indicationimplies a significantlydif-the Apollo 17 site is considerablyhigher than that atApollo 16 site. If the later borestem design of Apolloferent soil composition.Even thoughthe relativedensities at the Apollo 17 drill sites were indicated to
SOIL MECHANICSTABLE 8-II.-PreliminarJ Data on Apollo8-71 7 Drill-Stemill-stemrial no.Sampleno.Returnedsampleweigh t,agReturnedsamplelength, bcmReturnedbulkdensity, eg/cm 3Originalsamplelength, 60.9179.4234.2240.6238.825 :- 2f38g34 :t 239.939.939.91.76 - 0.142.111.62 - 0.101.801.851.84elO - 239.939.939.939.939.9i209 39.9f h42.0)SectionsOriginalbulkdensity, cg/cm aDrillstemdepth,emCorerecovery,percent' 305 -195 to 971.99 - 0.051.801.851.841.831.74]aTotal weight is 1772.5.bDetermined by X-radiography.CBased on a sample diameter of 2.04 cm.dTotal length is 292 2.eCore-tube rammer-jammer was inserted to a depth of 30 -2 cm before drill stem was withdrawn from soil.fApproximately 2-cm void at top of stem.gApproximately 6-cm void at top of stem.hNominal length is 42.5 cm; 0.5 cm fell out of bottom of drill stem on lunar surface.0IIi100E"II.t. .,,.I 16! ,Apolloit., IIt"--"' 2oo3 .0Apollol5/.I Inot uncommon1soft.Iltlnearthe surfaceare alsoprobe was inserted to a depth of 2.1 m (length ofprobe) in the vacated hole. Before insertionof theApollo17probe, it was noted that the hole was intact andflared at the top. No resistance to insertionof the"7l!probe was encountered,exceptat approximatelyone-thirdthe depth where a slight obstructionwasnoted. This resistancemay have coincidedwith thetI1.52.0gulkdensity, g/cm3quite high, the observedsoil conditionsindicated for the Apollo 16 site by the porosityasatthe Apollo16 site mayhave beenanomalouslydeterminedby analysisof footprintdepthsand LRVtracks (ref. 8-1).After extractionof the drill stem, the neutron fluxi2.5FIGURE8-9.-Bulkdensity asa function of depth in thelunar surfacefor drill-stemsamples.be generallySofterfor the lunar surface and that the soildrill rates werequite variable and reflected hard and soft layers atdepth,After the easy drilling experiencesof Apollo 16, itwas assumed that the hard drilling encounteredatApollo 15 was exceptional.On the basis of three datapoints, it must now be concluded that hard drilling islocation of the gravel layer. There was no noticeableresistance to withdrawalof the neutron flux probe atthe end of EVA-3, at which time it had been in theground for 49 hr. This suggests that there was nocaving or squeezingof the soil under the increasedshear stresses caused by the presence of the hole, inagreement with premission predictions.A stabilityanalysisof the open drill hole provideslower bound estimates of the soil strength parametersas shown by Mitchell et al. (ref. 8-8). In that report,the horizontalscale in figure 7-24 is in error. Acorrectedplot of the relationshipbetweensoil cohesion and friction angle and the depth to the bottomof the elastic zone in an open boreholeis given in
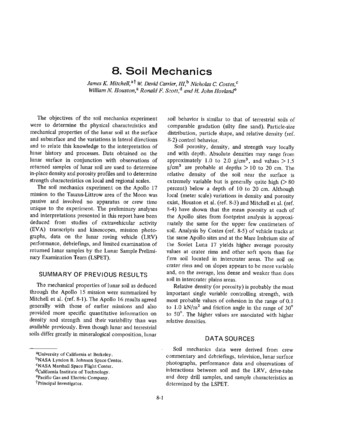
8-8APOLLO 17 PRELIMINARY SCIENCE REPORTfigure 8-10. Below the depth corresponding to anygiven combination of friction angle and cohesion, aplastic zone should develop, and there should be soilyielding that would lead to closure of the hole byinward squeezing of the soft.If no yielding of the soil developed to a depthcorresponding to the length of the neutron flux probe(and little could have occurred because the probediameter is only slightly less than the hole diameter),then the required strength parameters are as indicatedby the vertical line in figure 8-10 at a depth of 2.1 m.Even for high friction angles ( 50 ), a soil cohesionexceeding 1.0 kN/m 2 is required. Strength parametersof this magnitude are likely only for conditions ofhigh relative density and would be consistent with thehard drilling discussed previously. High strength is notrequired for the full depth of the hole. Stability canbe maintained for conditions of strength increasingwith depth to satisfy figure 8-10 at any depth,2.5Frictionangle 30*2.0o40 I1.5.o 1.050 L5opio etr0n.5 f"0i.5. ]iuiIIIII1.01.52.02.5Depth0tb0reh01e,rai3.oFIGURE 8-10. Depth to bottom of the elastic zone in anopen borehole as a function of soil strength parameters,Although the open holes remaining after extraction of the drill stem suggest quite high strengths fordepths of approximately 2 m at both the Apollo 16and 17 sites, strengths of this magnitude are notcommonly encountered at shallow depths as indicated by the values determined by penetrometertesting at the Apollo 16 site (ref. 8-1).BoulderTracksMore than 300 tracks made by boulders rolling,bouncing, and skidding down lunar slopes wereidentified by Grolier et al. (ref. 8-9) in the LunarOrbiter photographs. The Apollo 17 mission providedthe first opportunityfor a close study of theseinteresting features because many tracks can be seenon the Taurus-Littrow hills. Unfortunately, prints ofthe 500-mm lunar surface photographs, which permitthe most detailed study of the tracks, were notavailable to the soil mechanics team during thepreparation of this report. Hence, the analyses, basedmainly on 60-mm and premission orbital photographs, are tentative, and the results are subject tosubsequent refinement. In a qualitative sense, bouldertracks serve as exploratory trenches and can providethe relative sharpness of track features provides someindication of soil movement after track formation.Quantitativeanalysis of boulder tracks, fromwhich information can be derived relating to soilinformation about regolith thickness and history, andstrength and density, is possible. Studies of this typeal. (ref. 8-11), Moore (ref. 8-12), Moore et al. (ref.have been reported by Filice (ref. 8-10), Eggleston et8-13), and Hovland and Mitchell (ref. 8-6) for bouldertracks found in Lunar Orbiter photographs. Themethod in reference 8-6 is used here. An obliquecloseup view of a larger boulder and its associatedtrack visited at station 6 on the south slope of theFIGURE 8-11.-Partial panorama at station 6 showing a laxgeboulder and the track down which itrolled (AS17-141-21582,21584, 21586, 21590, and 21594).
SOIL MECHANICSNorth Massif during EVA-3 is shown in figure 8-11.Several tracks were locatedon the premissionorbitalphotographsof the East Massif and the8-9SculpturedHills; their locationsare indicatedinfigure 8-12. Several tracks on the South Massif areidentifiedin figure 8-13. Additionaltracks on theL. .J530 m.Boulder tracksFIGURE 8-12. Locations of boulder tracks on the East Massif and on the Sculptured Hills. For tracksidentified by a letter, a definite causative bouhler could be located; for tracks identified by anumber, only the most probable causative boulder could be located.
8-12APOLLO 17 PRELIMINARY SCIENCE REPORT.BouldertracksFIGURE 8-15.-Boulder tracks on the North Massifas seen from the LM (track identifications are thesameas for fig. 8-12) (AS17-147-22502).and is used with a bearing capacity equationadaptedto the case of a rolling sphere. The resulting relationships between soil friction angle, slope angle, andtrack-width-to-boulder-diameterratio are shown infigure 8-16. A soft density of 1.6 g/cm 3 and acohesion of 1 kN/m 2 were assumed. This value ofcohesion is near the upper end of the range ofcohesion values determined for the lunar soil thus far(refs. 8-1 and 8-4). The effect of an overestimation incohesion by as much as a factor of 10 will lead to anunderestimation of friction angle of only 1 to 2 ,however. An estimate of the variations in frictionangle that are likely to result from errors in ameasurementof track depth and width and inboulder size has been made (ref. 8-6). The analysisindicated that friction could differ by as much as- 2 because of measurement errors.The frequency distribution of the soil frictionangles derived from the boulder track data is shownin figure 8-17 and is generally compatible with thesoil gradations, densities, and porosities found atother locations on the Moon. Although the range issimilar to that determined by other means (refs. 8-1and 8-4), the most frequent values are somewhat lessthan would be expected because tracks of the sizeanalyzed must involve considerably greater soildepths than for the other determinations.Thisdifference may reflect limitations in the analysis,Thus, the variability indicated by figure 8-17 isconsidered more reliable than the absolute values offriction angle.Surface Soil PorosityDeduced fromFootprint AnalysisPreviously developed methods (refs. 8-3 and 8-4)have been used to extend the statistical analysis oflunar soil porosity as deduced from footprint depthsto include the Apollo 17 site. The curve correlatingfootprint depth with average porosity and relativedensity of the upper few centimeters of the lunarsurface, based on results of model test and theoreticalanalyses (ref. 8-14), is shown in figure 8-18.A total of 144 different footprints from theApollo 17 photographs were analyzed, and the resultsare summarized in table 8-IV. A histogram showingall data for Apollo 17 is presented in figure 8-19. Alsosummarized in table 8-1V are results for previousApollo missions. For the Apollo 17 site, only threefootprints on crater rims were analyzed. This samplesize is too small to characterize crater rims statistically; thus, the values shown in table 8-IV areessentially applicable only to intercrater areas.The data in table 8-IV show that neither theintercrater average porosity (43.4 percent) nor thestandard deviation (2.4) differ significantly from the
SOIL MECHANICSTABLE8-III.-Apollo1 7 BouMerTrackno. 25252525252525250.9.92.5.5.4.61.4.8.1- .5.51.8.1.7.9.4.41.02.0Traclwidth,w, m8-13TracksBoulderdiameter,D, 096812.2.0?272935393838283341letter, a definite causative boulder could be located; for tracks identified by a number, only thecould be located.Apollo sites. The Apolloslightly higher. TheApollo17 also compareaverage values for alland 2.75) and the unand 2.55). The unby computinga simpleaveragesfor each siteof observationsat anyone site. Conversely,the weighted average porosity(44.0 percent) is weighted heavily in favor of Apollo]6 where an unusuallylarge numberof footprintobservationswas possible.Thus, the unweightedvalues (43.5 percent and 2.55) probably represent abetter estimate for a randomlyselected location onthe lunar surface.No distinguishabledifferencein porositywasfound betweenthe Apollo 17 traverse stations and
8-14APOLLO17 2(]201010i.2i.4.6 .8I1.00w 1m/I.2I.4I.6w/Dw/D(a) Slope angle 0 .(c) Slope angle 20 .I.8J1.06
8.Soil Mechanics James K. Mitchell, at 14'.David Cartier, IfI, b Nicholas C. Costes, e William N. Houston, aRonald F. Scott, d and H. John Hovland e The objectives of the soil mechanics experiment soil behavior is similar to that of terrestrial soils of were to determine the physical ch