Transcription
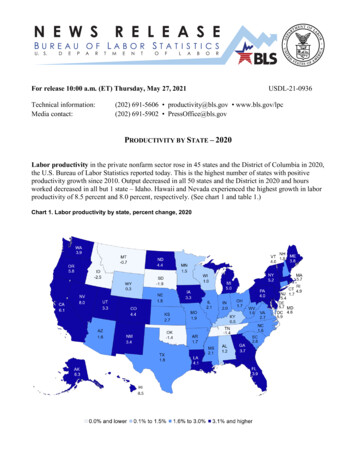
For release 10:00 a.m. (ET) Thursday, May 27, 2021Technical information:Media contact:USDL-21-0936(202) 691-5606 productivity@bls.gov www.bls.gov/lpc(202) 691-5902 PressOffice@bls.govPRODUCTIVITY BY STATE – 2020Labor productivity in the private nonfarm sector rose in 45 states and the District of Columbia in 2020,the U.S. Bureau of Labor Statistics reported today. This is the highest number of states with positiveproductivity growth since 2010. Output decreased in all 50 states and the District in 2020 and hoursworked decreased in all but 1 state – Idaho. Hawaii and Nevada experienced the highest growth in laborproductivity of 8.5 percent and 8.0 percent, respectively. (See chart 1 and table 1.)Chart 1. Labor productivity by state, percent change, 2020
Chart 2 displays selected states with their productivity changes and respective gains or losses in outputand hours worked in 2020. The ten states with the fastest growth in productivity all saw gains of more than 5.0 percent:o Hawaii, 8.5 percento Nevada, 8.0 percento Alaska, 6.3 percento California, 6.1 percento District of Columbia, 5.9 percento Oregon, 5.8 percento Massachusetts, 5.7 percento Delaware, 5.7 percento New Jersey, 5.4 percento New York, 5.2 percent Labor productivity declined in five states (Idaho, South Dakota, Oklahoma, Tennessee, andMontana) due to a more rapid decline in output than in hours worked. Idaho is the only state withan increase in hours (1.1 percent) and lower labor productivity. All other states saw increases in labor productivity due to declines in hours that outpaced declinesin output.Chart 2. Labor productivity, output, and hours worked for select states, percent change, ct of ColumbiaOregonMassachusettsDelawareNew JerseyNew aTennesseeOklahomaSouth DakotaIdaho-50510Percent ChangeOutput1520-20-15Hours-10-5Percent Change05Each state’s annual contribution to national productivity growth is calculated by multiplying the state’sproductivity growth rate by its average share of total current dollar national output. The economic size ofeach state influences its contribution to national and regional estimates. For 2020, California had thelargest contribution to national growth. The state’s 6.1-percent growth in labor productivity in 2020contributed nearly one quarter of the 3.6-percent growth of the nation. (See chart 3.)2
Chart 3. Contributions to national labor productivity, 2020NationalCaliforniaNew YorkFloridaMassachusettsNew JerseyTexasPennsylvaniaNational productivity growth is equal to the sum of thecontributions of each state. This chart showscontributions of the top 10 ong term trendsChart 4 shows the average annual percent change in labor productivity for all 50 states and the District ofColumbia for the period 2007-2020.Chart 4. Labor productivity by state, average annual percent change, 2007-20203
From 2007 to 2020, labor productivity rose in 48 states and the District of Columbia.Output increased in 44 states and the District of Columbia during this period, while hours workedincreased in only 15 states.North Dakota experienced the highest rate of growth of 3.1 percent. Wyoming posted a slightdecline in labor productivity over the long term, and Louisiana saw no change.The first and last years of this series coincide with severe recessions. During the recession of 2007to 2009, 47 states experienced increases in labor productivity, though only 10 saw growth inoutput. No state saw an increase in hours worked during that period. These trends closely mirrorthe most recent year’s labor productivity and hours trends. (See chart 5.)Chart 5. Number of states with increases in labor productivity, output, and hours worked, 2007-2020Number of States504030201002008 2009 2010 2011 2012 2013 2014 2015 2016 2017 2018 2019 2020Labor productivityOutputHoursNote: Shaded areas denote years that include recessionsChart 6 shows states with the highest contribution to the national average annual percent change in laborproductivity from 2007 to 2020. California, New York, and Texas, which have the largest economies,contributed the most to national productivity growth, about 40 percent of the 1.4-percent increase.Chart 6. Contributions to national labor productivity, average annual percent change, 2007-2020NationalCaliforniaNew aIllinoisNational productivity growth is equal to the sum of thecontributions of each state. This chart showscontributions of the top 10 states.GeorgiaOhio00.20.40.60.8411.21.41.6
Additional InformationOutput and compensation measures for 2019 and earlier years reflect revisions to GDP by state andindustry data published by the Bureau of Economic Analysis. Hours and employment data through 2019have been revised to incorporate the BLS 2020 Current Employment Statistics benchmark.The COVID-19 pandemic did not impact the availability of source data used to construct productivitymeasures in this release. Data source providers continued to collect and publish high quality industry datafor 2020. Additional information can be found on the BLS website at oductivity.Access the following productivity data at www.bls.gov/lpc/lpc-by-state-and-region.xlsx: Detailed data series: indexes of productivity and related measures; rates of change; and levels of stateemployment, hours worked, nominal value of production, and labor compensation Additional years and long-term dataSubscribe to productivity news releases on the BLS website /subscriber/new.Information in this release will be made available to individuals with a sensory impairment upon request.Voice phone: (202) 691-5200; Federal Relay Service: (800) 877-8339.5
Technical NoteLabor Productivity: Labor productivity describes the relationship between real output and the laborhours involved in its production. These measures show the changes from period to period in the amountof goods and services produced per hour worked. Although the labor productivity measures relate outputin a state to hours worked of all persons in that state, they do not measure the specific contribution of laborto growth in output. Rather, they reflect the joint effects of many influences, including: changes intechnology; capital investment; utilization of capacity, energy, and materials; the use of purchased servicesinputs, including contract employment services; the organization of production; the characteristics andeffort of the workforce; and managerial skill.Output: Measures of output for the private nonfarm sector are created using GDP by state and industrydata published by the Bureau of Economic Analysis (BEA). BEA does not produce a private nonfarmsector measure of real output by state. To create the necessary output series, several industry componentsare subtracted — the farm sector, private households, and owner-occupied housing — from GDP by stateusing a Fisher ideal index formula.Labor Hours: Hours are the number of hours worked by all employed persons, including wage and salaryworkers, self-employed persons, and unpaid family workers. Hours for wage and salary workers areprimarily from BLS Current Employment Statistics (CES) and hours for self-employed and unpaid familyworkers are from the BLS Current Population Survey (CPS). The hours are adjusted from an hours paidbasis to an hours worked basis using data from the BLS National Compensation Survey (NCS).Unit Labor Costs: Unit labor costs represent the cost of labor required to produce one unit of output. Theunit labor cost indexes are computed by dividing an index of nominal industry labor compensation by anindex of real industry output. Unit labor costs also describe the relationship between compensation perhour worked (hourly compensation) and real output per hour worked (labor productivity). When hourlycompensation growth outpaces productivity, unit labor costs increase. Alternatively, when productivitygrowth exceeds hourly compensation, unit labor costs decrease.Labor Compensation: Labor compensation, defined as payroll plus supplemental payments, is ameasure of the cost to the employer of securing the services of labor. Labor compensation measures areconstructed using BEA nonfarm compensation less private household compensation. Compensation forself-employed and unpaid family workers are imputed by assuming that hourly compensation for theseworkers is the same as the average wage and salary worker in each state.Contributions to Labor Productivity: Each state’s contribution to national productivity growth iscalculated by multiplying the state’s productivity growth rate by its average share of total current dollarnational output. Adding up these contributions will approximate, but may not exactly equal, growth ratesof national productivity. Contributions measures used in this release capture the effects of within-stateproductivity changes but do not include the effects of shifting shares of output and labor among states.6
Table 1. Recent labor productivity and related data, private nonfarm sectorArea NamePercent change, yOutputHoursworkedUnit 98.5StatesAlabama. . . . . . . . . . . . . . . . . . . . . . . . . . . . . . . . . . . . . .Alaska. . . . . . . . . . . . . . . . . . . . . . . . . . . . . . . . . . . . . . . .Arizona. . . . . . . . . . . . . . . . . . . . . . . . . . . . . . . . . . . . . . .Arkansas. . . . . . . . . . . . . . . . . . . . . . . . . . . . . . . . . . . . .California. . . . . . . . . . . . . . . . . . . . . . . . . . . . . . . . . . . . .Colorado. . . . . . . . . . . . . . . . . . . . . . . . . . . . . . . . . . . . . .Connecticut. . . . . . . . . . . . . . . . . . . . . . . . . . . . . . . . . .Delaware. . . . . . . . . . . . . . . . . . . . . . . . . . . . . . . . . . . . .District of Columbia. . . . . . . . . . . . . . . . . . . . . . . . . .Florida. . . . . . . . . . . . . . . . . . . . . . . . . . . . . . . . . . . . . . . .Georgia. . . . . . . . . . . . . . . . . . . . . . . . . . . . . . . . . . . . . . .Hawaii. . . . . . . . . . . . . . . . . . . . . . . . . . . . . . . . . . . . . . . .Idaho. . . . . . . . . . . . . . . . . . . . . . . . . . . . . . . . . . . . . . . . . .Illinois. . . . . . . . . . . . . . . . . . . . . . . . . . . . . . . . . . . . . . . . .Indiana. . . . . . . . . . . . . . . . . . . . . . . . . . . . . . . . . . . . . . . .Iowa. . . . . . . . . . . . . . . . . . . . . . . . . . . . . . . . . . . . . . . . . . .Kansas. . . . . . . . . . . . . . . . . . . . . . . . . . . . . . . . . . . . . . .Kentucky. . . . . . . . . . . . . . . . . . . . . . . . . . . . . . . . . . . . .Louisiana. . . . . . . . . . . . . . . . . . . . . . . . . . . . . . . . . . . . .Maine. . . . . . . . . . . . . . . . . . . . . . . . . . . . . . . . . . . . . . . . .Maryland. . . . . . . . . . . . . . . . . . . . . . . . . . . . . . . . . . . . .Massachusetts. . . . . . . . . . . . . . . . . . . . . . . . . . . . . . .Michigan. . . . . . . . . . . . . . . . . . . . . . . . . . . . . . . . . . . . . .Minnesota. . . . . . . . . . . . . . . . . . . . . . . . . . . . . . . . . . . .Mississippi. . . . . . . . . . . . . . . . . . . . . . . . . . . . . . . . . . . .Missouri. . . . . . . . . . . . . . . . . . . . . . . . . . . . . . . . . . . . . .Montana. . . . . . . . . . . . . . . . . . . . . . . . . . . . . . . . . . . . . .Nebraska. . . . . . . . . . . . . . . . . . . . . . . . . . . . . . . . . . . . .Nevada. . . . . . . . . . . . . . . . . . . . . . . . . . . . . . . . . . . . . . .New Hampshire. . . . . . . . . . . . . . . . . . . . . . . . . . . . . .New Jersey. . . . . . . . . . . . . . . . . . . . . . . . . . . . . . . . . . .New Mexico. . . . . . . . . . . . . . . . . . . . . . . . . . . . . . . . . .New York. . . . . . . . . . . . . . . . . . . . . . . . . . . . . . . . . . . . .North Carolina. . . . . . . . . . . . . . . . . . . . . . . . . . . . . . .North Dakota. . . . . . . . . . . . . . . . . . . . . . . . . . . . . . . . .Ohio. . . . . . . . . . . . . . . . . . . . . . . . . . . . . . . . . . . . . . . . . . .Oklahoma. . . . . . . . . . . . . . . . . . . . . . . . . . . . . . . . . . . .Oregon. . . . . . . . . . . . . . . . . . . . . . . . . . . . . . . . . . . . . . .Pennsylvania. . . . . . . . . . . . . . . . . . . . . . . . . . . . . . . . .Rhode Island. . . . . . . . . . . . . . . . . . . . . . . . . . . . . . . . .South Carolina. . . . . . . . . . . . . . . . . . . . . . . . . . . . . . .South Dakota. . . . . . . . . . . . . . . . . . . . . . . . . . . . . . . .Tennessee. . . . . . . . . . . . . . . . . . . . . . . . . . . . . . . . . . .Texas. . . . . . . . . . . . . . . . . . . . . . . . . . . . . . . . . . . . . . . . .Utah. . . . . . . . . . . . . . . . . . . . . . . . . . . . . . . . . . . . . . . . . . .Vermont. . . . . . . . . . . . . . . . . . . . . . . . . . . . . . . . . . . . . .Virginia. . . . . . . . . . . . . . . . . . . . . . . . . . . . . . . . . . . . . . .Washington. . . . . . . . . . . . . . . . . . . . . . . . . . . . . . . . . .West Virginia. . . . . . . . . . . . . . . . . . . . . . . . . . . . . . . . .Wisconsin. . . . . . . . . . . . . . . . . . . . . . . . . . . . . . . . . . . .Wyoming. . . . . . . . . . . . . . . . . . . . . . . . . . . . . . . . . . . . .RegionsMidwest. . . . . . . . . . . . . . . . . . . . . . . . . . . . . . . . . . . . . . .Northeast. . . . . . . . . . . . . . . . . . . . . . . . . . . . . . . . . . . . .South. . . . . . . . . . . . . . . . . . . . . . . . . . . . . . . . . . . . . . . . .West. . . . . . . . . . . . . . . . . . . . . . . . . . . . . . . . . . . . . . . . . .7
Table 2. Long run labor productivity and related data, private nonfarm sectorArea NameAverage annual percent change, yOutputHoursworkedUnit abama. . . . . . . . . . . . . . . . . . . . . . . . . . . . . . . . . . . . . .Alaska. . . . . . . . . . . . . . . . . . . . . . . . . . . . . . . . . . . . . . . .Arizona. . . . . . . . . . . . . . . . . . . . . . . . . . . . . . . . . . . . . . .Arkansas. . . . . . . . . . . . . . . . . . . . . . . . . . . . . . . . . . . . .California. . . . . . . . . . . . . . . . . . . . . . . . . . . . . . . . . . . . .Colorado. . . . . . . . . . . . . . . . . . . . . . . . . . . . . . . . . . . . . .Connecticut. . . . . . . . . . . . . . . . . . . . . . . . . . . . . . . . . .Delaware. . . . . . . . . . . . . . . . . . . . . . . . . . . . . . . . . . . . .District of Columbia. . . . . . . . . . . . . . . . . . . . . . . . . .Florida. . . . . . . . . . . . . . . . . . . . . . . . . . . . . . . . . . . . . . . .Georgia. . . . . . . . . . . . . . . . . . . . . . . . . . . . . . . . . . . . . . .Hawaii. . . . . . . . . . . . . . . . . . . . . . . . . . . . . . . . . . . . . . . .Idaho. . . . . . . . . . . . . . . . . . . . . . . . . . . . . . . . . . . . . . . . . .Illinois. . . . . . . . . . . . . . . . . . . . . . . . . . . . . . . . . . . . . . . . .Indiana. . . . . . . . . . . . . . . . . . . . . . . . . . . . . . . . . . . . . . . .Iowa. . . . . . . . . . . . . . . . . . . . . . . . . . . . . . . . . . . . . . . . . . .Kansas. . . . . . . . . . . . . . . . . . . . . . . . . . . . . . . . . . . . . . .Kentucky. . . . . . . . . . . . . . . . . . . . . . . . . . . . . . . . . . . . .Louisiana. . . . . . . . . . . . . . . . . . . . . . . . . . . . . . . . . . . . .Maine. . . . . . . . . . . . . . . . . . . . . . . . . . . . . . . . . . . . . . . . .Maryland. . . . . . . . . . . . . . . . . . . . . . . . . . . . . . . . . . . . .Massachusetts. . . . . . . . . . . . . . . . . . . . . . . . . . . . . . .Michigan. . . . . . . . . . . . . . . . . . . . . . . . . . . . . . . . . . . . . .Minnesota. . . . . . . . . . . . . . . . . . . . . . . . . . . . . . . . . . . .Mississippi. . . . . . . . . . . . . . . . . . . . . . . . . . . . . . . . . . . .Missouri. . . . . . . . . . . . . . . . . . . . . . . . . . . . . . . . . . . . . .Montana. . . . . . . . . . . . . . . . . . . . . . . . . . . . . . . . . . . . . .Nebraska. . . . . . . . . . . . . . . . . . . . . . . . . . . . . . . . . . . . .Nevada. . . . . . . . . . . . . . . . . . . . . . . . . . . . . . . . . . . . . . .New Hampshire. . . . . . . . . . . . . . . . . . . . . . . . . . . . . .New Jersey. . . . . . . . . . . . . . . . . . . . . . . . . . . . . . . . . . .New Mexico. . . . . . . . . . . . . . . . . . . . . . . . . . . . . . . . . .New York. . . . . . . . . . . . . . . . . . . . . . . . . . . . . . . . . . . . .North Carolina. . . . . . . . . . . . . . . . . . . . . . . . . . . . . . .North Dakota. . . . . . . . . . . . . . . . . . . . . . . . . . . . . . . . .Ohio. . . . . . . . . . . . . . . . . . . . . . . . . . . . . . . . . . . . . . . . . . .Oklahoma. . . . . . . . . . . . . . . . . . . . . . . . . . . . . . . . . . . .Oregon. . . . . . . . . . . . . . . . . . . . . . . . . . . . . . . . . . . . . . .Pennsylvania. . . . . . . . . . . . . . . . . . . . . . . . . . . . . . . . .Rhode Island. . . . . . . . . . . . . . . . . . . . . . . . . . . . . . . . .South Carolina. . . . . . . . . . . . . . . . . . . . . . . . . . . . . . .South Dakota. . . . . . . . . . . . . . . . . . . . . . . . . . . . . . . .Tennessee. . . . . . . . . . . . . . . . . . . . . . . . . . . . . . . . . . .Texas. . . . . . . . . . . . . . . . . . . . . . . . . . . . . . . . . . . . . . . . .Utah. . . . . . . . . . . . . . . . . . . . . . . . . . . . . . . . . . . . . . . . . . .Vermont. . . . . . . . . . . . . . . . . . . . . . . . . . . . . . . . . . . . . .Virginia. . . . . . . . . . . . . . . . . . . . . . . . . . . . . . . . . . . . . . .Washington. . . . . . . . . . . . . . . . . . . . . . . . . . . . . . . . . .West Virginia. . . . . . . . . . . . . . . . . . . . . . . . . . . . . . . . .Wisconsin. . . . . . . . . . . . . . . . . . . . . . . . . . . . . . . . . . . .Wyoming. . . . . . . . . . . . . . . . . . . . . . . . . . . . . . . . . . . . .RegionsMidwest. . . . . . . . . . . . . . . . . . . . . . . . . . . . . . . . . . . . . . .Northeast. . . . . . . . . . . . . . . . . . . . . . . . . . . . . . . . . . . . .South. . . . . . . . . . . . . . . . . . . . . . . . . . . . . . . . . . . . . . . . .West. . . . . . . . . . . . . . . . . . . . . . . . . . . . . . . . . . . . . . . . . .8
Table 3. Labor productivity in selected periods, private nonfarm sectorArea NameAverage annual percent 1.02.02.32.91.01.31.01.81.01.41.22.0StatesAlabama. . . . . . . . . . . . . . . . . . . . . . . . . . . . . . . . . . . . . .Alaska. . . . . . . . . . . . . . . . . . . . . . . . . . . . . . . . . . . . . . . .Arizona. . . . . . . . . . . . . . . . . . . . . . . . . . . . . . . . . . . . . . .Arkansas. . . . . . . . . . . . . . . . . . . . . . . . . . . . . . . . . . . . .California. . . . . . . . . . . . . . . . . . . . . . . . . . . . . . . . . . . . .Colorado. . . . . . . . . . . . . . . . . . . . . . . . . . . . . . . . . . . . . .Connecticut. . . . . . . . . . . . . . . . . . . . . . . . . . . . . . . . . .Delaware. . . . . . . . . . . . . . . . . . . . . . . . . . . . . . . . . . . . .District of Columbia. . . . . . . . . . . . . . . . . . . . . . . . . .Florida. . . . . . . . . . . . . . . . . . . . . . . . . . . . . . . . . . . . . . . .Georgia. . . . . . . . . . . . . . . . . . . . . . . . . . . . . . . . . . . . . . .Hawaii. . . . . . . . . . . . . . . . . . . . . . . . . . . . . . . . . . . . . . . .Idaho. . . . . . . . . . . . . . . . . . . . . . . . . . . . . . . . . . . . . . . . . .Illinois. . . . . . . . . . . . . . . . . . . . . . . . . . . . . . . . . . . . . . . . .Indiana. . . . . . . . . . . . . . . . . . . . . . . . . . . . . . . . . . . . . . . .Iowa. . . . . . . . . . . . . . . . . . . . . . . . . . . . . . . . . . . . . . . . . . .Kansas. . . . . . . . . . . . . . . . . . . . . . . . . . . . . . . . . . . . . . .Kentucky. . . . . . . . . . . . . . . . . . . . . . . . . . . . . . . . . . . . .Louisiana. . . . . . . . . . . . . . . . . . . . . . . . . . . . . . . . . . . . .Maine. . . . . . . . . . . . . . . . . . . . . . . . . . . . . . . . . . . . . . . . .Maryland. . . . . . . . . . . . . . . . . . . . . . . . . . . . . . . . . . . . .Massachusetts. . . . . . . . . . . . . . . . . . . . . . . . . . . . . . .Michigan. . . . . . . . . . . . . . . . . . . . . . . . . . . . . . . . . . . . . .Minnesota. . . . . . . . . . . . . . . . . . . . . . . . . . . . . . . . . . . .Mississippi. . . . . . . . . . . . . . . . . . . . . . . . . . . . . . . . . . . .Missouri. . . . . . . . . . . . . . . . . . . . . . . . . . . . . . . . . . . . . .Montana. . . . . . . . . . . . . . . . . . . . . . . . . . . . . . . . . . . . . .Nebraska. . . . . . . . . . . . . . . . . . . . . . . . . . . . . . . . . . . . .Nevada. . . . . . . . . . . . . . . . . . . . . . . . . . . . . . . . . . . . . . .New Hampshire. . . . . . . . . . . . . . . . . . . . . . . . . . . . . .New Jersey. . . . . . . . . . . . . . . . . . . . . . . . . . . . . . . . . . .New Mexico. . . . . . . . . . . . . . . . . . . . . . . . . . . . . . . . . .New York. . . . . . . . . . . . . . . . . . . . . . . . . . . . . . . . . . . . .North Carolina. . . . . . . . . . . . . . . . . . . . . . . . . . . . . . .North Dakota. . . . . . . . . . . . . . . . . . . . . . . . . . . . . . . . .Ohio. . . . . . . . . . . . . . . . . . . . . . . . . . . . . . . . . . . . . . . . . . .Oklahoma. . . . . . . . . . . . . . . . . . . . . . . . . . . . . . . . . . . .Oregon. . . . . . . . . . . . . . . . . . . . . . . . . . . . . . . . . . . . . . .Pennsylvania. . . . . . . . . . . . . . . . . . . . . . . . . . . . . . . . .Rhode Island. . . . . . . . . . . . . . . . . . . . . . . . . . . . . . . . .South Carolina. . . . . . . . . . . . . . . . . . . . . . . . . . . . . . .South Dakota. . . . . . . . . . . . . . . . . . . . . . . . . . . . . . . .Tennessee. . . . . . . . . . . . . . . . . . . . . . . . . . . . . . . . . . .Texas. . . . . . . . . . . . . . . . . . . . . . . . . . . . . . . . . . . . . . . . .Utah. . . . . . . . . . . . . . . . . . . . . . . . . . . . . . . . . . . . . . . . . . .Vermont. . . . . . . . . . . . . . . . . . . . . . . . . . . . . . . . . . . . . .Virginia. . . . . . . . . . . . . . . . . . . . . . . . . . . . . . . . . . . . . . .Washington. . . . . . . . . . . . . . . . . . . . . . . . . . . . . . . . . .West Virginia. . . . . . . . . . . . . . . . . . . . . . . . . . . . . . . . .Wisconsin. . . . . . . . . . . . . . . . . . . . . . . . . . . . . . . . . . . .Wyoming. . . . . . . . . . . . . . . . . . . . . . . . . . . . . . . . . . . . .RegionsMidwest. . . . . . . . . . . . . . . . . . . . . . . . . . . . . . . . . . . . . . .Northeast. . . . . . . . . . . . . . . . . . . . . . . . . . . . . . . . . . . . .South. . . . . . . . . . . . . . . . . . . . . . . . . . . . . . . . . . . . . . . . .West. . . . . . . . . . . . . . . . . . . . . . . . . . . . . . . . . . . . . . . . . .9
Table 4. Contributions to national labor productivity, private nonfarm sectorArea NameShare Weight (percent)National. . . . . . . . . . . . . . . . . . . . . . . . . . . . . . . . . . . . . .Alabama. . . . . . . . . . . . . . . . . . . . . . . . . . . . . . . . . . .Alaska. . . . . . . . . . . . . . . . . . . . . . . . . . . . . . . . . . . . . .Arizona. . . . . . . . . . . . . . . . . . . . . . . . . . . . . . . . . . . . .Arkansas. . . . . . . . . . . . . . . . . . . . . . . . . . . . . . . . . . .California. . . . . . . . . . . . . . . . . . . . . . . . . . . . . . . . . . .Colorado. . . . . . . . . . . . . . . . . . . . . . . . . . . . . . . . . . .Connecticut. . . . . . . . . . . . . . . . . . . . . . . . . . . . . . . .Delaware. . . . . . . . . . . . . . . . . . . . . . . . . . . . . . . . . . .District of Columbia. . . . . . . . . . . . . . . . . . . . . . .Florida. . . . . . . . . . . . . . . . . . . . . . . . . . . . . . . . . . . . . .Georgia. . . . . . . . . . . . . . . . . . . . . . . . . . . . . . . . . . . .Hawaii. . . . . . . . . . . . . . . . . . . . . . . . . . . . . . . . . . . . . .Idaho. . . . . . . . . . . . . . . . . . . . . . . . . . . . . . . . . . . . . . .Illinois. . . . . . . . . . . . . . . . . . . . . . . . . . . . . . . . . . . . . .Indiana. . . . . . . . . . . . . . . . . . . . . . . . . . . . . . . . . . . . .Iowa. . . . . . . . . . . . . . . . . . . . . . . . . . . . . . . . . . . . . . . .Kansas. . . . . . . . . . . . . . . . . . . . . . . . . . . . . . . . . . . . .Kentucky. . . . . . . . . . . . . . . . . . . . . . . . . . . . . . . . . . .Louisiana. . . . . . . . . . . . . . . . . . . . . . . . . . . . . . . . . .Maine. . . . . . . . . . . . . . . . . . . . . . . . . . . . . . . . . . . . . .Maryland. . . . . . . . . . . . . . . . . . . . . . . . . . . . . . . . . . .Massachusetts. . . . . . . . . . . . . . . . . . . . . . . . . . . .Michigan. . . . . . . . . . . . . . . . . . . . . . . . . . . . . . . . . . .Minnesota. . . . . . . . . . . . . . . . . . . . . . . . . . . . . . . . . .Mississippi. . . . . . . . . . . . . . . . . . . . . . . . . . . . . . . . .Missouri. . . . . . . . . . . . . . . . . . . . . . . . . . . . . . . . . . . .Montana. . . . . . . . . . . . . . . . . . . . . . . . . . . . . . . . . . .Nebraska. . . . . . . . . . . . . . . . . . . . . . . . . . . . . . . . . .Nevada. . . . . . . . . . . . . . . . . . . . . . . . . . . . . . . . . . . . .New Hampshire. . . . . . . . . . . . . . . . . . . . . . . . . . .New Jersey. . . . . . . . . . . . . . . . . . . . . . . . . . . . . . . .New Mexico. . . . . . . . . . . . . . . . . . . . . . . . . . . . . . .New York. . . . . . . . . . . . . . . . . . . . . . . . . . . . . . . . . .North Carolina. . . . . . . . . . . . . . . . . . . . . . . . . . . . .North Dakota. . . . . . . . . . . . . . . . . . . . . . . . . . . . . .Ohio. . . . . . . . . . . . . . . . . . . . . . . . . . . . . . . . . . . . . . . .Oklahoma. . . . . . . . . . . . . . . . . . . . . . . . . . . . . . . . . .Oregon. . .
productivity from 2007 to 2020. California, New York, and Texas, which have the largest economies, contributed the most to national productivity growth, about 40 percent of the 1.4-percent increase. Chart 6. Contributions to national labor productivity, ave