Transcription
Concept Mapslow tech: high techDo C-maps help students learn?Do C-maps reveal students’thinking?What evidence will we accept?
QuestionsHow many of you are familiar with conceptmaps?How many of you used concept maps forteaching tools and/or assessment tools?If a concept mapping tool was easilyaccessible on the web, would that influenceyour decision to use them?
KnlacrPowipytotoledge-Concepts are.Lexicalbased
Knowledge-basedYour associations with theterm “rock”.
Lexicalrock: a naturally formed solid that is anaggregate of one or more minerals
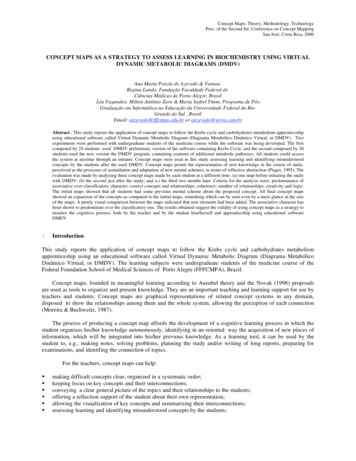
Rock: prototype/exemplar
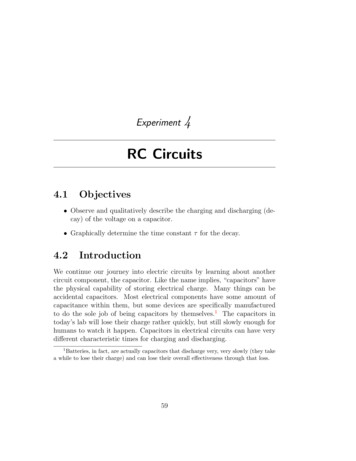
PrototypesWhich isthe baby?Which isa bachelor?
Prototypes6CO2 6H2OC6H12O6 6O2
SorrowPrototypes
cycleTextWhat is the power of visual models?
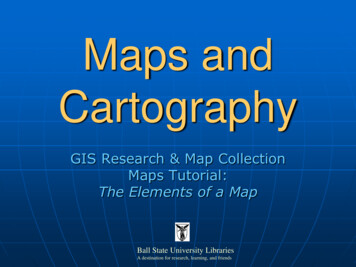
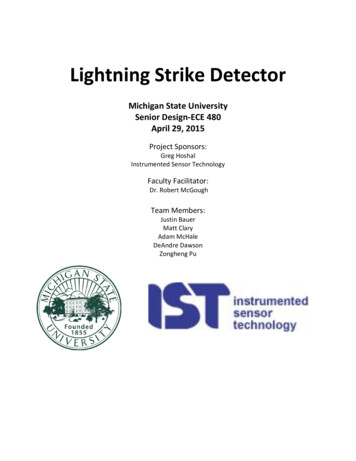
Concept MapsarerepresentdisplayKnowledge orUnderstandingVisual DiagramsOr ModelsStructureHierarchyis constructedwithAssessmentconnectedwithhashasUsed forConceptsLinking WordsOrganizationContextpromotesReflection &LearningPriorKnowledgeNewInformation
Goal: Demonstrate your ability to develop a concept map using low tech and hightech tools.LOW TechC-Map Context:Wetlands are among the most productive ecosystems in the world, moreproductive than tropical rainforests. Differences in rates of primary productivityare influenced by moisture and temperature. Importantly, the carbon cycle is keyto fluctuations in primary productivity. Since primary productivity is examinedand understood at many scales, from the cellular to ecosystem level, it isnecessary that you revisit your thinking about major concepts related to thecarbon cycle and primary productivity.Use C-TOOLS to make a concept map that illustrates both the hierarchy andrelationships between and among concepts listed below. You may add up to 3additional concepts if needed. WORK in PAIRS with ary productivityCarbon dioxideWaterOxygenEnergy
Goal: explain evolution by natural selection
Individual ProblemExplain the phenotypic changes in the treeand the animal. Use your understanding ofevolution by natural selection.Write a short answerDevelop a rubric with your team
What do different forms ofassessment reveal?List the concepts for an exemplary shortanswerNow make a concept map using thoseconceptsCompare extended responses with c-mapWhat evidence from both types ofassessment illustrate students’understanding and misconceptions?
QuestionDo instructional designs and pedagogythat enable students to learn how tomake connections among conceptsaffect their understanding of complexproblems?
Instructional Design/Pedagogy Concept Map 1 -- ecosystemprinciples carry overConcept Map 2 -- biogeochemical cycles principles carry over Concept Map 3 -- natural selection principles carry over Concept Map 4 -- inheritanceprinciples carry overConcept Map 5 -- biodiversitySummative assessment
Summative AssessmentSynthesis level questionsGrandma JohnsonRadishDinosaur/TreeCompare responses with control class did not integrate concept maps
The Grandma Johnson ProblemHypothetical Scenario: Grandma Johnson had verysentimental feelings toward Johnson Canyon, Utahwhere she and her late husband had honeymoonedlong ago. Her feelings toward this spot were suchthat upon her death she requested to be buriedunder a creosote bush overlooking the canyon. Sheloved the idea that she'd become part of thewonderful wilderness and live on through thewildlife that lived there. Think to yourself and beginto trace the path of a carbon atom from GrandmaJohnson's (GJ) remains to where it could becomepart of a coyote (NOTE: the coyote WILL NOTdig up Grandma and consume any of her remains).What fundamental pathways and processes ofbiology will be involved in the transit of GJ'scarbon atoms to that of the wild coyote in Utah?
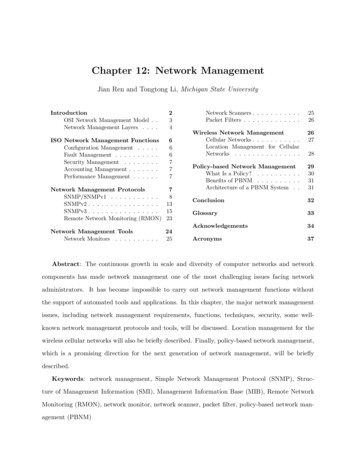
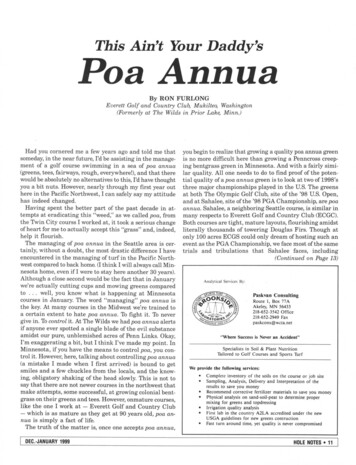
Radish Problem Experimental Setup:Weighed out 3 batches of radish seeds each weighing1.5 g.Experimental treatments:» 1. Seeds placed on moistened paper towels in LIGHT» 2. Seeds placed on moistened paper towels in DARK» 3. Seeds not moistened (left DRY) placed in light
Radish problem (2) After 1 week, all plant material was dried in anoven overnight (no water left) and plant biomasswas measured in grams.Predict the biomass of the plant material in thevarious treatments.» Water, light» Water, dark» No water, light
Results: Weight of Radish Seedlings1.46 g1.63 g1.20 gWrite an explanation about the results.
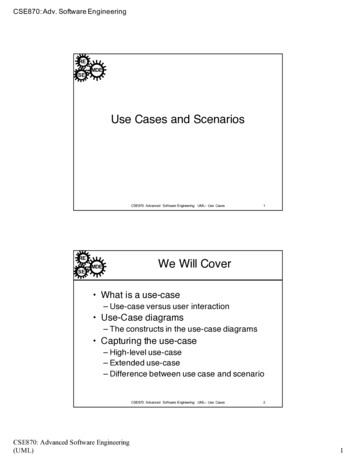
Goal: explain evolution by natural selection
Individual Problem Explain the phenotypic changes inthe tree and the animal. Use yourunderstanding of evolution bynatural selection.
AnalysisCoding of extended responsesIdentification of misconceptionsComparison with control , e.g.,% of key concepts included% of students including specific key concepts% of students including specific misconceptions
Carbohydrates Oxygen Primary productivity Energy Goal: Demonstrate your ability to develop a concept map using low tech and high tech tools. LOW Tech C-Map Context: Wetlands are among the most productive ecosystems in the world, more productive than tropical rainforests. Differences in rates of primary productivity