Transcription
DASH AND PLOTLYFOR INTERACTIVEPLOTTING‘Mayank TiwariSeptember 15, 20201
DASH PLOTLYDash https://plotly.com/dash/ Dash is a productive Python framework for building web applications Written on top of Flask, Plotly.js, and React.js, Dash is ideal for building datavisualization apps with highly custom user interfaces in pure Python Dash abstracts away all of the technologies and protocols that are required tobuild an interactive web-based application Knowledge of HTML & JS is not strictly necessary, but it can help as the functionand call back names of Dash Core Components as it is same asHTML tags & JS‘functionsPlotly https://plotly.com/ Plotly is a free and open-source graphing library for Python Has many ways to customize graphs Works with or without Dash Good & illustrated documentation: https://plot.ly/python/2
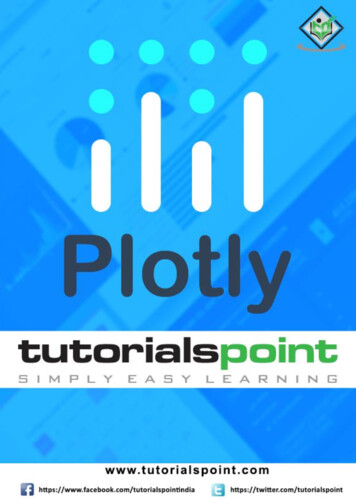
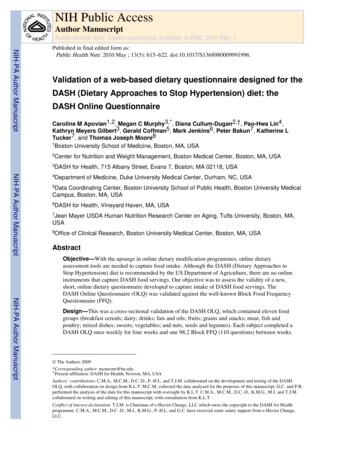
Dash App Gallery‘3
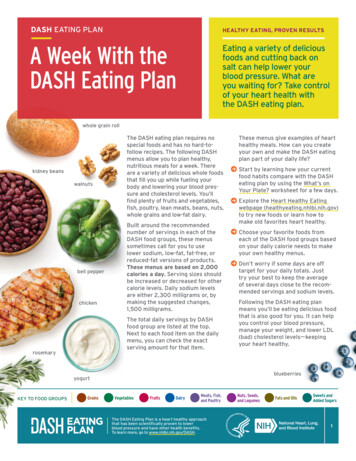
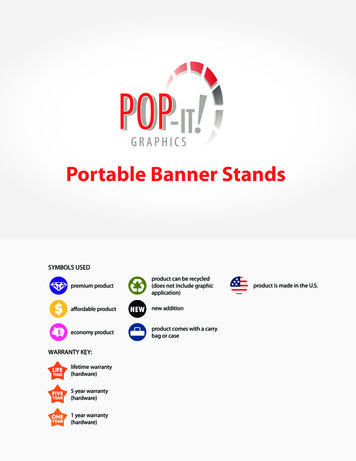
‘Plot.ly ChartGalleryWebsite: https://plotly.com/python/4
Dash Installationpip install dash 1.16.0A quick note on checking your versions and on upgrading. These docs are run using theversions listed above and these versions should be the latest versions available. To checkwhich version that you have installed, you can run e.g. import dash core components print(dash core components. version )‘5
Hello Dash!import dashimport dash html components as htmlapp dash.Dash()app.layout html.Div('Hello Dash!')‘if name ' main ':app.run server()6
Dash – Main Components Layout (UI) - describes what the application looks like Html components: https://dash.plotly.com/dash-htmlcomponents Core components: https://dash.plotly.com/dash-core‘components Callbacks - describes the interactivity of the application7
Dash LayoutHTML . in Pythonimport dash html components as htmlapp.layout html.Div(children [html.H1('Hello Dash',style {'text-align': 'center'}),)‘html.Div(id 'my-div',children 'Dash: A web appframework for Python. ',style {'textAlign': 'center'}),]8
Dash LayoutHTML . in Python . plus core componentsimport dash core components as dcccomponent1 dcc.Dropdown(value 'MTL', options [{'label': 'New York City', 'value': 'NYC'},{'label': 'Montréal', 'value': 'MTL'},{'label': 'San Francisco', 'value': 'SF'}])component2 dcc.Checklist(value ['MTL'], options [{'label': 'New York City', 'value': 'NYC'},{'label': 'Montréal', 'value': 'MTL'},{'label': 'San Francisco', 'value': 'SF'}])‘component3 dcc.Slider(min 0, max 9, value 5)component4 dcc.Tabs(value 'tab-2-example', children [dcc.Tab(label 'tab one', value 'tab-1-example', children [component1,component3]),dcc.Tab(label 'tab two', value 'tab-2-example', children component2)])app.layout html.Div(component4)9
Dash Core Component GraphsCore component that accepts plotly.py go.Figure object!import dash core components as dccimport plotly.graph objs as goimport dashapp dash.Dash()app.layout html.Div(children [html.H1('Hello Graph', style {'text-align': 'center’}),‘dcc.Graph(id 'my-first-graph’,figure dict(data [dict(x [0, 1, 2], y [3, 4, 2])]))])if name ' main ':app.run server()10
Scatter Plot Graph Exampleimport dashimport dash core components as dccimport dash html components as htmlimport pandas as pdimport plotly.express as pxexternal stylesheets ['https://codepen.io/chriddyp/pen/bWLwgP.css']app dash.Dash( name , external stylesheets external stylesheets)df ‘pd.read sets/master/gapminderDataFiveYear.csv')fig px.scatter(df, x "gdpPercap", y "lifeExp", size "pop",color "continent", hover name "country", log x True, size max 60)app.layout html.Div([dcc.Graph(id 'life-exp-vs-gdp',figure fig)])if name ' main ':app.run server(debug True)11
CallbacksCallbacks are Python functions that are automatically‘called by Dash whenever an input component'spropertychanges.Reference: https://dash.plotly.com/basic-callbacks12
Dash CallbacksYou can get callbacks from Button Clicks, Text(Div/P) clicksDropdown list value entered/changedGraph Hover/Click on ValuePeriod timers, URL address change, ‘From Dash Callbacks, you can Update input valuesGenerate new HTML elementsUpdate the CSS style of the layout HTML elementsGenerate any kind of plot.ly graph13
Callbacks - Examplefrom dash.dependencies import Input, Outputdf pd.read ck(Output('life-exp-vs-gdp', 'figure'),Input('year-slider', 'value'))def update figure(selected year):‘filterDf df[df.year selected year]fig px.scatter(filterDf, x "gdpPercap", y "lifeExp", size "pop", color "continent",hover name "country", log x True, size max 60)fig.update layout(transition duration 500)return figapp.layout html.Div([dcc.Graph(id 'life-exp-vs-gdp'),dcc.Slider(id 'year-slider', min df['year'].min(), value df['year'].min(),max df['year'].max(), marks {str(year): str(year) for year in df['year'].unique()}, step None)])14
Callback - Linking@app.callback(Output('year-pop', p', 'hoverData')])def update output div(hoverData):if not hoverData:country ''else:country hoverData['points'][0]['hovertext']filterDf df[df.country country]‘fig px.bar(filterDf, x 'year', y 'pop', title 'Year Vs Population: {}'.format(country))# return 'Output: urn figapp.layout html.Div([dcc.Graph(id 'life-exp-vs-gdp'),dcc.Slider(id 'year-slider', min df['year'].min(), value df['year'].min(),max df['year'].max(), marks {str(year): str(year) for year in df['year'].unique()}, step None),dcc.Graph(id 'year-pop'),])15
‘16
‘17
References thub.com/plotly/dash‘18
DASH PLOTLY 2 Dash is a productive Python framework for building web applications Written on top of Flask,